UBICOMM 2011 : The Fifth International Conference on Mobile Ubiquitous Computing, Systems, Services and Technologies
Capturing Mobile Devices Interactions Minimizing the External Influence
Iván Pretel García
Ana B. Lago Vilariño
DeustoTech –Deusto Institute of Technology Universidad de Deusto Bilbao, Spain
[email protected]
DeustoTech –Deusto Institute of Technology Universidad de Deusto Bilbao, Spain
[email protected]
Abstract—Mobile computing has become an integral part of everyday life for the new 'Information and Knowledge Society'. The new generation of mobile devices and their full connection capabilities enable users to access a wide choice of services and knowledge from everywhere. Owing to this tendency, access to these services has to be improved by developing mobile device interaction models according to the user necessities. According to the ISO/IEC 9126 standard, the quality in use exists inside the quality fields. This kind of quality measures how a product can satisfy the needs of a particular user to achieve specific goals in a specified context. By the revealed quality testing methods focused on mobile applications, it is going to demonstrate it is possible to decrease the external influence caused by the existing capturing tools. Therefore, the contribution revealed is a new approach to user interaction focused on mobile applications where it is possible to improve its results reliability capturing the quality in use and paying special attention to the context of use. In order to do so, we present a study about how to minimize the external influence capturing user interactions. We describe capture methods and existing monitoring systems and also one prototype in order to validate the proposed methodology. This work reveals it is possible to gather user interaction information in mobile environments without the need of any external capturing system. Keywords-Mobile services; quality in use; monitoring; user experience; HCI.
I.
INTRODUCTION
Mobile computing has become an integral part of everyday life for the new “Information and Knowledge Society”. In contrast with the past, when users could access to the knowledge of Internet only by PCs, the new generation of mobile devices and their full connection capabilities enable users to access to this knowledge not only without PCs, but also from everywhere. The ability to access to information and services from everywhere is the main reason that empowers the massive usage of this kind of technology, not only focused on the person but also on business and social groups. Due to the massive usage of mobile applications, one of the main problems this tendency has is the heterogeneity of the final users and their final usage contexts. This problem has to be solved by being aware of the different user interactions, asking why some interactions are good and why are others not so good. The main goal of this work is to
Copyright (c) IARIA, 2011.
ISBN: 978-1-61208-171-7
achieve the correct capture of the user interaction while decreasing the external influence of the capturing tools. In addition, software development is increasingly focused on the user. By measuring the quality in use we find out about how the interaction with mobile devices can be achieved. According to ISO/IEC 9126 [1], the quality in use exists inside the quality fields. Focused on mobile devices, this kind of quality measures how an application can satisfy the needs of the mobile user to achieve specific goals in a specified context with effectiveness, productivity, safety and satisfaction. This work is going to demonstrate that it is possible to reduce the subjectivity caused by the existing quality in use capturing tools. As a result, the contribution revealed is a new approach to user interaction focused on mobile applications (concretely in Symbian OS applications) where it is possible to improve its results reliability paying special attention to the context of use during the quality in use capturing tasks. Firstly, capture methods and existing monitoring systems are shown in Section II. In Section III we present a study about how to minimize the influence capturing user interactions. The mobile interaction monitoring system is presented in Section IV. Section V presents the preliminary evaluation of the implemented system. Finally, the research is concluded and further work discussed in Section VI. II.
QUALITY IN USE FROM QUALITY STANDARD TO MOBILE INTERACTIONS
ISO/IEC 9126 defines a quality of software testing framework by three aspects: Internal Quality, External Quality and Quality in Use. Internal Quality is the totality of characteristics of the software product from an internal view (e.g., cyclomatic complexity, code maintainability, etc.). This kind of quality can be improved during code implementation, reviewing and testing. External Quality is the quality when software is executed, which is measured and evaluated focusing on the software application behaviour (e.g., number of wrong expected reactions of software). Finally, Quality in Use is defined within ISO/IEC 91264. It is the quality of the software system the user can perceive when it is used in an explicit context of use. It measures the extent to which users can complete their tasks in a particular environment. It is measured by four main
200
UBICOMM 2011 : The Fifth International Conference on Mobile Ubiquitous Computing, Systems, Services and Technologies
capabilities of the software product in a specified context of use. Effectiveness: The capability to enable users to achieve specified goals with accuracy and completeness. Productivity: The capability to enable users to expend appropriate amounts of resources in relation to the effectiveness achieved. Safety: The capability to achieve acceptable levels of risk of harm to people, business, software, property or the surrounding environment. Satisfaction: The capability to satisfy users. These capabilities have to be measured in order to calculate what the quality in use of evaluated software is. In order to do so, each capability has to be defined by detecting measurable characteristics. According to the presented standard these characteristics are formed by the following metrics. The effectiveness characteristic can be measured by three metrics: Task Effectiveness (TE), Task Completion (TCM) and Error Frequency (EF). Productivity is measured by Task time (T), Task Efficiency (TEF), Economic Productivity (EP), Productive Proportion (PP) and Relative User Efficiency (RUE). The safety capability has User Health and Safety (UHS), Safety of People Affected (SPA), Economic Damage (ED) and also Software Damage (SD). Finally, satisfaction can be measured by Satisfaction Scale (SS), Satisfaction Questionnaire (SQ) and Discretional Usage (DU). Metrics of quality in use depend on a lot of information (see Table I). The types of data which make up this information are the proportional value of each missing or incorrect component in the task output (Ai); number of tasks completed (TC); number of tasks attempted (TA); number of errors made by the user (E); task time (T); total cost of the task (C); spent help time (H); spent error time (Et); search time (S); ordinary user’s task efficiency (OU); expert user’s task efficiency (EU); number of users reporting Repetitive Strain Injury such as headaches or fatigue (RSI); total number of users (U); number of people put at hazard (PH); total number of people potentially affected by the system (PPA) ; the number of occurrences of economic damage (OED); number of occurrences of software corruption (OSC); total number of usage situations (US); questionnaire producing psychometric scales (PS); population (P); responses to a question(Qi); number of total responses (n); number of times that specific software functions/applications/systems are used (A) and also the number of times they are intended to be used (B). Knowing the metrics we have to know how these metrics can be measured when the interaction is taking place. Evaluation of the quality in use of desktop or web applications is relatively simple because their context is always the same. Contrary to this kind of software, mobile applications are hardly ever doing their tasks in the same context. On account of this reason, every mobile software capability has to be measured per task and also per user, who is surrounded by the context in which actions are needed to
Copyright (c) IARIA, 2011.
ISBN: 978-1-61208-171-7
be tracked. Owing to the wide range of contexts, an explicit context in use definition focused on mobile interactions has to be defined. This context will influence the interaction and also the captured metrics. TABLE I.
METRICS OF QUALITY IN USE
Metric
Formula
TE
|1-ΣAi|
TCM
TC/TA
EF
E/T
What is the frequency of errors?
T
T
How long does it take to complete a task?
TEF
TE/T
How efficient are the users?
EP
TE/C
How cost-effective is the user?
PP
(T-H-Et-S) /T
RUE
OU/EU
UHS
1-RSI/U
SPA
1- PH/PPA
ED
1-OED/US
SD
1-OSC/US
SE
PS/P
How satisfied is the user?
SQ
Σ(Qi)/n
DU
A/B
How satisfied is the user with specific software features? What proportion of potential users chooses to use the system instead of others?
III.
Definition What proportion of the goals is achieved correctly? What proportion of the tasks is completed?
What proportion of the time is the user performing productive action? How efficient is a user compared to an expert? What is the incidence of health problems among users of the product? What is the incidence of hazard to people affected by use of the system? What is the incidence of economic damage? What is the incidence of software corruption?
MINIMIZING THE INFLUENCE OF THE MOBILE INTERACTION MONITOR
All necessary metrics that are used to measure the quality in use focused on mobile interaction are defined. Now we have to define the way to monitor them. So as to carry out the mobile interaction monitoring, we should study the best way to capture it. Firstly, to capture the above explained metrics a new methodology has been defined but the context has to be meticulously studied. Once the context has been studied, the best method to capture these metrics has to be chosen by studying the existing method. A. Context in use during mobile interaction According to ISO 9241-11[2] standard, context in use is defined as all the users, tasks, equipment and also physical and social environment that are affected by the interaction. In 2007 the NIST [3] institute published a new document adding every description of stakeholders to the context in use defined in the first standard. Another context in use definition is specified by Kankainen [4]. He defines context in use as the environment that surrounds the user and his community. There exist a lot of definitions [5] of context but, according to Nadav Savio and Jared Braiterman [6] the context can be defined by enumerating the following layers:
201
UBICOMM 2011 : The Fifth International Conference on Mobile Ubiquitous Computing, Systems, Services and Technologies
culture, environment, activity, goals, attention, tasks, interface, device, connection and carrier. According to the given definitions, the different mobile context components are user, mobile device and environment. The user has to be described through four main groups of attributes: personal, knowledge, skills and attitudes. Personal attributes are name, age and sex. The attributes related to knowledge are those attributes that can affect language, systems, products, work area, experience and eases with the tasks defined, culture, education level and experience using similar products. Physical abilities, mental abilities, disabilities and qualifications form the skills group. The attitudes group is formed by motivations, previous experiences and expectations. The environment is also formed by groups of attributes: physical, ambient, technical and sociocultural groups. Inside the physical group there are attributes that describe the tangible environment (e.g., work area dimensions). The aim of ambient group is to keep attributes that can describe meteorological conditions, such as humidity, temperature or sound level. The sociocultural attributes group defines the cultural and social agents that can determine the user experience (e.g., cultural habits, religion, etc.). The technical group defines every characteristics used during the tests excluding the mobile device, for example, connectivity attributes, hardware and software characteristics, and so on. If the work is focused on mobile environments studies, the quality in use is highly context-dependent. It is widely acknowledged that mobile environments are continuously changing. Therefore, context in use focused on mobilehuman interaction is formed by one mobile device, its owner, and also every environment that appears during the tasks execution. On the one hand, the user and his mobile device are static, which means they do not change during the task execution. On the other hand the environment is constantly changing. In fact, during only one task execution (e.g., living in a big city) the user can be in more than one environment (e.g., starting task walking down the street and finishing it by bus). As a result, the interaction monitoring system has to be aware of this problem. In fact, it has to be designed and implemented in order to go unnoticed during the user experience. B. Categorization of mobile interaction capturing methods During the design of the presented tracking system various interaction tracking tools were studied. The Observer [7] and Morae [8] among others. Studying quality testing methods, two kinds of methods have been identified: in a laboratory or in the mobile context. Testing executed in laboratory is easy because all influencing factors can be controlled and data can be recorded with several cameras and capturing tools. However, the context, which is the influential factor, is not considered or it can hardly be simulated. In contrast to the laboratory methods, context aware methods mean that all data can be captured within real context influence.
Copyright (c) IARIA, 2011.
ISBN: 978-1-61208-171-7
Due to acquire valid quality in use data, it is necessary to capture objective information about what the test user really does. Each capturing tool has to use cameras, human observers and so on to achieve this aim. These added elements influence the context. For example, if a user whose phone has external capturing accessories (e.g., added camera) is followed by a human observer, he will feel uncomfortable and he will change his behaviour. Consequently, this interaction will be corrupted and it can have a tendency to show expected (but not real) results. In summary, capturing data focused on mobile context can provide deeper and objective information. Camera installation can alter the environment, mobile device and also the user. The presence of a human observer can drastically alter the behaviour of the user. Therefore, the best way to capture interaction data is by registering information through a mobile device. This final method is the main goal the exposed system aims to achieve. C. Mobile interaction capturing methods According to James Hom [9], usability testing is carrying out experiments to find out specific information about a design and a user experience. Specifically, our methodology has adapted the performance measurement method. It is targeted at determining hard, quantitative data, such as the quality in use metrics. The overall process we have chosen is simple. Firstly some relevant users are selected. Users perform specific tasks with the mobile device and this performance is registered. Finally, these data are analyzed. In the process, several methods are used to aim at specified steps of it. In order to get relevant users with relevant contexts we have used the contextual inquiry method. It is basically a structured field interviewing method. It is more a discovery process than an evaluative process, it is more like learning than testing. One of the core principles of contextual inquiry is that understanding the context in which the software is used is essential for the design. This method is used to indicate the different contexts in which a user can be. The aim of using this method is to model every context in which users have to perform the different tasks of the experiment. Self-reporting logs are paper-and-pencil journals in which users are requested to log their actions and observations while interacting with a product. This method allows the evaluator to perform user evaluation at a distance. This technique requires much more work on the part of users, and, because of that, by developing a software solution we allow logging, thus automatically minimizing the user overwork. Screen Snapshots complements the logging by graphical information of the user experience. Like most user testing, you provide the user with software and the user is provided with software to perform several user tasks. In addition, you provide the user with a logging program and instructions about when and how to activate the capture software. Moreover, questionnaires are written lists of questions that you distribute to your users. Questionnaires are written lists, not ad hoc interviews, and also require more effort on the part of the users, as they have to fill out the questionnaire
202
UBICOMM 2011 : The Fifth International Conference on Mobile Ubiquitous Computing, Systems, Services and Technologies
IV.
IMPLEMENTING THE MOBILE INTERACTION MONITORING SYSTEM
TABLE II.
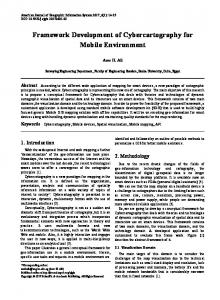
Figure 1. Architecture of the mobile interaction monitoring system.
A. Users and context specification The first step is to recover information about the user and his contexts. In other words; who, where, when and what should do. These data are asked to users and stored in a
Copyright (c) IARIA, 2011.
ISBN: 978-1-61208-171-7
SAMPLES OF THE CONFIGURATION FILES USED BY THE MOBILE APPLICATION
File type
Questions File
As we have mentioned, the mobile interaction monitoring system has to capture not only the necessary metrics of quality in use, but also do so in the most objective way. The exposed monitoring system in Figure 1 is made up of a tiny mobile application that is able to capture the interaction and a desktop application that is able to simulate the interaction captured by the mobile application and calculate every metric that makes up the quality in use. Firstly, mobiles phones used to execute experiments have to be configured and also lent to the users. Every user can execute the specified experiments when they want, and straight afterwards they have to return their devices. Then, the captured interaction can be simulated by the desktop application. Lastly, every characteristic of quality in use can be measured.
database. This information is used to detect in which context users have got problems. Information retrieved has been asked only about two kinds of contexts: walking down the street and at home. Moreover, we have retrieved personal information about the user as his age, sex, English knowledge and their experience using maps among others.
Tasks File
and return it to you. By this method we can pick up every metrics that we cannot recover by using automatic methods. Although questionnaires are very subjective, they are the way we have to acquire metrics related to satisfaction and security among others.
Sample Nokia Ovi Maps Walking down the street Search Nafarroa Kalea 6, Bilbao, Spain and show it on the map Type Nafarroa Kalea 6, Bilbao, España and push search button 1_1.txt ScrSht/1_1/ STANDAR_TEST Show it on the map with satellite view 1_2.txt ScrSht/1_2/ STANDAR_TEST How many times have you needed help? 12 34 54 67 89 More than 9 What is the average in minutes of this helps? 12 34 54 67 89 More than 9
203
UBICOMM 2011 : The Fifth International Conference on Mobile Ubiquitous Computing, Systems, Services and Technologies
B. Configuration of the devices Before the capture, every device has to be configured by the expert, who carries out the evaluation of the interaction. First of all, every task and its context have to be specified. In order to do so, the expert should make the tasks specification file (see Table II). This file is made in XML format and it has information of every task that the user has to perform. Each task definition has a generic name of the context where it has to be executed (e.g., walking down the street). This file has to be stored in the device of the user in order to be ridden during the testing phase. In addition to this file, the expert has to store the questions file inside the devices. This file has questions that will be asked by the user. The questions that have to be answered are “How many times have you needed help?”, “What is the average in minutes of this helps?”, “How many Economic Damage incidents have you had using this application?”, “How many health incidents have you had using this application?”, “How many situations have you had to use the application?”, “How many persons have been affected by the app?”, and “How many persons have been at risk caused by the app?. Every mobile device has a tiny, user friendly application. This application is used by the user to interact with the interaction capturing tool. It reads configuration files and shows the execution of the experiment. After the loan of the device, the user has to run the GUI tiny application called capturer. The capturer reads the task file and this way the user can select a specified task (e.g., find the Guggenheim museum) to do in a specific context. Secondly, he has to notify the task starting to the capturer by its graphic interface. After task execution, the user should advise the task ending through the mobile application. Finally, the user has to answer test questions (showed by reading the questions file) in order to end the data capturing. The capturer can capture data by saving screenshots and the user actions. Every key pressed is logged within its timestamp and its corresponding screenshot. The information generated by the mobile application is stored in three types of files: image file (png format), test answers files (xml format) and log file (text format). This application is developed for N96 mobile. Its Graphical User Interface (GUI) has been developed in J2ME language. Java Virtual Machine for J2ME has screen and key access limitation. If the application has not got the focus, it cannot access to screen and keys. This limitation was solved developing an interface monitor (module that can capture data interaction) in PyS60 (Python on Symbian Series 60).
Figure 2. Interaction during the task performance.
Copyright (c) IARIA, 2011.
ISBN: 978-1-61208-171-7
C. Interaction data analysis After the capture, the interaction data captured during the execution phase is dumped in one PC provided with the interaction analysis tool. Unfortunately, some metrics, needed to calculate the quality in use characteristics, are not captured automatically. In order to capture it the desktop application has a simulator. The expert can reproduce the interactions through this simulator. During the simulation the expert can fill the quality in use metrics in order to calculate the final results. The simulator can interpret all captured data (logs and test answers) and store their results in the database of the system. After the data interpretation, the simulator can also store every metric completed by the expert. The analysis module can read every interpreted data and calculate all quality in use characteristics. Finally, the report builder can build reports which can include all information about the experiment.
Figure 3. Screenshot of the simulator module in the desktop application.
V.
PRELIMINARY EVALUATION
The implemented version of the system was validated by one preliminary evaluation. We have used four Nokia N96 phones used by four users (see Table III), performing tasks within two different contexts: at home (H) and walking down the street (W). The methodology presented in this work was followed. First, the devices were configured by creating and copying the configuration files according to tree different tasks (see Table IV). Then, phones were lent and users have been performing the tasks during 1 week. When the phones were returned, interaction data were dumped into the desktop application. After dumping data, the expert evaluated every interaction by means of simulating them to complete all metrics. Finally, the quality in use report was generated. According to the averages shown, we can see that walking down the street context is more unsafe than using the application at home context.
204
UBICOMM 2011 : The Fifth International Conference on Mobile Ubiquitous Computing, Systems, Services and Technologies
Although walking down the street users are more satisfied, they are more productive and efficient at home. Moreover, our system shows that inexpert users are less productive than expert ones. TABLE III.
INFORMATION OF THE VOLUNTEERS Users
Attributes
1111
2222
3333
4444
Male
Male
Female
Female
Age (years)
26
28
23
25
English (0..100)
80
50
5
75
Experience using maps (0..100)
60
85
10
25
Gender
Figure 4.
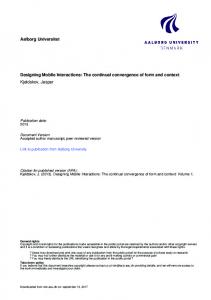
Sources of data and metrics used to measure the quality in use.
H
W
1111
2222
3333
4444
Effectiveness
0.678
0.621
1
1
1
0.833
Productivity
0.892
0.881
0.931
0.908
0.854
0.853
We have studied a context model for mobile interaction design and a better way to capture the user interaction. In the future, according to the retrieved feedback, the interaction has to be spontaneous. Because of that, we are going to study how to detect what action done by the user is interesting to capture. According to the sources graph in Figure 4, we can see two kinds of agents that can alter the results of evaluations: experts (by simulation tools) and users (by doing tests). The first external influence can be removed by automatic algorithms. On the contrary, if the interaction is captured by tests shown by a mobile device, removing the subjectivity caused by the users is very difficult. Consequently, our efforts will be focused on the first area. This work reveals whether the quality in use testing is focused on mobile interaction, we have to take care following interactions because the context can be easily influenced. If we go to the zoo, we cannot study the real wild life of an animal. We have to observe carefully without being part of this context.
Safety
0.528
0.439
0.624
0.504
0.431
0.371
[1]
Satisfaction
0.528
0.656
0.667
0.667
0.422
0.667
TABLE IV. Task Task1: Direcction search Task2: Services search Task3: Configuration
INFORMATION OF THE TASKS
Subtasks
Name
1.1
Search
1.2
Show
2.1
Locatio n
2.2
Search
3.1
Change route
TABLE V. Attributes
Description Search Nafarroa Kalea 6, Bilbao, Spain and show it on the map Show it on the map with satellite view Locate the main cursor on Bilbao map Search nearby museums and select Guggenheim museum Go to adjusts and change route mode to on foot
AVERAGES OF THE RESULTS
Contexts
Users
a.
Values between 0(worst) and 1(best).
Having these results we can say that the implemented system can measure quality in use focused on mobile interactions. However, after the experiment we interviewed the users and their main feedback was they did not like perform tasks because of a request. They felt at ease and, according to their answers, they did not feel observed and their behaviour was as if they were not doing an experiment. VI.
[2]
[3]
[4]
[5]
CONCLUSION AND FUTURE WORK
The ability of mobile devices to access information and services from anywhere is the main reason that empowers the massive usage of this kind of technology. Owing to this tendency, software quality has to be improved by developing mobile device interaction models according to the user necessities. In order to design successful mobile interactions, we must be aware and understand the context in which they take place so as not manipulate it.
Copyright (c) IARIA, 2011.
ISBN: 978-1-61208-171-7
[6]
[7]
[8]
[9]
ISO/IEC 9126:2001, “Information Technology - Software Product Evaluation Quality Characteristics and Guidelines for their use”, 2001. ISO 9241-11:1998(E), “Ergonomic requirements for office work with visual display terminals (VDTs) Part 11: Guidance on usability”, 1998. NISTIR7432, “Information Access Division Information Technology Laboratory, Common Industry Specification for Usability Requirements”, 2007. A. Kankainen, “Thinking model and tools for understanding user experience related for information appliance product concepts”. Dissertation of Anu Kankainen, 2002. M. Obrist, M. Tscheligi, B. de Ruyter, and A. Schmidt, “Contextual user experience: how to reflect it in interaction designs?”. CHI 2010, Atlanta, Georgia, USA, April 10–15, 2010, pp. 3197–3200 S. Nadav and B. Jared, “Design Sketch: The Context of Mobile Interaction”. Mobile HCI 2007, Singapor, September, 2007, pp. 284–286. “The Observer XT” http://www.noldus.com/human-behaviorresearch/products/the-observer-xt (retrieved on March 20, 2011) “Morae: usability testing and market research software”. http://www.techsmith.com/morae.asp (retrieved on March 20, 2011) J. Horn, “The Usability Methods Toolbox Handbook”, 1998.
205