Available online at www.sciencedirect.com
ScienceDirect Procedia Environmental Sciences 23 (2015) 39 – 47
International Conference on Tropical and Coastal Region Eco-Development 2014(ICTCRED 2014)
Carbon Biomass Algorithms Development for Mangrove Vegetation in Kemujan, Parang Island Karimunjawa National Park and Demak Coastal Area – Indonesia Agus Hartokoa,b,*, Siska Chayaningruma, Dewati Ayu Febriantia, Dafit Ariyantob, Suryantia a
Dept of Fisheries. Fac of Fisheries and Marine Science. Diponegoro University. Semarang. Indonesia b Master Program-Coastal Resources Management, Diponegoro University. Semarang.Indonesia
ABSTRACT The increase and accumulation of greenhouse gases such as CO2 was believed had caused global warming. Effort to decrease accumulation these gases is by increasing the role of mangrove forests with its ecological function as carbon sinks through good management system. To this date, very limited study on the mangrove carbon biomass using satellite data espescially in tropical region. Purpose of the research were to calculate the carbon biomass of mangrove vegetation above ground through allometric equations, and to build spatial model algorithms of each mangrove species in the region by remote sensing technology using Quickbird, Geo Eye and ALOS satellite data. The research use an exploratory field survey and purposive sampling method and was performed through the measurement of trunk diameter (DBH) of above ground mangrove biomass without damaging vegetation (non-destructive sampling). About 21 mangrove species in Kemujan Island with total mangrove biomass above ground consist of the trunk, branches, leaves : 182.4 ton or 91.2 tons of Carbon, with largest carbon storage in the trunk. The results of spatial algorithms mangrove carbon biomass for Kemujan island using Quickbird data are Ceriops tagal with Y= - 0.003(B2/B3)2 + 0.267(B2/B3) – 3.452; Rhizophora apiculata with the algorithm Y= 0.001(B2/B3 )2 0.116(B2/B3) + 3.415; Bruguiera cylindrical with the algorithm Y= - 0.003(B2/B3)2 + 0.336(B2/B3) – 7.265; Xylocarpus granatum with algorithm Y= 0.000(B2/B3)2 - 0.058(B2/B3) + 2.101; Rhizophora mucronata with the algorithm Y= 0.000(B2/B3)2 - 0.022(B2/B3) + 1.941. Mangrove carbon biomass algorithm using Geo Eye satellite data at Parang island for Rhizophora mucronata Y = -0.0436(B2/B3)2 + 0.526 (B2/B3) – 1.4642; Bruguiera gymnorrhiza Y = - 0.0027 (B2/B3)2 + 0.0649 (B2/B3) – 0.2432 and Bruguiera cylindrical Y = - 0.0089 (B2/B3)2 + 0.0632 (B2/B3) – 0.0683. Total mangrove carbon biomass at Demak coastal area range from 2.9 – 44.74 ton. Algorithm of mangrove carbon biomass at Demak using ALOS-AVNIR satellite data for Avicennia marina was Y = - 79.18 ((B1-B2)/(B1+B2))2 + 31.35 ((B1-B2)/(B1+B2)) - 1.191. The research concluded that band rationing of Band-2 with Band-3 for Quickbird and GeoEye data and Band-1 with Band-2 for ALOS data as the spectral signature of mangrove chlorophyll pigment with wave length of 0.5 - 0.6 μm as the best for mangrove carbon algorithms. © Published by Elsevier B.V.B.V. This is an open access article under the CC BY-NC-ND license © 2015 2014The TheAuthors. Authors. Published by Elsevier (http://creativecommons.org/licenses/by-nc-nd/4.0/). Peer-review under responsibility of scientific committee of the ICTCRED 2014. Peer-review under responsibility of scientific committee of the ICTCRED 2014
Key words : mangrove, carbon biomass, Quickbird, GeoEye, ALOS
1878-0296 © 2015 The Authors. Published by Elsevier B.V. This is an open access article under the CC BY-NC-ND license (http://creativecommons.org/licenses/by-nc-nd/4.0/). Peer-review under responsibility of scientific committee of the ICTCRED 2014 doi:10.1016/j.proenv.2015.01.007
40
Agus Hartoko et al. / Procedia Environmental Sciences 23 (2015) 39 – 47
* Corresponding author. Tel.: +62-24-8452560.; fax: +62-24-8452560. E-mail address:
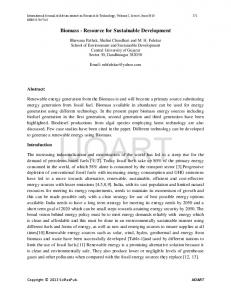
[email protected] Introduction Climate change as the effect of global warming with the increase of atmospheric and seawater temperature was related with the increase of greenhouse gasses from industrial and human activities. That is caused by excessive accumulation of greenhouse gasses such as CO2, CH4, NOX, CFC. One effective solution to prevent or reducing of global warming are adaptation and mitigation [1-4]. Mitigation with replantation and rehabilitation on mangrove ecosystem would be expected to reduce the concentration of CO2 in the atmospher. Therefore need a quantification method to measure carbon mangrove trees (trunk, branch, leaf) as baseline in the mangrove rehabilitation and management. Rehabilitation of mangrove was one effective meassures to increase biomass and carbon and will decresase CO2[5-8]. Ecologically, mangrove ecosystem role as buffer zone in coastal area and in specific role as spawning ground, nursery ground as well as for feeding ground for coastal organisms, which highly dependence to mangrove ecosystem. Mangrove role as primary productivity with large number of organic, detritus from mangrove leaf and nutrients [9-11]. Effective mangrove carbon measurements for a wide area need spatial algorithm based on the field allometric plots. The use and development of spatial algorithms to measure mangrove carbon will have some advantages such as wide area coverage, high spatial resolution as well as time series capability for monitoring in a digital spatial database system. To this date there is no mangrove carbon algorithms using high resolution satellite data with high accuracy had been developed for tropical area such as Indonesia. Aims of the research were to observe mangrove species composition, biomass and carbon and spatial algorithm develoment using Geo-Eye data for Parang island, Quickbird data for Kemujan island and ALOS_AVNIR data for Demak area. Field measurement was done on 7 - 12 November 2012 at Parang island, and on 2013 for Kemujan island, Karimunjawa islands and July 2010 for Demak coastal area. Spatial analysis and algorithms develpments was done at Marine Geomatic Laboratory – Diponegoro University, Semarang. Materials and Methods Field equipments were consist of GPS (Global Positioning System) for sampling coordinate, rope- roll 30 meter, mangrove identification, salinity refractometer, compas, digital camera. Software used for spatial analysis was ER Mapper ver-7. High resolution satellite data used in the study were GeoEye for Parang island, QuickBird data for Kemujan island and ALOS_AVNIR data for Demak coastal area. Field measurements are trunk diameter,tree height and mangrove species for community structure study. Field measurements in the field were designed with 1x1m, 5x5m and 10x10m plot size [12]. Plot of 3 station at Parang island (see Fig.1) are station I (Legon Batu Hitam) at the north part with wide of mangrove area 4.57 Ha, station II (Legon Batu Merah) at the east wide mangrove area 3.94 Ha, and station III (Legon Ipik) at the west wide of mangrove area 4.16 Ha. Ten stations at Kemujan island where St. 1 consist of 22 plots, St. 2 : 28 plots, St. 3 : 19 plots, St.4 : 19 plots, St. 5 : 32 plots, St.6 : 6 plots, St. 7 : 12 plots, St. 8 : 5 plots, St. 9 : 10 plots, St. 10 : 9 plots.
Figure 1. Position of the sampling station and transect line at Parang (above-left), Kemujan island (below-left) and Demak coast (below-right)
Agus Hartoko et al. / Procedia Environmental Sciences 23 (2015) 39 – 47
Field measurement used line transect and plot method [13-15]. There were transect-line with purposive plots and vertical against the coastal line landward, with distance between plots was 50 meter. Mangrove biomass and carbon analyisis was done for the above ground biomass measurement covering the trunk, branch and leaf. Mangrove biomass and carbon was done with non destructive method using the allometric equation. Procedure for the above ground measurements are [16] : a. Record of local and latin name, measure DBH = diameter at breast height = 1.3 m above ground both diameter bigger than 4 cm and less than 4 cm, b. Measure of trunk circle (2 π r); c. trunk diameter; c. height of tree; and d. Dry weight biomass and carbon based on the allometric equation Rhizophora mucronata, Bruguiera gymnorrhiza, Bruguiera cylindrica were using [17] and Avicennia marina using [18]. Mangrove carbon estimation based on allometric equation of [19-22] which explain that value of C = 0.5 W, where C = Carbon (ton C), W = Biomass (kg), 0.5 = convertion factor. Satellite data processing. Mangrove carbon algorithms development were done based on band rationing using selected chlorophyll-band in considering the spectral character of each band. After a series of preliminary band composite exploration proceure the research had confirmed that the most suitable band composite method of satellite data was RGB 231. In order to increase the spatial and spectral accuracy of the result, then the selected area of mangrove for further analysis should be cropped. Mangrove carbon algorithm was developed based on the highest polinomial correlation coefficient (r) between satellite data DN (digital number) of Band-1, Band-2 for ALOS_AVNIR data Band-2, Band-3 rationing for GeoEye and Quickbird with the field measurement data. The use of Band-1 and Band-2 of ALOS data with wave length of 510 – 580 nm or 0.51 – 0.58 μm and Band-2 with Band3 of GeoEye and Quickbird data with wave length of 655 – 690 nm or 0.66 – 0.69 μm were based on consideration that data recorded in these band had measured the chlorophyll pigment of mangrove [23].
Results and Discussion Spesies found at all stations at Parang island for all growth category (mangrove-tree, mangrove-sapling, mangrove-seedling) were Rhizophora mucronata. At station I and II only 2 species of mangrove Rhizophora mucronata and Bruguiera gymnorrhiza. Station III more species mangrove were found Rhizophora mucronata, Bruguiera gymnorrhiza, Bruguiera cylindrica, and Avicennia marina. Value of mangrove tree biomass at Parang island of Basal Area (BA), Density (A), Frequency (F), Domination (D), Relatif Density (RA), Relative Frequency (RF), Relative Domination (RD) and Important Value Index (IVI) by species at Parang island for mangrove-tree growth category was presented as in Table 1 and mangrove biomass and carbon at each stations were presented in Table 2. Table.1. Value of Basal Area (BA), Density (A), Frequency (F), Domination (D), Relatif Density (RA), Relative Frequency (RF), Relative Domination (RD) and Important Value Index (IVI) for Mangrove-Tree category at Parang island
41
42
Agus Hartoko et al. / Procedia Environmental Sciences 23 (2015) 39 – 47
Table 2. Mangrove Biomass ad Carbon in Mangrove Tree, Branch and Leaf at each station at Parang island, Karimunjawa islands
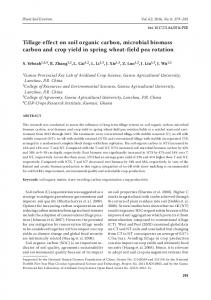
Spatial algorithm developemnt. Band ratio of Band2/Band3 using GeoEye data was found with the highest correlation coefficient (r) between GeoEye DN (Digital Number) with field data, compared with Band-2, or Band-3 for mangrove carbon estimation (see Fig 1). Algorithm resulted for Rhizophora mucronata for station I was Y = - 0.0436 (B2/B3)2 + 0.526 (B2/B3) – 1.4642 with r = 0.8093 (Fig 2). Algorithm resulted for Rhizophora mucronata for station II was Y = - 0.0021 (B2/B3)2 – 0.0012 (B2/B3) + 0.0914 with r = 0.7181 with range of mangrove carbon value of Rhizophora mucronata between 0,001 – 0,12 ton C. Algorithm resulted for Rhizophora mucronata for station III was Y = - 0.0018 (B2/B3)2 + 0.0135 (B2/B3) – 0.0075 value of r = 0.7765 with range of mangrove carbon between 0.0007 – 0.0934 ton C as shown in Fig 2.
Figure 2. Algorithms of mangrove carbon for Rhizophora mucronata at station I and III and Bruguiera gymnorrhiza at station I and II
Agus Hartoko et al. / Procedia Environmental Sciences 23 (2015) 39 – 47
Algorithm resulted for Bruguiera gymnorrhiza station I, Y = - 0.0027 (B2/B3)2 + 0.0649 (B2/B3) – 0.2432 with r = 0.8086 with range of mangrove carbon between 0.0001 – 0.081 ton C. Algorithm resulted for Bruguiera gymnorrhiza station II, Y = - 0.0163 (B2/B3)2 + 0.1712 (B2/B3) – 0.4072 with r = 0.8733 with range of mangrove carbon between 0.0006 –0.0788 ton C. Algorithm resulted for Bruguiera gymnorrhiza station III, Y = - 0.0005 (B2/B3)2 – 0.0028 (B2/B3) + 0.0511 with r = 0.7499 with range of mangrove carbon between 0.0005 – 0.0573 ton C at Fig 2. Mangrove carbon algorithm for Bruguiera cylindrica that only found at station III was Y = - 0.0089 (B2/B3)2 + 0.0632 (B2/B3) – 0.0683 with r = 0.7290 with range of carbon between 0.0014 – 0.0619 ton C. Bruguiera gymnorrhiza will grow better at coastal susbtrate of clay and sometime at sand [24]. Station III at the west part of Parang species of Bruguiera cylindrica and Avicennia marina were also had been found and Avicennia spp usually found near to the sea. Mangrove at Parang island was dominated by Rhizophora mucronata value of density of the three stations between 1656 – 4122ind/ha. According to the Ministry of Environments classification No. 201 year 2004 that Parang island can be classified as high density of mangrove with more than 1500 ind/ha. Rhizophora mucronata had been found have mostly high IVI value at three stations with range 164.70 – 217.39. Convertion based on carbon per hectare with 0.09 hectare resulted with 147.44 ton/ha biomass (73.72 ton C/ha) for station I, 116.22 ton/ha biomass (58,11 ton C/ha) at station II and 121,22 ton/ha biomass (60,61 ton C/ha) at station III or average of the three stationis 128.29 ton/ha which relatively low compared mangrove at Merbok with 245 ton/ha and with more intensive management will reach to 300 ton/ha [25- 28]. There were 21 species of mangrove which belongs to 5 Family had been found at Kemujan island, Karimunjawa islands consist of Acrosticum aureum (Pteridaceae), Acanthus ebracteatus, A. Ilicifolius (Acanthaceae), Aigiceras corniculatum (Myrsinaceae), Avicennia marine (Avicenniaceae), Bruguiera cylindrica, B. Gymnorhisa, B.sexangula, Ceriops tagal, Rhizophora apiculata, R.stylosa, R.mucronata (Rhizophoraceae), Excoecaia agallocha (Euphorbiaceae), Heritiera littoralis (Sterculiaceae), Lumnitzera racemoca, L.littorea (Combretaceae), Sonneratia alba, S.ovata (Sonneratiaceae), Scyphipora hidrophyllacea (Rubiaceae), Xylocarpus moluccensis, X.granatum (Meliaceae). Dominant mangrove species were Excoecaria agallocha, and Ceriops tagal. Result of inventarization by Karimunjawa Conservation office [13] had found before there were about 25 true mangrove at the island. Species of Excoecaria agallocha and Ceriops tagal usually found at the edge of the island. Excoecaria agallocha and Ceriops tagal belongs to family of Euphorbiaceae and Rhizophoraceae will grows well at clay and sandy substrate [29]. Species of Xylocarpus granatum with number of tree of 142 having 21.36 ton C, Bruguiera cylindrica with number of tree of 279 with 19.51 ton C. Rhizophora apiculata have the highest trunk carbon of 27.25 ton C and total mangrove biomass in the area was 182.62 ton biomass (equal to 91.31 ton C) with total number of three 977. This value was lower if compared with mangrove at Merbok with 245 ton/Ha [25] or total carbon of Ciasem West-Java with 364.9 ton/Ha biomass or carbon 182.5 ton C/Ha [30, 31, 26, 27, 28, 32] which is also lower than Parang island with 192.44 ton C/Ha. Mangrove occupy only 0.5% of the global coastal area, but they contibute 10 – 15% (24 TgC.y-1) with While estimate of mangrove deforestation potential carbon losses to dforestation by 90-970 TgC.y-1 [31]. generates emmisions of 0.02 – 0.12 Pg carbon per year or about 10% of global deforestation or about 0.7% in ropical area [32-34] . Mangrove carbon algorithm with Quickbird satellite data at Kemujan island and Demak Coast. [32,33,34, 4] stated that the peak vegetation chlorophyll absorption was at the wave length of 600 – 700 nm, and less absorbtion at the wave length of 500-600 nm. Use of Quickbird satellite data of Band-2 (green band) wave length 520 – 600 nm and Band-3 (red band) wave length 630 – 690 nm. Highest corelation coefficient of Digital Number of Band2/Band3 band ratio of Quickbird satellite data with the field mangrove data Ceriops tagal have resulted algorithm Y = -0.003(B2/B3)2 + 0.267(B2/B3) – 3.452 with r = 0.806. Algorithm for Rhizopora apiculata Y= 0.001(B2/B3)2 - 0.116(B2/B3) + 3.415 with value r = 0.655 as in Fig 3. Algorithm using digital number of Band2/Band-3 of Quickbird satellite data with field mangrove carbon of Bruguiera cylindrica Y = -0.003(B2/B3)2 + 0.336(B2/B3) – 7.265 with r = 0.813. While algorithm for Xylocarpus granatum Y = 0.000(B2/B3)2 0.058(B2/B3) + 2.101 with r = 0.791 and algorithm for Rhizophora mucronata Y = 0.0001(B2/B3)2 - 0.022(B2/B3) + 1.941 with r = 0.866. Algorithm of mangrove carbon biomass at Demak using B-1 and Band-2 of ALOSAVNIR satellite data for Avicennia marina was Y = - 79.18 ((B1-B2)/(B1+B2))2 + 31.35 ((B1-B2)/(B1+B2)) 1.191 as in Fig 4.
43
44
Agus Hartoko et al. / Procedia Environmental Sciences 23 (2015) 39 – 47
Figure 3. Spatial distribution of Ceriops tagal (left) and Rhizopora apiculata (right) at Kemujan island Karimunjawa islands
Figure 4. Spatial distribution of Bruguiera cylindrica (left), Xylocarpus granatum (right) and Rhizopora mucronata (below-left) at Kemujan island - Karimunjawa islands and Avicnnia marina at Demak coastal area (below – right).
45
Agus Hartoko et al. / Procedia Environmental Sciences 23 (2015) 39 – 47
Conclusion The research concluded that band rationing of Band-2 with Band-3 for Quickbird and GeoEye data and Band-1 with Band-2 for ALOS data as the spectral signature of mangrove chlorophyll pigment with wave length of 0.5 - 0.6 μm as the best for mangrove carbon algorithms. Acknowledgement The authors would like to thanks to Staff of Balai Taman Nasional Karimunjawa, at Parang and Kemujan island and Fisheries and Marine Office of Demak for their sincere help and assistance during field survey and measurements. A sincere thanks also to JAXA and LAPAN for the ALOS_AVNIR and GeoEye also to Waindo_SpecTerra for QuickBird satellite data grant. REFERENCES [1]CIFOR (Center for International Forestry Research). 2009. CIFOR Guides for Forestry, Climate Change and REDD. Bogor [2]Watson R.T, I.R. Noble, B. Bolin, N. H. Ravindranath, D. J. Verado and D. J. Dokken(eds.). 2000. Land Use and Land-Use Change and Forestry: A special report of the IPCC. Cambridge, UK. Cambridge University Press. 377 pp. [3]Houghton, J. T., Y. Ding, D. J. Griggs, and M. Nouger. 2001. Climate Change: The Scientific Basis. Cambridge University Press. 83 pp. [4]Hartoko,A; I.Susilowati; TW Agustini, J.Hutabarat. 2010. ADAPTATION STRATEGY TOWARDS CLIMATE CHANGE FOR THE VULNERABLE FISHERIES OF INDONESIA. Convention on Biological Diversity. Technical Series No.51. UNITED NATIONS ON ENVIRONMENT PROGRAMS (UNEP). 10 – 21 May 2010. Nairobi. Kenya [5]Pandiwijaya, A. 2011. Pendugaan Perubahan Cadangan Karbon di Taman Nasional Gunung Merapi. Institut Pertanian Bogor. Bogor. [6]Jennerjahn, T.C., and V. Ittekkot. 2002. Relevance of Mangroves for The Production and Deposition of Organic Matter along Tropical Continental Margins. Naturwissenschaften 89, 23-30. [7]Johnson C.M. I.C.G. Vieira, D. J. Zarin, J. Frizano, and A. H. Jonshon. 2001. Carbon and Nutrient Storage in Primary and Secondary Forest in Eatern Amazonia. For Ecol. & Manage. 147 : 245-252. [8]Firman, A.2009. Mangrove and Climate Change. Fac of Fisheries and Marine Science, Universitas Padjadjaran. http://fpik.unpad.ac.id/archives/12. /25 October 2009. [9]Claridge, D. and J. Burnett. 1993. Mangrove in Focus. Wet paper Marine Education, Ashmore. [10]Duarte, C.M., J.J. Middelburg, and N. Caraco. 2005. Major Role of Marine Vegetation on The Oceanic Carbon Cycle. Biogeosciences 2, 1-8. [11]Dharmawan, I. W. S. and C. A. Siregar. 2008. Evaluation Technique for Mangrove Forest Carbon Rhizophora mucronata. Centre for Forestry and Natural Conservation. Bogor. [12]BTNKJ (Karimunjawa Conservation Agency). 2009. Socio Economic Survey of Natural Conservation-Ministry of Forestry. Semarang.
Karimunjawa. Dir-Gen
46
Agus Hartoko et al. / Procedia Environmental Sciences 23 (2015) 39 – 47
[13] BTNKJ (Karimunjawa Conservation Agency). 2012. Zonation of Conservation-Ministry of Forestry. Semarang.
Karimunjawa. Dir-Gen Natural
[14]Jamili, D. Setiadi, I. Qayim, E. Guhardja. 2009. Mangrove Structure and Composition at Kaledupa IslandWakatobi Island, Southeast Sulawesi. Bogor Agricultutre Institute (Struktur dan Komposisi Mangrove di Pulau Kaledupa Taman Nasional Wakatobi, Sulawesi Tenggara. Institut Pertanian Bogor). [15]Hairiah, K. and S. Rahayu. 2007. Carbon Measurement in Some Landuse at Bogor (Pengukuran Karbon Tersimpan di Berbagai Macam Penggunaan Lahan. Bogor. World Agroforestry Centre ICRAF, SEA Regional Office, University of Brawijaya, Unibraw, Indonesia 77p). [16]Sutaryo, D. 2009. Biomass Measurement : Introduction for Carbon Trade (Perhitungan Biomassa : Sebuah Pengantar untuk Studi Karbon dan Perdagangan Karbon). Wetlands International Indonesia Programme. Bogor. [17]Alongi, D.M., A. Sasekumar, V.C. Chong, J. Pfitzner, L.A. Trott, F. Tirendi, P. Dixon, and G.J. Brunskill. 2004. Sediment Accumulation and Organic Material Flux in a Managed Mangrove Ecosystem: Estimates of LandOcean-Atmosphere Exchange in Peninsular Malaysia. Mar. Geol. 208, 383-402. [18]Murdiyarso, D., U. Rosalina, K. Hairiah, L. Muslihat, I.N.N Suryadiputra and A. Jaya. 2004. Field Guide : Estimation of Carbon of PeatLand (Petunjuk Lapangan : Pendugaan Cadangan Karbon Pada Lahan Gambut). Wetlands International – Indonesia Programe. Bogor. [19]Amira, S. 2008. Biomass Estimation of Rhizophora apiculata at Batu Ampar Kubu Raya Regency, West Borneo (Pendugaan Biomassa Jenis Rhizophora apiculata. di Hutan Mangrove Batu Ampar Kabupaten Kubu Raya, Kalimantan Barat). Fac of Forestry. Bogor Agriculture Institute. [20]Arhatin, R.E. 2007. Vegetation Index Estimation and Mangrove Classification Using Landsat-5 and Landsat-7 : Case Study at Berau Regency-East Borneo (Pengkajian Algoritma Indeks Vegetasi dan Metode Klasifikasi Mangrove dari Data Satelit Landsat-5 dan Landsat-7 ETM+ : Studi Kasus di Kabupaten Berau, Kaltim). Thesis. Postgraduate Program IPB. Bogor. [21]Hartoko. 2010. Application of Remote Sensing and GIS for Coastal Resources Management-Master Programme Coastal Resources Management (APLIKASI INDERAJA & SIG UNTUK PENGELOLAAN SUMBERDAYA WILAYAH PANTAI. Program Magister Manajemen Sumberdaya Pantai).UNDIP [22]Nurgayah, W. 2011. Composition and Comunity Structure of Mangrove Ichtyofauna at Lentea Island – Wakatobi Regency Southeast Sulawesi (Komposisi dan Struktur Komunitas Iktiofauna di Perairan Mangrove Pulau Lentea Kecamatan Kaledupa Selatan Kabupaten Wakatobi Sulawesi Tenggara). Universitas Haluoleo. Kendari. [23]Bismark, M., E. Subiandono, and N.M. Heriyanto. 2008. Biodiversity and Mangrove Carbon at Subelen Siberut – West Sumatra. Research and Development of Forestry and Natural Conservation (Keragaman dan Potensi Jenis serta Kandungan Karbon Hutan Mangrove di Sungai Subelen Siberut, Sumatera Barat. Pusat Litbang Hutan dan Konservasi Alam). Bogor. [24]Santoso, N., and H.W. Arifin. 1998. Mangrove Rehabilitation of Green Belt in Indonesia Research and Development of Mangrove (Rehabilitas Hutan Mangrove Pada Jalur Hijau Di Indonesia. Lembaga Pengkajian dan Pengembangan Mangrove).Jakarta, Indonesia. [25]Sukardjo, S. 1994. Soils in the Mangrove Forests of the Nature Reserve, Tanah Grogot, East Kalimantan, Indonesia. Southeast Asian Studies 32 (3) : 385-398. [26]Suryawan, F. 2007. Biodiversity of Mangrove After Tsunami of the East Coast of Aceh (Keanekaragaman
Agus Hartoko et al. / Procedia Environmental Sciences 23 (2015) 39 – 47
Vegetasi Mangrove Pasca Tsunami di Kawasan Pesisir Pantai Timur Nangroe Aceh Darussalam). Unsyiah.Banda Aceh [27]Kusmana, C. 2002. Sustainable Mangrove Management and Society Based. Seminar of National Mangrove Management (Pengelolaan Ekosistem Mangrove secara Berkelanjutan dan Berbasis Masyarakat. Jakarta: Lokakarya Nasional Pengelolaan Ekosistem Mangrove). [28]Pambudi, G. P. 2011. Biomass Estimation of Several Mangrove Class at PT. Bina Ovivipari Semesta Kubu Raya Regency West Borneo (Pendugaan Biomassa Beberapa Kelas Umur Tanaman Jenis Rhizophora apiculata BI. Pada Areal PT. Bina Ovivipari Semesta Kabupaten Kubu Raya, Kalimantan Barat). Institut Pertanian Bogor. Bogor. [29]Alongi D.M (2014). Carbon Cycling and Storage in Mangrove Forests. Annual Review of Marine Science. Vol.6: 195-219 [30]Donato D.C, J Boone Kauffmann, Daniel Murdiyarso, Sofyan Kurnianto, Melanie Stidham, Markku Kannien. 2011. Mangrove Among the Most Carbon-Rich Forests in the Tropics. Nature Geoscience. 4: 293-297 [31]Gobel, R. 2006. General Microbiology (Mikrobiologi Umum). Universitas Hasanuddin. Makassar. [32]Wijaya,S.W. 2005. Application of Remote Sensing and Quickbird for Mangrove Mapping at Karimunjawa Islands Jepara Regency Central Java (Aplikasi Penginderaan Jauh dengan Citra Satelit Quickbird untuk Pemetaan Mangrove di Pulau Karimunjawa, Kabupaten Jepara, Jawa Tengah). Institut Pertanian Bogor. [33]Frananda, H. 2011. Integration of Remote Sensing and GIS for Mangrove Carbon Stock at Segoroanak at Alas Purwo National Consrvation Banyuwangi East Java (Integrasi Penginderaan Jauh dan Sistem Informasi Geografis untuk Estimasi Stok Karbon Hutan Mangrove Kawasan Segoroanak di Kawasan Taman Nasional Alas Purwo Banyuwangi, Jawa Timur -Tesis). Program Pascasarjana, Universitas Gadjah Mada. Yogyakarta. [34]Ariyanto, D.2011. Application of Remote Sensing for Mangrove Carbon and Fish Abundance at Bedono Coast Demak Regency (Aplikasi Penginderaan Jarak Jauh untuk Analisis Hubungan Biomassa Karbon Hutan Mangrove dengan Kelimpahan Ikan di Desa Bedono Demak – Tesis). Postgraduate Program, Universitas Diponegoro. Semarang
47