Challenges and Experience in Prototyping a Multi-Modal Stream Analytic and Monitoring Application on System S ˘ Philip S. Yu Bugra Gedik
[email protected] [email protected] Charu C. Aggarwal Eric Bouillet
[email protected] [email protected] Wei Fan David A. George Xiaohui Gu
[email protected] [email protected] [email protected] Gang Luo Haixun Wang
[email protected] [email protected]
Kun-Lung Wu
[email protected] Kirsten W. Hildrum
[email protected]
IBM T. J. Watson Research Center, 19 Skyline Drive, Hawthorne, NY 10532
ABSTRACT In this paper, we describe the challenges of prototyping a reference application on System S, a distributed stream processing middleware under development at IBM Research. With a large number of stream PEs (Processing Elements) implementing various stream analytic algorithms, running on a large-scale, distributed cluster of nodes, and collaboratively digesting several multi-modal source streams with vastly differing rates, prototyping a reference application on System S faces many challenges. Specifically, we focus on our experience in prototyping DAC (Disaster Assistance Claim monitoring), a reference application dealing with multi-modal stream analytic and monitoring. We describe three critical challenges: (1) How do we generate correlated, multi-modal source streams for DAC? (2) How do we design and implement a comprehensive stream application, like DAC, from many divergent stream analytic PEs? (3) How do we deploy DAC in light of source streams with extremely different rates? We report our experience in addressing these challenges, including modeling a disaster claim processing center to generate correlated source streams, constructing the PE flow graph, utilizing programming supports from System S, adopting parallelism, and exploiting resource-adaptive computation.
1. INTRODUCTION Today, myriads of electronic devices, ranging from simple sensors to sophisticated computers, are network-connected. As a result, numerous continuous digital data are available
Permission to copy without fee all or part of this material is granted provided that the copies are not made or distributed for direct commercial advantage, the VLDB copyright notice and the title of the publication and its date appear, and notice is given that copying is by permission of the Very Large Data Base Endowment. To copy otherwise, or to republish, to post on servers or to redistribute to lists, requires a fee and/or special permission from the publisher, ACM. VLDB ‘07, September 23-28, 2007, Vienna, Austria. Copyright 2007 VLDB Endowment, ACM 978-1-59593-649-3/07/09.
for analysis in the form of data streams, e.g., news feeds, transaction records, digital audio, video and image data, chat messages, network packets, Web logs and sensor readings. Many stream-based applications are being actively developed for various purposes, such as filtering, clustering, aggregation, correlation and monitoring. System S is a distributed stream processing middleware designed to support stream-based applications with large configurations [18], i.e., applications that utilize many different stream analytic algorithms working cooperatively to process numerous source streams. It has been under development since 2003 at the IBM T. J. Watson Research Center. System S has many unique features, including dynamic application composition, stream discovery, and reuse across applications [18]. On System S, stream analytic algorithms are implemented as Processing Elements (PEs). A PE receives incoming stream data objects (SDOs) from its input ports, processes them with its analytic algorithm, and perhaps generates new SDOs and sends them to other downstream PEs via its output ports. A stream application running on System S is essentially a stream-connected PE graph. System S supplies the necessary middleware components to provide the services that run stream applications. DAC (Disaster Assistance Claim monitoring) is a multimodal stream analytic and monitoring application designed as a reference application on System S. It is prototyped partly to validate System S and partly to showcase the successful integration of various stream analytic algorithms into a comprehensive stream application. Inspired by the observation that various kinds of frauds seem to have always been committed against any disaster assistance program, DAC aims to identify, in real time before money is dispensed, (a) the processed claims that are fraudulent or unfairly treated and (b) the problematic agents and their accomplices engaged in illegal activities. To create input streams for DAC, we model a disaster assistance claim processing center, where agents handle claims by taking phone calls from applicants. We synthetically generate several source streams that reflect different aspects of the agents’ activities, including processed claims, VoIP data
from the conversations between agents and applicants, email log of the agents, video surveillance data from the processing center, and selective news feeds. These streams are interrelated and multi-modal, including data records, audio, video and ASCII text, and they have vastly divergent data rates. For example, for each processed claim, there are one or more phone conversations, each conversation further comprising of about 100 VoIP conversation segments. Hence, the data rate of the VoIP stream, in terms of SDOs per second, can be as many as 100 times that of the processed-claim stream, creating vast mismatches in stream processing demands among different PEs. There are many challenges in prototyping DAC, including individual PE programming, job-level composition, workload generation, and PE deployment over a cluster of machines. In this paper, we focus on three most critical ones: (1) How do we create correlated, multi-modal source streams for DAC? (2) On the programming level, how do we design and implement a comprehensive, stream-based analytic and mining application on System S from many divergent PEs? (3) On the operational level, how do we deploy numerous PEs in DAC, each with a different ingestion rate and computation requirement, so that they can properly handle and correlate multi-modal streams with extremely different rates? We report our experience in addressing these challenges, including modeling a disaster claim processing center, designing and implementing the PE flow graph of DAC, using PE programming supports from System S, exploiting parallelism and adopting resource-adaptive computation. We also show a few snapshots of a DAC demo run, employing 51 PEs running on 35 nodes. To the best of our knowledge, DAC represents a first-ofa-kind, stream-based analytic and mining application employing a large number of PEs. We don’t use any training or labeled data in DAC; the analytic and mining algorithms are self-learning in nature. With parallelism and resource-adaptive computation, DAC successfully handles mismatches in stream processing load among the PEs. Additional synergism and cooperation among the PEs are realized via inter-PE feedback and progressive filtering. The focus of this paper is on addressing the three challenges, not the investigative story of DAC, which is somewhat concocted. The source data are synthetically generated. Nevertheless, the challenges are real problems that future designers would also face in their development of largescale stream applications. Because stream-based processing and application development is still an emerging area, we believe that our experience so far is important and will be beneficial to future developers of sizable stream applications. The rest of the paper is organized as follows. Section 2 describes related work. Section 3 provides an overview of System S. The three key challenges of prototyping DAC on System S are described in Section 4. Section 5 details our experience in addressing these challenges, including generating workload for DAC, designing and implementing DAC and deploying DAC. Section 6 shows a few snapshots of a DAC demo run. Section 7 describes important lessons learned. Section 8 discusses ongoing and future work. Finally, Section 9 summarizes the paper.
Streambase [22] and STREAM [5], significant differences exist between System S and these systems, especially in its goal and architecture [18]. The goal of System S has been to support distributed stream analytic and mining applications with large configurations, such as applications comprised of hundreds or thousands of PEs working cooperatively on numerous source streams. We envision numerous stream-based applications concurrently running on System S in a distributed clustered system consisting of up to tens of thousands of nodes. In order to achieve this goal, System S has a set of architectural components to provide several unique features, such as dynamic stream application composition, automatic stream discovery for PEs, and reuse of existing PE graphs across different applications. There is a large body of research in various stream algorithms. Numerous such papers have appeared in the major data management conferences, such as VLDB, ACM SIGMOD and IEEE ICDE. However, they tend to be specific stream algorithms, such as stream classifiers, stream mining algorithms, stream-based clustering algorithms, or windowed stream joins. In this paper, instead of describing the specific stream algorithms used in DAC, we concentrate on the challenges of integrating various stream analytic PEs into a reference application on System S. DAC implements several stream-based analytic algorithms, whose details have been described in separate publications. These stream algorithms include a micro clustering algorithm for identifying fraudulent claims [2, 3], a stream algorithm using ensemble-based random decision trees for classifying unfairly processed claims [8, 9], a focused community algorithm to discover communities focused on a watch list of problematic agents [15], a load shedding algorithm for classifying VoIP stream data [7], an adaptive load shedding approach to windowed stream joins to correlate problematic agents with fraudulent or unfairly treated claims [10, 11], a stream indexing scheme for windowed top-K queries [20], a query indexing method for alert generation [23], a resourceadaptive stream algorithm for detecting new events from news feeds [19] and a load spreading technique for stream joins among video streams [13, 12, 14]. This paper will not delve into the details of these algorithms. Instead, it will provide an overview of their functions as PEs for DAC.
3.
OVERVIEW OF SYSTEM S
We briefly describe some key components of System S. Readers are referred to [18] for more details. At its core, System S is a distributed stream processing middleware, whose components provide efficient services to enable the simultaneous executions of multiple stream processing applications on a large cluster of machines. A prototype of System S has been fully functional and stress-tested by various applications, including DAC, on a large Linux cluster consisting of about 100 nodes interconnected by a Gigabit switched Ethernet network. Fig. 1 shows the key architectural components of System S, including
2. RELATED WORK
• Dataflow Graph Manager (DGM): It determines stream connections among PEs, and matches stream descriptions of output ports with the flow specifications of input ports.
Even though there exist several stream processing systems, such as Aurora [24], Borealis [1], TelegraphCQ [6, 21],
• Data Fabric (DF): This is the distributed data transport component, comprising a set of daemons, one on
SAN
Resource Manager (RM)
Dataflow Graph Manager (DGM)
data types are defined in a single XML file, shared by all the PEs and the System S runtime.
4. PE
PEC
PE
PE
Data Fabric Server (DF)
Storage subsystem
PEC
PE
Data Fabric Server (DF)
LAN
Figure 1: Key components of System S that provide services to run stream applications [18]. each node supporting the system. It establishes the transport connections between PEs and moves SDOs from producer PEs to consumer PEs. • Resource Manager (RM): It determines the placement of PEs. It also makes global resource decisions for PEs and streams, based on runtime statistics collected from the DF daemons and the PE Execution Containers. • PE Execution Container (PEC): It provides a runtime context and access to the System S middleware. It acts as a security barrier, preventing the user-written PE code from corrupting the System S middleware and other PEs. Each application, or job, is expressed in terms of a data flow graph, consisting of PEs that consume and produce data streams through their input and output ports, respectively. The data flow graph is defined in a job configuration file, and it specifies how different PEs are to be connected via flow specifications. Each PE processes stream data objects (SDOs) that it receives, and possibly filters or transforms them and then publishes them. Associated with each PE is a PE descriptor, called a PE template. Defined in a PE template are the SDO data types allowed in the PE’s input and output ports. System S supports a model where stream connections are created between input and output ports based on a publish-subscribe model. Namely, each PE specifies the streams that it produces on its output port in the PE template, and declares the characteristics of the streams that it is interested in consuming on the flow specifications in the job configuration file. System S dynamically determines the PE connections at runtime by matching SDO data types with flow specifications. This allows PEs to discover new streams that match their flow specifications whenever such new streams become available, allowing an application designer to avoid hard-wiring PE connections, tremendously increasing design flexibilities. System S adopts a global data type system following the framework of UIMA [16], which stands for Unstructured Information Management Architecture. Developed by IBM and made open source, UIMA is an open, industrial-strength, scalable and extensible platform for creating, integrating and deploying unstructured information management solutions. In System S, all the SDO
CHALLENGES OF PROTOTYPING DAC
As a reference application on System S, DAC must meet multiple objectives. First, DAC must be able to stress-test System S and showcase the important features of System S, such as dynamic application composition and stream discovery. Second, DAC must demonstrate the successful integration of various individual stream analytic algorithms into a comprehensive stream application, ingesting several multi-modal source streams and running on a large cluster of machines. To meet these objectives, we face many challenges. Here, we focus three major ones. • C1: Workload generation for DAC: To fully test DAC, we need workloads that can be flexibly adjusted to exhibit different characteristics. For this reason, DAC uses a workload generator (WLG) to synthetically generate several multi-modal data streams by modeling a disaster claim processing center. The data values of the SDOs in each stream can follow an individual distribution. However, in order to create correlated data streams, the data values of the SDOs in different streams must also follow certain conditional distribution. How do we model a claim processing center, define the SDO data types and data distributions for individual streams, specify and implement correlated distributions across different streams? These are all difficult challenges for the WLG for DAC. • C2: Design and Implementation of DAC: DAC aims to identify, in real time for further management review before the assistance money is dispensed, the fraudulent or unfairly processed claims and the problematic agents, together with their accomplices, engaged in illegal activities. To achieve these goals, individual PEs using specific stream analytic algorithms must be developed to first detect fraudulent claims, unfairly processed claims and problematic agents, respectively. The output streams from these PEs are then correlated to further filter out cases with lower degrees of confidence. After correlations, the identified cases are then used to help find communities centered around the agents who processed these cases. The identified cases are also used to generate alerts and identify top-K cases that maximize linearly weighted functions. Besides developing individual PEs, it is a big challenge to integrate so many different PEs into a comprehensive stream application. The finished DAC is a complex graph with a sophisticated job configuration. It is difficult to construct such a complex stream application all at once. How do we effectively utilize System S supports in PE programming to make the design and implementation of DAC possible? How do we achieve as much synergism and cooperation as possible among the different PEs? • C3: Deployment of DAC: Due to the need for correlations between various streams, the use of multimodal source streams with vastly divergent rates poses a particular challenge to the deployment of DAC. To address this challenge, parallelism certainly can help. For example, a heavy stream, like VoIP, can be spread
Generate a claimApp SDO
Generate coversationSegment SDOs
5. EXPERIENCE IN PROTOTYPING DAC In this section, we describe our experience in overcoming these three key challenges in prototyping DAC. To make our exposition easier, we first focus on a less-complicated version of DAC, which uses three source streams: the processedclaim stream, the VoIP stream and the e-mail-log stream. This simplified DAC is nevertheless sufficient to illustrate all the challenges in our prototyping of DAC. In section 6, we will show snapshots of a demo with a more-complicated version of DAC, which ingests two additional source streams, including a video stream and a news feed stream.
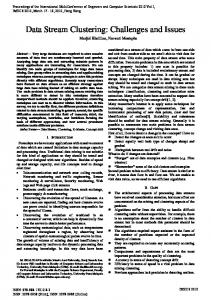
5.1 Generating workload for DAC SWORD is a scalable and flexible workload generator developed for distributed data processing systems [4]. It has been used as a basis to implement the WLGs for various stream applications running on System S, including DAC. SWORD is built on the Agent Building and Learning Environment (ABLE) platform, a Java IDE for the development and runtime deployment of distributed multi-agent systems developed at IBM (see http://ableinfo.userv.ibm.com for further information about ABLE). In order to use SWORD to implement the WLG for DAC, we first need to do the following: (a) define the states and transition actions of a Petri-Net that models a disaster claim processing center, (b) specify the content model for the distributions of data values in the SDOs of various streams and (c) implement the code for the transition actions to generate the correlated streams based on the content model. We model several activities of the agents in a disaster claim processing center. Fig. 2 shows the Petri-Net state transitions of the workload model for the simplified DAC. In this Petri-Net model, each token represents an agent in the processing center. An agent processes claims by taking phone calls from applicants. During the processing, the agent might also receive (send) certain e-mails from (to) his/her colleagues or some applicants. Three different source streams are to be generated: a processed-claim-application stream, with the SDO data type of claimApp; a VoIP stream, with the SDO data type of conversationSegment; an e-mail log stream, with the SDO data type of emailLog. Each token can be in one of three states: • S1 is the state where a token is when the agent is waiting for a new claim case. • S2 is the state where a token is when the agent is processing a claim case. • S3 is the state where a token is when the agent completes either a phone conversation or e-mail. When an action occurs, a token makes a state transition. There are four different actions:
A3: Agent engaging in email activities
S2: Agents are processing Applications
S3: Agents complete an activity (phone/ email)
A4: Agent finishes a case; Clear agent state
A2: Agent and applicant VOIP
S1: Agents wait for DAC cases
A1: Receiving cases
over multiple PEs. However, it could be difficult sometimes, if not impossible, to partition a stream among parallel PEs due to the nature of the steam or the PE semantics. Even if parallel PEs can be used, the mismatch in processing load among PEs can still be too large. In this case, resource-adaptive computation, or load shedding, must be employed. How do we effectively use parallelism as well as load shedding to properly handle the big mismatches in processing demands across different streams?
Generate emailLog SDOs
Each token is a claim processing agent in a disaster claim processing center.
Figure 2: The state transitions of the DAC workload model. • A1: An agent receives a claim case. When this happens, the token moves from S1 to S2. • A2: An agent engages in a VoIP phone conversation with an applicant. When this occurs, the token moves from S2 to S3 or S2, if there are more conversation segments for the conversation session. • A3: An agent engages in e-mail activities. When this occurs, the token moves from S2 to S3. • A4: An agent finishes a case. When this occurs, the token moves from S3 to S1 or S2, if there are more conversations or e-mails for the claim case. A claimApp SDO is generated when a token transits from S3 back to S1, i.e., an agent finishes processing a claim application. Its attributes contain information about both the applicant and the application. Applicant information include applicantID, name, address, age, gender, educationLevel, race, income, etc. Application information include caseID, processorID, approvalStatus, amountClaimed, amountGranted, etc. Some of these attribute values will be used to identify fraudulent claims and unfairly treated claims. A conversationSegment SDO is generated when a token transits from S2 to S3, or back to S2. Its attributes contain information about a processed conversation segment after voice-to-text translation, including caseID, processorID, conversationID, segmentID, keyWords, etc. We assume that each VoIP conversation segment is represented by a few keywords, which can be obtained via a voice-to-text translation. However, we did not implement such a voice-to-text translation PE in DAC. The keywords will be used to identify problematic processors. Several emailLog SDOs are generated when a token transits from S2 to S3. Each contains only a pair of attributes: from and to. Because only emails that are sent either from or to the processing center can be logged, at least one attribute must be an agent. These e-mail pairs will be used to build communities focused around a watch list of people. Since these communities are focused on a particular agent or set of agents, we call them “focused communities”. We assume that there is no correlation between fraudulent claims and unfairly treated claims. However, there are corre-
5.2 Designing and implementing DAC Besides individual PE programming, the construction of a stream application on System S requires the specification of a PE flow graph. This PE flow graph defines how various PE instances will be connected among themselves and, optionally, which node group a PE instance can be placed. The PE flow graph of DAC also tells the investigative story of how the fraudulent claims, unfairly treated claims and problematic agents are to be identified using various source streams. Here, we focus only on how we implement the PE flow graph of DAC, skipping the details about individual PE programming, which tend to be more mechanical, except for the analytic algorithm, once a designer is familiar with the programming model.
5.2.1
PE flow graph of DAC
Fig. 3 shows a functional PE flow graph of the simplified DAC, where each type of PE has only one instance. In practice, as will be shown in Section 6, multiple instances of the same PE type are usually used in a job. Each PE is depicted with one or more input ports, and one or more output ports. SDO data types are labeled above the directed edge connecting the output port and input port of two different PEs. Three source PEs are first used to receive the data records generated by the WLG, including claimApp, conversationSegment and emailLog. The source PEs wrap these records into proper SDOs based on the specified types for the three source streams. In the simplified DAC, there are seven analytic PEs, each implementing a separate stream algorithm. They include a Micro Cluster (MC) PE, a Random Decision Tree (DRT) PE, a Focused Community (FC) PE, a LoadStar (LS) PE, a GrubJoin (GJ) PE, a top-K PE and a CES PE for alert generation. Now, we will present a functional overview of these PEs. Detailed algorithms of these PEs can be found in the references provided in the related work in Section 2. To identify fraudulent claims, the Micro Cluster PE reads an input SDO from the claimApp stream and adds a suspicionLevel, representing how likely this application is fraudulent, to generate a suspiciousApp output SDO. Functionally, the Micro Cluster PE is an annotator. For each input SDO, it computes the level of suspicion, between 0 and 1, and annotates it to produce an output SDO. To compute the suspicion level, it examines an applicant’s family size, edu-
unfairProbApp
suspiciousApp
claimApp
S1
top-k
MC
Top-K
GJ
Micro Cluster PE
Source PE
Top-K PE Grub Join PE
unfairApp RDT Random Decision Tree PE
suspiciousProbApp
alert
unfairProbApp
CES
community emailLog
Source PE
FC
Focused Community PE
conversationSegment S3 Source PE
CES PE for Alert Generation
ProblematicProc
S2
processor
lations between problematic agents (processors) and fraudulent claims, and between problematic agents and unfairly treated claims. These correlations are specified as conditional probabilities and the attribute values are generated accordingly. The emailLog SDOs are also generated with correlation in mind, aiming to generate more e-mail pairs involving agents in a criminal group participating in fraudulent or unfairly processed claims. The ranges of attribute values, as well as their distributions and conditional probabilities, are all described in a content description file, which is then loaded by SWORD to generate SDOs whose attribute values are properly correlated. Finally, the WLG for DAC also generates the ground truth SDOs for the processed claims, agents and the criminal group. However, analytic PEs of DAC do not read the ground truth SDOs. These ground truth SDOs are only read by the sink PEs, when they are preparing performance statistics about the analytic PEs to be displayed on a GUI.
LS LoadStar PE
Figure 3: The PE flow graph for a simplified DAC with three source streams. cation level, income and the amount claimed in the application. In our implementation, the Micro Cluster PE does not filter out any input SDO, leaving the decision to the downstream PE. In this case, the threshold of suspicion level to decide whether or not a claim is fraudulent is determined by the GrubJoin PE. The same claimApp source stream is also read by the Random Decision Tree PE. This RDT PE examines the applicant’s age, race, gender, nationality, marital status and approval status. Similar to the Micro Cluster PE, it computes the level of unfairness, between 0 and 1, and annotates it to the input SDO to produce an output SDO with a data type of unfairApp, which is claimApp plus an additional attribute of unfairnessLevel. Similar to the Micro Cluster PE, the RDT PE does not filter out any input SDO, leaving the decision also to the downstream PE, the GrubJoin PE. To determine that an agent is problematic, the LoadStar PE reads the VoIP stream containing SDOs with the data type of converstationSegment. It examines the keywords contained in each segment of the conversation between an agent and an applicant. The LoadStar PE computes a problematic measure based on the keywords that it has seen so far. If enough of a predefined set of keywords have been observed, it makes a decision to label an agent as problematic. After a decision is made, it performs load shedding by dropping SDOs from the same conversation. The LoadStar PE generates output SDOs of the type problematicProc, representing problematic processors.1 We adopt a stringent criterion for flagging the cases for further management review. To be flagged, a case requires confirmation from two different channels: claimApp and conversationSegment. Hence, we use the GrubJoin PE to correlate the problematic agents with the suspicious claims and the unfairly treated claims, respectively. It implements two independent, two-way, windowed stream joins: one between problematic agents and suspicious claims, and the other between problematic agents and unfairly treated claims. Two different output streams are generated by the GrubJoin PE: suspiciousProbApp and unfairProbApp, representing suspicious claims handled by a problematic agent and unfairly treated claims handled by a problematic agent, respectively. These two streams can be immediately sent to management for review. However, to further reduce the number 1
We use “processor” and “agent” interchangeably.
of cases for review, the management is notified based on alert profiles and top-K cases of interest. Hence, the two output streams of the GrubJoin PE are further processed by the top-K PE and the CES PE. The Focused Community PE uses the two output streams from the GrubJoin PE to first generate watch list messages. The agents or applicants in the watch list are sent to the Focused Community PE to be used as community centers. The emailLog SDOs are used to build communities around these community centers. These focused communities represent either the criminal groups that engaged in illegal activities, or just groups of friends who corresponded. If, however, an applicant is found to be in the same community as the agent processing that applicant’s request, this is deemed suspicious, and the processing agent is sent to the RDT PE and the LoadStar PE for special attention in their respective classifications. The top-K PE reads the unfairProbApp SDOs and extracts the unfairness level and the amount granted to build an approximate stream index, which uses a small amount of memory to efficiently keep track of the most “important” SDOs in a sliding window of the unfairProbApp stream. The stream index maintenance cost is small because the great majority of the incoming SDOs do not cause any changes to the index and are quickly discarded. This stream index is used to find approximately the top-K SDOs that maximize a few linearly weighted functions. Finally, the CES PE reads from the two output ports of the GrubJoin PE. Namely, it reads both unfairProbApp and suspiciousProbApp SDOs. It extracts from these SDOs the amount granted and the unfairness level or the suspicion level. The CES PE builds a query index, where a query is represented by a conjunction of two range predicates on the amount granted and the unfairness/suspicion level. These queries represent the alert conditions that are set up in advance to monitor the claim processing center. Proper alerts will be raised whenever an SDO that falls into the ranges of those queries is received by the CES PE. Thousands of such range queries are loaded by the CES PE initially to construct a query index. Upon receiving an input SDO, the CES PE uses the query index to rapidly identify all the queries that cover the SDO and raise the alerts associated with these identified queries.
additional PE to the existing PE flow graph. With this extensible composition, we were able to successfully integrate 51 PEs into a rather complex DAC (see Fig. 5). It would have been impossible to debug if these 51 PEs were to be specified all at once in a job configuration file.
5.2.3
5.3 5.2.2
Extensible application composition
In general, the PE flow graph of a stream application can be rather complex, making it difficult to specify correctly all at once. Mistakes can be rather difficult to debug and fix. Fortunately, System S allows a complex stream application to be incrementally extended by adding a simpler subgraph to an existing, more complex graph. It dynamically determines the stream connections among the PEs at runtime by matching stream descriptors with PE flow specifications. This allows PEs to immediately recognize new streams that match their flow specifications when the new streams are available. This is a unique and powerful support by System S, and proved to be very useful in our development of DAC, even for the simplified one. In the course of our development, individual PEs are designed and implemented separately by different designers. Each PE is first independently tested, using a simple PE flow graph connecting the PE with a test source PE and a sink PE. Then, we integrate them by adding each time an
Inter-PE feedback and progressive filtering
To further enhance synergism among the PEs in DAC, we employed several inter-PE feedbacks. Namely, the output SDOs of a downstream PE are sent back to and consumed by an upstream PE. In general, inter-PE feedbacks have significant benefits, such as reduction in stream processing demands and improvement in quality of solutions. For example, in Fig. 3, two kinds of output SDOs, suspiciousProbApp and unfairProbApp, generated by the downstream GrubJoin PE are sent back to the upstream Focused Community PE. These feedback SDOs help significantly lower the processing demands on the Focused Community PE by reducing the number of potential communities that need to be focused on. Moreover, the output SDOs of the Focused Community PE are in turn sent back to both the Micro Cluster PE and the LoadStar PE. In this case, the quality of solutions is increased by allowing the Micro Cluster PE and the LoadStar PE to pay special attention to those cases involving problematic persons from these feedbacks. A different form of synergism achieved among the PEs in DAC is progressive filtering. Data rates are the highest on the PEs that are closer to the sources, i.e., the left-hand side of a PE flow graph. These source streams are typically high-volume, low-level sensor data. As each stream goes through different PEs in successive stages, the rate is progressively reduced. Finally, on the right-hand side of a PE flow graph, high-level events are detected occasionally. For example, the high input data rate of the LoadStar PE in Fig. 3 is progressively filtered down to a low output rate at the top-K PE. This progressive filtering nature is true for most, if not all, of stream applications. For instance, in a stream application monitoring the complex production steps in a semiconductor manufacturing plant, a large number of rapid source streams, each comprising of high-volume sensor readings, can be progressively filtered down to a small number of infrequent, high-level alerts.
Deploying DAC
The use of multi-modal source streams—such as claim record, e-mail log and VoIP—creates significant challenges in the deployment of DAC. The vastly divergent stream rates result in huge mismatches in the processing demands among the PEs. For example, in Fig. 3, as the Micro Cluster PE and the RDT PE analyze a processed claim record, the Focused Community PE must process about 50 e-mail log records, and the LoadStar PE must process about 100 conversation segments, each containing about 30 or so keywords. Hence, the processing load ratio of MC:FC:LoadStar is roughly about 1:50:100, if we use the number of input SDOs as an estimate for the PE processing load. If not properly handled, the mismatch in processing load can render the entire DAC application infeasible, because the GrubJoin PE will not generate any result at all when one tuple expires before the tuples with which it is to be joined even arrive. In particular, the problematicProc stream cannot be joined with the suspiciousApp stream or the unfairApp stream by the GrubJoin PE because it takes 100 times more
time to process a conversation by the LoadStar PE than that to process a claim by the MC PE or the RDT PE. In this section, we describe our experience in addressing this challenge by using parallelism and resource-adaptive computation, i.e., load shedding. We use both parallelism and load shedding for the LoadStar PE to cut down more than 90% of its load on the conversationSegment stream. For the GrubJoin PE, we use a large join window size as well as adaptive load shedding to deal with the challenge. We encountered a similar problem with the Focused Community PE. However, PE replication does not reduce the processing load on the emailLog stream since every email must be examined for its relevance to every community. A decomposition of the Focused Community PE into a front-end FC and a back-end FC is needed to handle this problem.
5.3.1
Parallelism
Multiple PE instances, i.e., parallel PEs, can be used to receive and process a stream. In order to evenly spread a stream among the PE instances downstream, System S provides a very powerful support. It is a content-based flow specification to allow the SDOs from an output port of a PE to be spread among the input ports of many PE instances. For example, five LoadStar PE instances are used in the DAC demo shown in Fig. 5. The input flow spec of one of the LoadStar PE instances is specified as follows: fs0=[;mod(conversationSegment:caseID, 5, 2)] It tells the System S runtime to send only those conversation segment SDOs with caseID%5 =2. As such, the conversation segment SDOs are distributed in a round-robin fashion among the five LoadStar PE instances based on the caseID attribute value. There is no need to write a special PE to distribute a stream among multiple PEs. The distribution is automatically handled by the runtime of System S. The conversationSegment stream can be evenly spread among the LoadStar PEs. This is because the VoIP conversation segments can be grouped into different conversations, based on the caseID in each SDO, and each LoadStar PE can then be processing only the SDOs from the same conversation. However, depending on the nature of the stream and the semantic of the PE analytic, sometimes a stream cannot be spread among multiple PEs. In this case, a simple replication of PEs does not reduce the processing load on the stream. For instance, the emailLog stream cannot be easily spread among multiple Focused Community PEs. In the Focused Community PE, one community is maintained for each of a list of problematic agents or suspicious applicants to be watched [15]. Because an e-mail SDO can potentially be connected to any of the maintained communities, even if we partition the watch list among the multiple FC PEs, each FC PE still needs to receive all the e-mail SDOs. We can make use of the dynamic flow specification to reduce this number, but this made the flow-specification computation too costly and brought little increase in efficiency. Hence, the use of multiple FC PEs would not reduce the processing load on the emailLog stream. To address this problem, we decompose the Focused Community PE into a front-end FC PE and a back-end FC PE. Without delving too much into the FC algorithm [15], we provide an overview of the technique here. For a given community, the Focused Community algorithm keeps a list of
community members (called the core) as well as the community’s fringe, agents not in the community, but close to the community. For each of these agents it keeps two counters, one for the number of in-community connections, and a second for the outside-community connections. Periodically, it uses these counters to recompute both the community and the fringe as described in [15]. Informally, more in-community connections pull agents from the fringe into the community proper, while more outside-community connections pull agents from the community to the fringe. The original Focused Community PE did both counting of emails and the recomputation. The new approach divides these two tasks. A back-end FC PE supplies the relevant agent lists (core and the fringe) to the front-end FC PEs and periodically recomputes the communities. A front-end FC PE updates the counters for the agent lists supplied, and periodically pushes updates to the back-end FC PEs. Thus, many front-end PEs may serve a single back-end FC PE. The emailLog SDOs are spread among all the front-end FC PEs. This way the impact of any single e-mail SDO on any community will be accurately accounted for by one of the front-end FC PEs. Each front-end FC PE then periodically sends a summary of all the communities to all of the backend FC PEs. Each back-end FC PE accumulates statistics for only a subset of the watch list, effectively parallelizing the computation.
5.3.2
Resource-adaptive computation
Even if a stream is spread among multiple downstream PEs, the mismatch in processing load among PEs can still exist. For example, with five LoadStar PEs, the number of conversationSegment SDOs received by a LoadStar PE can still be 20 times that received by the Micro Cluster PE or the RDT PE. Furthermore, stream rates can be bursty as well. Parallelism in itself will not be effective to cope with bursty rates. Hence, besides parallelism, resource-adaptive computation, i.e., load shedding, is required in stream processing. We briefly describe two load shedding approaches adopted in DAC, one used by the LoadStar PE [7] and the other used by the GrubJoin PE [10, 11]. An agent is considered to be problematic if certain types of keywords found in a conversation have reached a predefined intensity level [7]. Once the intensity level is reached, we do not need to examine any more SDOs from the same conversation and LoadStar will drop the subsequent SDOs. System S provides a dynamic flow specification mechanism to allow a PE to drop SDOs dynamically. In addition, if the LoadStar PE is not yet certain about whether a conversation is problematic, it can still drop some conversation segment SDOs via sampling. Namely, it dynamically informs the System S runtime that only samples of the conversation segment SDOs should be delivered while others are dropped. In our DAC demo runs, over 90% of the SDOs from the conversationSegment stream are dropped by the LoadStar PE, and yet we maintain a false negative ratio at about 2-3%. In the GrubJoin PE, an incoming SDO from one of the streams is used to join with all the SDOs from another stream that are stored in a join window, i.e., join buffer. If input rates are too high, the windowed join operations may not be performed 100%, thus requiring load shedding [10, 11]. In GrubJoin, the join operations are performed selectively on the highest-valued regions of a join window to
maximize the join output rate. Periodically, a full-join operation is performed to sample and determine the relative usefulness of the regions of a join window. The experimental results in [11] show that GrubJoin is vastly superior to random tuple dropping. In the next section, we will further demostrate that GrubJoin is as good as the full join even if we shed almost 20% of the load.
6. SNAPSHOTS OF A DAC DEMO RUN DAC has been fully integrated with nine different types of stream analytic PEs and stress-tested on System S. It has been running robustly each time for over many days on System S. In this section, we show a few snapshots of a DAC demo run. Besides the seven types of PEs described in Section 5.2.1, in this demo run we also deployed two additional types of PEs: an On-line New Event Detector (ONED) PE and a Load Diffuser (LD) PE. The ONED PE reads ASCII news articles from several news feed streams and detects the first articles that mention previously unseen events [19]. It then searches for location names appeared in these articles. The location data are then used by the Micro Cluster PE to adjust its algorithm. In addition, it also measures the importance of each news source continuously. Such importance measure can be used for resource-adaptive computation. If load shedding is needed, news articles coming from the sources of less importance will not be processed. The Load Diffuser PE, together with several Join PEs and a Fusion PE, performs distributed, multi-way, windowed stream joins over annotated video streams taken from the claim processing center. These videos captured who is with whom in the processing center. We assumed that certain face recognition algorithm has been first used to recognize and annotate pairs of agents who appeared together on the same video frame. Given high video stream rates and large join windows, a stream join often has large resource requirements that exceed the capacity of a single node. To address this problem, the Load Diffuser PE [14, 12, 13] dynamically spreads the join workload among multiple nodes. Unlike other operators, a stream join presents new challenges for load diffusion. First, a stream join requires the diffusion scheme to observe a correlation constraint, that is, each SDO needs to join with the SDOs stored in the join windows of all the other streams. Second, the load diffusion scheme must also be adaptive to the dynamically changing stream environment. To overcome these challenges, the Load Diffuser PE employs a spectrum of semantics-preserving tuplerouting schemes, which (1) preserve the stream join accuracy while spreading tuples to different nodes; (2) achieve fine-grained load balancing among distributed nodes; and (3) perform semantics-preserving, on-line adaptations to dynamic stream environments. The outputs of different Join PEs, which are pairs of persons seen together in the same video, are merged by the Fusion PE and then used as another stream of connected pairs, similar to the e-mail pairs from the emailLog stream, by the Focused Community PE for criminal group identification. Fig. 4 shows the PE flow graph of a demo run organized by job. The PE flow graph is generated by a tool called Streamsight, an Eclipse plug-in developed at IBM Research to visualize PE connections in stream processing. For the demo run, there are 51 PE instances in total, organized as six different jobs. The six jobs represent five
Figure 4: PE flow graph of a DAC demo organized by job.
groups of PEs deployed to process five source streams of different modalities and another group for correlating, topK and alert generation. From the bottom to the top of Fig. 4, these six jobs involve (a) Load Diffuser PEs processing annotated video streams, (b) Focused Community PEs handling e-mail streams, (c) LoadStar PEs processing VoIP streams, (d) GrubJoin, top-K and CES PEs dealing with correlation, top-K and alert generation, (e) Micro Cluster and RDT PEs handling processed claim streams and (f) Online New Event Detector PE processing news feed streams, respectively. There are three WLG instances running on 3 separate nodes, each modeling 30 agents and generating the various data streams associated with those 30 agents. Fig. 5 show two other views of the same PE flow graph, organized regularly (left) and by host (right). For each modality of the five source streams, there are three source PEs to receive workload from the three WLG instances, respectively. For example, PEs 43-45 are the three source PEs used to receive data records of, and prepare SDOs for, the conversationSegment stream. For the VoIP streams, five LoadStar PEs (46-50 in the left graph of Fig. 5) are used. For the annotated video streams, a Load Diffuser PE (74) is used to distribute the annotated video SDOs among six Join PEs (75-80) and then a Fusion PE (81) is used to combine the join results. These 51 PEs are placed on 35 cluster nodes (see the graph on the right of Fig. 5). Some nodes have multiple PEs while others have only one single PE. As clearly shown in Fig. 5, the PE flow graph of a complete DAC is rather complex. We successfully coped with this complexity by incrementally integrating an additional subgraph to the existing, more complex DAC graph. For the demo, each PE type also provides a GUI to showcase in real time its own key features. Relevant statistics are produced by the analytic PEs and send to individual sink PEs for output display by the GUIs. Fig. 6 shows a snapshot of the output GUIs of a DAC demo run. From the top-left corner running counterclockwise, they are the output GUIs of the LoadStar PE, the GrubJoin PE, the CES PE, the top-K PE, the ONED PE, the Focused Community PE, the RDT PE and the Micro Cluster PE, respectively. The LoadStar GUI (top left of Fig. 6) shows that over 90% of the load is shed, and the false positive and false negative ratios are around 45% and 2-3%, respectively. In our demo,
Figure 5: Two other views of the PE flow graph organized regularly (left) and by host (right).
Figure 6: A snapshot of the output GUIs of a DAC demo run.
the ground truth is embedded in the claimApp stream as additionally attached SDOs. However, the analytic PEs did not have access to it. This is enforced by the flow specification of the job configuration. System S allows SDOs in a stream to be read by a PE only if the types of the SDOs match with the flow specification of the PE. The ground truth is only used by a sink PE when it is computing the quality of solution for display. The GrubJoin GUI (second left of Fig. 6) shows the join output rates of four different cases and the load shedding percentage in real time. We controlled the load shedding percentage dynamically to showcase the effectiveness of the load-shedding joins. The GrubJoin PE performs two independent joins: one between suspicious claims and problematic agents and the other between unfairly treated claims and problematic agents. We also performed a full join as a comparison to the load-shedding join. From this snapshot, it shows the load-shedding joins match almost perfectly with the full joins during a period when the percentage of load shedding is as large as 20%. Only when the load shedding reaches more than 30% do we see the output rate of one load-shedding join drops meaningfully below that of the corresponding full join. The output GUI of the CES PE (bottom left of Fig. 6) highlights in red color those squares that are penetrated by an incoming SDOs. Each square represents the predicate condition of a query alert covering two range attribute values of the input SDOs: amount granted and the suspicion/unfairness level. Different set of overlapping rectangles are rapidly flashed in red color in real time, demonstrating the fast search time of the query index in the identification of the alert conditions for an incoming SDO. All the GUIs on the right-hand side of Fig. 6 are in various table forms of a sliding window. These table entries move fast in our demo. Both the Micro Cluster GUI (top right) and the RDT GUI (second right) show the case IDs, ground truth, suspicion/unfairness level and the false positive/false negative ratios. For both, the false negatives are very low, less than 3%, but the false positives can be as high as 30%. Similar to the LoadStar PE, we adjusted our PE parameters so that the false negatives, or misses, are low while the false positives are allowed to be a bit higher. The Focused Community GUI (third right) shows the members of various focused communities. Here, we only showed the agent IDs. A plus sign in front of an ID indicates that it is a false positive while a minus sign indicates a false negative. No sign indicates it matches with the ground truth. Finally, the ONED GUI (fourth right) shows the importance level of each news feed source, such as the LA Times, New York Times or Xinhua News Agency; the top-K GUI (bottom right) shows the top SDOs from the problematic and unfairly processed claims. Fig. 7 shows the output GUI of the Load Diffuser PE, which tries to spread stream join workload among six join operators, each running on a different node. We activate different numbers of Join PEs to test how the Load Diffuser PE adapts to the change of available resources. On the top line chart, it shows the overall output rate of the cluster of PEs. The second line chart shows the number of Join PEs deployed. The third line chart shows the output rate of the first Join PE; the fourth line chart shows that of the second Join PE; and the bottom line chart shows that of the sixth Join PE. The experiments show that the Load Diffuser PE
Figure 7: The output GUI of the Diffuser PE.
Figure 8: The aggregate ingestion rate of the three hosts running the source PEs.
can achieve balanced workload distribution among available Join PEs, and dynamically re-distribute the workload when available resources change. Finally, we present two performance charts of the DAC demo run. Fig. 8 shows the aggregate ingestion rate of the DAC demo run. It aggregates the data coming into, and flowing out of, the three nodes running all the 15 source PEs (see Fig. 5). In terms of bytes per second, the ingestion rate is around 7.5M bytes/second, or about 60M bits/second. In terms of number of SDOs per second, the number of SDOs transferred via these source PEs is 4-5K SDOs/second. Note that these numbers do not include those more than 90% of conversationSegment SDOs that are dropped by the LoadStar PEs. In System S, the Data Fabric implements the load shedding instructed by the LoadStar PE by not sending those SDOs from the output ports of the source PEs. Hence, those dropped SDOs are not counted in Fig. 8. It would have been significant higher if more than 90% of the conversationSegment SDOs were counted. Note that we have not yet optimized the deployment of DAC, which is still ongoing work. Fig. 9 shows the impact of input thresholds of the GrubJoin PE on the trade-off between false negatives and false
GrubJoin output 0.5 threshold = 0.5 threshold = 0.6 threshold = 0.8
false positive ratio
0.4
0.3
0.2
0.1
0 0
0.1
0.2 0.3 fasle negative ratio
0.4
0.5
Figure 9: The impact of the input threshold of the GrubJoin PE on the quality of solution. positives. In our demo, we set thresholds on the unfairness level and the suspicion level, respectively, of the input ports of the GrubJoin PE. Only those claim SDOs with high suspicion levels or unfairness levels were joined with the problematic agents. We ran the demo multiple times with different threshold settings and compared the results with the ground truth. With threshold of 0.8 for both the unfairness and the suspicion levels, the results have less than 20% of false positives but more than 40% of false negatives. On the other hand, if the threshold is set to 0.5, the false negatives are reduced to around 10% while the false positives only increase to no more than 30%. From these observations, it is preferable to set the threshold lower to reduce the false negatives, hence increasing the quality of solution. Besides, the increased load due to the lowered thresholds can be handled by the GrubJoin PE via proper load shedding.
7. LESSONS LEARNED We learned several valuable lessons in the course of prototyping DAC. First, programming a complex stream application with many PEs can be difficult. System S made it substantially easier with important PE programming supports. In particular, System S uses a global data type system. Together with the flow specifications and the PE templates, the global type system makes connecting PEs simple. The flow specification is a powerful tool to spread a stream with a high data rate, like VoIP, to multiple PEs downstream. There is no need to construct a special PE to accomplish the task. In addition, the flow specification also allows a PE to automatically receive SDOs from other PEs whenever the SDOs are available. This property makes it possible to avoid hard-wiring PE connections in a job configuration. As a result, we can run a PE even if some of the upstream PEs, from which the PE is to receive SDOs, are currently not running. The power of flow specifications became evident when multiple LoadStar PEs were used to process the conversationSegment SDOs. With simple flow specifications, each LoadStar PE is receiving only a subset of the VoIP conversations. Moreover, the output streams produced by all the LoadStar PEs are automatically connected to the same input port of the GrubJoin PE (see Fig. 5). Secondly, debugging a distributed stream application is difficult and painful. Fortunately, Streamsight was available in the middle stage of our development to visualize PE connections as well as runtime statistics, such as the data rates
on PEs and streams. With proper colors, Streamsight allows us to visualize in real time if a particular PE has become a performance bottleneck, enabling us some degree of performance tuning. Even with Streamsight, however, it is still a challenge to debug a large-scale stream application, especially if the PE flow graph is complex. We have learned to cope with this difficult challenge with incremental designs. Namely, we started with a simple graph and then gradually increased the complexity by adding additional subgraphs one at a time. Thirdly, parallelism in itself is not sufficient to handle mismatches in stream processing demands among different PEs. Besides parallelism, resource-adaptive computations are required. In the development of DAC, we spent a long time trying to deal with the huge mismatch in stream processing requirements between the LoadStar PE and the Micro Cluster PE or the RDT PE. We could not get any meaningful join output from the GrubJoin PE at first because SDOs from the LoadStar PE did not arrive in time before the correlated SDOs from the suspiciousApp stream or the unfairApp stream were pushed out of their respective join windows. Only after we applied resource-adaptive computation to the LoadStar PE with dynamic flow specifications provided by System S, did we start to observe join outputs from the GrubJoin PE.
8.
ONGOING AND FUTURE WORK
Currently, we are working on the various optimization issues of DAC, e.g., optimal PE placement on the cluster of nodes, with an aim to maximize the ingestion rate of DAC. Specifically, how many parallel PEs should we use for the LoadStar PE? How about the Focused Community PE? Where should PEs be placed to minimize network congestion while ensuring that all get enough processing? How do we learn the communication as well as computation demands of individual PEs? These issues are related to the SODA component of System S. SODA is the optimizing scheduler for System S. It first picks a subset of jobs to execute from a huge collection of jobs submitted, with a goal to maximize measure of importance subject to job priorities and requirements. For those jobs that will be executed, SODA chooses a set of candidate nodes for each PE from a distributed cluster of heterogeneous processing nodes, with a goal to minimize the stream traffic across the network while respecting resource matching, security and a lot of other constraints. It then chooses fractional allocations of PEs to processing nodes while respecting candidate nodes. We are working with the SODA team to have optimized placement of DAC PEs on the cluster nodes. Multi-core Cell processors [17] have been jointly developed by Sony, Toshiba and IBM to power the new Sony PlayStation 3 (PS3) game consoles. In each Cell processor, there are multiple Special Processing Units (SPUs) designed mainly for data intensive computations for the PS3 machines. However, there are efforts to use the Cell processors to perform fine-grained parallel computations in other domains as well, especially in scientific computing. We are also investigating if stream analytic algorithms can be effectively parallelized by exploiting the multi-core SPUs in the Cell processors.
9.
SUMMARY In this paper, we have described three key challenges of,
and our experience in, prototyping DAC as a reference application running on System S. A first-of-a-kind, distributed stream application intended to monitor various activities involved in disaster assistance claim processing, DAC seamlessly integrates many PEs handling multi-modal streams with vastly different rates. The challenges include (1) how do we synthetically generate correlated, multi-modal source streams for DAC? (2) how do we design and implement a comprehensive stream applications using several individual PEs? (3) in view of the vastly divergent stream rates, how do we deploy the many DAC PEs over a distributed cluster of nodes? We have reported our experience in addressing these challenges. We have shown our modeling of a disaster claim processing center, where agents receive phone calls from applicants to process claims. Correlated, multi-modal source streams are then generated during the state transitions of the claim processing steps. With various PE programming supports from System S, we have designed and implemented DAC using several stream analytic PEs. To cope with the mismatches between the processing load of different PEs, we have shown the effective use of parallelism as well as load shedding. Finally, we have presented several snapshots of a DAC demo run, highlighting the PE flow graphs and the output GUIs from individual PEs.
Acknowledgment We thank Nagui Halim, the principal investigator of the System S project, and Lisa Amini, the prototype technical leader, for providing us with invaluable guidance throughout the development of DAC. We also thank Kay Anderson and Mark Feblowitz for contributing to the early discussions of reference applications for System S; Wim De Pauw for his Streamsight, an Eclipse plug-in for visualizing the PE flow graphs of DAC; and Spyridon Papadimitriou for his Diffuser GUI. Last, but not least, we thank Henrique Andrade, Yoonho Park, Philippe L. Selo and Chitra Venkatramani, for helping us debug and fix many programming bugs, some of them proved to be rather elusive.
[7]
[8]
[9]
[10]
[11]
[12]
[13] [14]
[15] [16] [17]
[18]
10. REFERENCES [1] D. J. Abadi, Y. Ahmad, M. Balazinska, U. Cetintemel, M. Cherniack, J.-H. Hwang, W. Lindner, A. S. Maskey, A. Rasin, E. Ryvkina, N. Tatbul, Y. Xing, and Z. Zdonik. The design of the Borealis stream processing engine. In Proc. of CIDR, 2005. [2] C. C. Aggarwal, J. Han, J. Wang, and P. S. Yu. A framework for projected clustering of high dimensional streams. In Proc. of VLDB, 2004. [3] C. C. Aggarwal, J. Han, J. Wang, and P. S. Yu. On-demand classification of evolving data streams. In Proc. of ACM SIGKDD, 2004. [4] K. S. Anderson, J. P. Bigus, E. Bouillet, P. Dube, N. Halim, Z. Liu, and D. Pendarakis. SWORD: Scalable and flexible workload generator for distributed data processing systems. In Proc. of the 2006 Winter Simulation Conference, 2006. [5] A. Arasu, B. Babcock, M. Datar, K. Ito, I. Nishizawa, J. Rosenstein, and J. Widom. STREAM: The Stanford stream data manager (demo proposal). In Proc. of ACM SIGMOD, 2003. [6] S. Chandrasekaran, O. Cooper, A. Deshpande, M. J. Franklin, J. M. Hellerstein, W. Hong,
[19]
[20]
[21]
[22] [23]
[24]
S. Krishnamurthy, S. Madden, V. Raman, F. Reiss, and M. Shah. TelegraphCQ: Continuous dataflow processing for an uncertain world. In Proc. of CIDR, 2003. Y. Chi, P. S. Yu, H. Wang, and R. R. Muntz. Loadstar: A load shedding scheme for classifying data streams. In Proc. of SIAM Data Mining, 2005. W. Fan, E. Greengrass, J. McClosky, K. Drummey, and P. S. Yu. Effectiveness estimation of posterior probabilities: Explaining the accuracy of randomized decision tree approaches. In Proc. of IEEE ICDM, 2005. W. Fan, J. McClosky, and P. S. Yu. A general framework for fast and accurate regression by data summarization in random decision trees. In Proc. of ACM SIGKDD, 2006. B. Gedik, K.-L. Wu, P. S. Yu, and L. Liu. Adaptive load shedding for windowed stream joins. In Proc. of ACM CIKM, 2005. B. Gedik, K.-L. Wu, P. S. Yu, and L. Liu. A load shedding framework and optimizations for M-way windowed stream joins. In Proc. of IEEE ICDE, 2007. X. Gu, Z. Wen, C.-Y. Lin, and P. S. Yu. Design and implementation of an adaptive distributed on-line video correlation system. In ACM Multimedia, 2006. X. Gu and P. S. Yu. Adaptive load diffusion for stream joins. In Middleware, 2005. X. Gu, P. S. Yu, and H. Wang. Adaptive load diffusion for multiway windowed stream joins. In Proc. of IEEE ICDE, 2007. K. W. Hildrum and P. S. Yu. Focused community discovery. In Proc. of IEEE ICDM, 2005. IBM. UIMA. http://www.research.ibm.com/UIMA/. IBM. Cell broadband engine architecture, technical report version 1.0. IBM Systems and Technology Group, 2005. N. Jain, L. Amini, H. Andrade, R. King, Y. Park, P. Selo, and C. Venkatramani. Design, implementation and evaluation of the linear road benchmark on the stream processing core. In Proc. of ACM SIGMOD, 2006. G. Luo, C. Tang, and P. S. Yu. Resource-adaptive real-time new event detection. In Proc. of ACM SIGMOD, 2007. G. Luo, K.-L. Wu, and P. S. Yu. SAO: A stream index for answering linear optimization queries. In Proc. of IEEE ICDE, 2007. S. R. Madden, M. A. Shah, J. M. Hellerstein, and V. Raman. Continuously adaptive continuous queries over streams. In Proc. of ACM SIGMOD, 2002. Streambase. http://www.streambase.com. K.-L. Wu, S.-K. Chen, and P. S. Yu. Query indexing with containment-encoded intervals for efficient stream processing. Knowledge and Information Systems, 9(1):62–90, Jan. 2006. S. Zdonik, M. Stonebraker, M. Cherniak, U. Cetintemel, M. Balazinska, and H. Balakrishnan. The Aurora and Medusa projects. IEEE Technical Committee on Data Engineering, Mar. 2003.