Changes in Autonomic Nervous System Activity and in Electro-Cortical Activity during Sleep Onset Z Shinar, A Baharav, S Akselrod Tel-Aviv University, Tel-Aviv, Israel Abstract This study is aimed at investigating the behavior of the Autonomic Nervous System (ANS) at Sleep Onset (SO) and to correlate it with higher brain activity captured as surface Electroencephalogram (EEG). The study was performed on data obtained from 16 healthy subjects who underwent standard polysomnography (PSG). The instantaneous Heart Rate Variability (HRV) provided a measure of ANS activity, and EEG was quantified by time-frequency analysis measuring power in alpha and delta frequency bands. The results revealed a power decrease in the VLF component of the inter-beat (RR) interval to a minimal level around SO, similar changes, though to a lesser degree in the LF component, and almost no change in the HF component. These changes correlated with a drop in alpha and a surge in delta EEG power. The sympathovagal balance, as reflected by LF/HF ratio, pointed towards an increase in the parasympathetic activity after SO.
1.
Introduction
The central regulation of autonomic function changes dramatically between the different states of the living organism: wakefulness, Rapid Eye Movement sleep, and Non Rapid Eye Movement (NREM) sleep [1]. In view of these great differences, it is of interest to look into the changes of the functioning of the autonomic nervous system that occur with SO. Direct studies of the autonomic activity, involving invasive procedures, are usually avoided due to their relative complexity and invasiveness. Some of our knowledge can be inferred from the response of end organs. It is common knowledge and practice that standard methods of power spectral analysis (Fourier transform or auto regression) of heart rate (HR) can be applied to obtain important information on the central autonomic regulation. Such HR-variability (HRV) measures include the low frequency (LF) power component that reflects, in supine position, both sympathetic and parasympathetic influences at the sinus node, and the high frequency (HF) power component, around the respiratory frequency that represents mainly
0276−6547/03 $17.00 © 2003 IEEE
parasympathetic activity [2]. Since the LF includes information on both divisions of the ANS, an estimate of autonomic or sympathovagal balance can be defined as the ratio LF/HF [3, 4]. The application of these standard spectral approaches is limited to steady state processes only. Under changing physiological conditions, caused by external interventions, internal or external stimuli (such as may accompany SO), the use of these methods becomes unreliable due to violation of the stationarity criterion. Time-dependent spectral decomposition of beat-to-beat variability in HR can provide insight into the transient autonomic changes that occur with SO. We analyzed instantaneous RR during the transient phase of SO, using the previously described SDA [5, 6]. The SDA is an algorithm specially designed to perform time-dependent spectral analysis of non-stationary signals. It uses shorter time windows to estimate fluctuations of higher frequencies and wider windows for lower frequencies, thus achieving optimal time resolution for each frequency. The exact definition of SO is debatable, since there is no specific single parameter that distinguishes sleep from wakefulness. The standard definition of the transition is based on changes in EEG, EOG, and EMG, and it usually detects the changes reliably within a few seconds. During wakefulness alpha band frequencies (8-14Hz) dominate the EEG (as long as the subject closes eyes) and during the transition to sleep, alpha abundance decreases to half (or less). Delta frequencies (0.5-4Hz) increase along Non-Rapid-Eye-Movement sleep, and dominate the EEG when deeper stages of sleep are attained. However, SO detection is further complicated by the fact that the subjective perception of falling asleep does not always coincide with the defined SO, and also, that often enough, SO does not occur all at once. There may be some fluctuating vigilance before stable, unequivocal sleep intervenes. The complexity of the transition from quiet wakefulness to NREM sleep is uncovered by the study of behavioural correlates at SO, such as the performance of simple behavioural tasks, memory tasks, or the response to auditory, visual or meaningful stimuli [7, 8]. It is due to this complexity that we chose, in the present study, to compare estimates of the ANS state with some direct measurements of brain activity, EEG that
303
Computers in Cardiology 2003;30:303−306.
serves the main indicator of sleep/wake state. In view of the above, the aim of this study was to characterize the autonomic changes involved in the process of SO and compare them with the behaviour of EEG during SO. A time dependent approach can provide a continuous insight into the changes of autonomic function during the transition between two totally different states of being: (quiet) wakefulness and NREM sleep.
2.
Methods
2.1.
Subjects
Sixteen healthy subjects (ages 18-48 years, 30!7 mean!sd) who underwent whole night PSG and had long enough sleep latency were included in this study.
2
Data acquisition VLF
2.2.
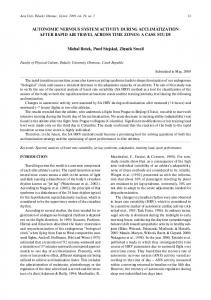
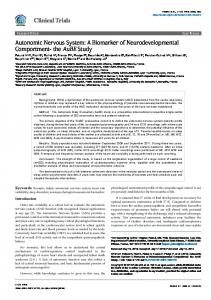
RRI series and EEG signal, as defined in section 2.3., for a subject who entered sleep smoothly. Note that power drop in the alpha band and power surge in the delta band, which occurred around epoch 25, do not necessarily coincide with classical definition of SO, which occurred at epoch 19. Furthermore, note the power drop in VLF, LF, and HF bands which also occurred around epoch 25. The drop in the first two bands repeated in most subjects. Figure 2 shows the same parameters as Figure 1 but for a subject who had difficulties to fall asleep, and reached unequivocal sleep, according to standard criteria, around epoch 125. Note the alpha power decrease and delta power increase begin with a delay of about 5 epochs (around epoch 130) and are very moderate in comparison with Fig 1.
Sleep studies included polysomnography with digitization and recording of the following channels: (i) 4 EEG channels (two central and two occipital leads), (ii) EOG, (iii) Chin EMG, (iv) ECG channel sampled at 200 Hz, (v) Abdominal and chest respiratory effort, (vi) Nasal and oral airflow, (vii) Oxygen saturation and pulse wave. The polysomnograms were manually scored according to the Rechtschaffen and Kales criteria [9].
Results Figure 1 shows the time dependent spectral power of
0
10
20
30
40
50
60
70
80
90
0
10
20
30
40
50
60
70
80
90
0
10
20
30
40
50
60
70
80
90
0
10
20
30
40
50
60
70
80
90
0
10
20
30
40
50
60
70
80
90
0
10
20
30
40 50 60 Time in epochs
70
80
90
LF
0.1 0 0.2
HF
Data analysis
0.1 0
delta
1 0.5 0 1 alpha
SO was defined according to the standard criteria, as the first of two consecutive NREM stage I epochs (30 seconds period), or the first epoch of any other sleep stage. The EEG and ECG signals were analyzed as follows: Step 1: For every subject, a time-dependent spectral analysis by SDA [5, 6] of the instantaneous RR interval, and power integration of 3 spectral bands: VLF (0.0050.04Hz) LF (0.04-0.15Hz) HF (0.15-0.5Hz), was performed. Step 2: For every subject, time-dependent spectral analysis by SDA [6] of the central EEG channel, and power integration of 2 spectral bands: Delta (0.5-4Hz) Alpha (8-15Hz), was performed. Step 3: For every subject, two reference points were defined: Alpha/Delta reference point as the time of power decrease/increase to two thirds of average value before/after SO according to standard criteria. Step 4: The normalized results of each spectral band of Step 1, were averaged over all subjects in 21 points 50 seconds apart: 10 points before Alpha/Delta reference point, beginning 500 seconds before the reference, 1 point at the reference point, and another 10 points till 500 seconds after the reference time.
3.
0 0.2
0.5 0
Stage
2.3.
1
4 3 2 1 0
Figure 1. Example of the results obtained for a single subject. First 3 frames contain plots of the VLF, LF and HF power spectrum as a function of time in epochs (1 epoch = 30 seconds). Frames 4 and 5 show the EEG power spectrum in delta and alpha frequency bands respectively. Bottom frame contains the corresponding sleep stages as a function of time based on standard sleep scoring criteria.
304
The results for all subjects, both those who developed sleep smoothly and those who fluctuated between sleep and wakefulness, were averaged and are shown in figure 3. VLF power decreased gradually towards the reference point, reached minimal values around 100 seconds after the reference, and increased moderately afterwards. LF power displayed similar behaviour however less pronounced. HF power did not change significantly.
4.
Discussion
SO represents a transition between two different physiological, cognitive and behavioral states of being: wakefulness and sleep. This transition is accompanied by sensor-motor disengagement from external stimuli, quiescence, significant changes in ANS function, extreme changes in cognition paralleled by characteristic changes in EEG activity, namely a decrease in frequency along with increased amplitude and synchronization of brain electrical activity.
VLF
1.5 1 0.5 100
110
120
130
140
150
160
170
180
0 90 0.05
100
110
120
130
140
150
160
170
180
0 90 1
100
110
120
130
140
150
160
170
180
100
110
120
130
140
150
160
170
180
0 90
100
110
120
130
140
150
160
170
180
4 3 2 1 0 90
100
110
120
130 140 150 Time in epochs
160
170
180
0.05
delta
HF
LF
0 90
0.5
Stage
alpha
0 90 0.4 0.2
Figure 2. Example of the results obtained for a single subject who fell asleep and awoke on and off till he reached unequivocal sleep in epoch 123. The frames describe the same parameters as Fig 1.
During the transition around SO, many of the above mentioned changes are very dramatic and occur at a specific point of time. However, different changes usually do not coincide in time. This implies that SO is not necessarily a discrete event but rather a continuous process of transition between states of being, that affects many, if not all, cognitive and physiological systems. In the present study we aimed to describe the autonomic changes during SO and their interconnection with an important measure of electro-cortical activity of the brain namely - the surface EEG. The results show that the power in the LF frequency band of RRI series, and especially the VLF power decrease towards a minimal value during the process of SO. The averaged minimal values in VLF and LF power occurred within 100 second from a reference point indicating one third decrease from average alpha/delta power before/after SO. HF power, that reflects mainly parasympathetic activity and is modulated by respiration, did not change significantly during SO. This finding should be interpreted in the context of the meticulous studies performed by Trinder [10, 11] that dealt with respiration and ventilation during SO. He found no changes in respiratory rate and a decrease in minute ventilation, which was related with the fluctuations in wakefulness. This suggests that a possible increase in HF power was obscured by the decrease in ventilation, known to reduce HF power [4, 12]. Furthermore, a potential increase in HF during SO, i.e. at the beginning of Non-Rapid-EyeMovement sleep (Light Sleep), corroborate with the known HF power increase during deeper stages of NonRapid-Eye-Movement sleep (Slow Wave Sleep) [13]. An additional finding is related to the oscillatory waning pattern of wakefulness before SO. This same pattern appears in the decrease of alpha power as well as in the increase in delta power of surface EEG. This undulant behavior is accompanied by a similar behavior of the ANS function as derived from HRV. The power in all frequency bands of the RRI series displays fluctuates synchronous with those in alpha and delta EEG power bands (see for example – epochs 107-108 in Fig 2). Finally, the decrease in VLF power begins before changes in EEG power begin. In this study we could not trace the beginning of VLF descent since in most of the sleep studies, the sleep latency was too short to allow meaningful analysis. Furthermore, we could view a wavelike behavior of VLF power that occurred before SO, even when the subject developed sleep smoothly ( see Fig 1). We conclude that ANS activity at the wake – sleep transition is affected by the same underlying mechanism that governs the process of SO. It fluctuates towards the period of SO and reaches a minimal value during that period. Monitoring ANS activity can provide an
305
additional indicator of the transition from wakefulness to sleep. This indicator is obtained easily and provides insight into the changes in control mechanisms that occur during sleep.
0.8 VLF LF HF
0.7 0.6 0.5 0.4 0.3 0.2 0.1
+500
+400
+300
+200
+100
Delta ref
-100
-200
-300
-400
-500
0
0.8 0.7
VLF LF HF
0.6 0.5 0.4 0.3 0.2 0.1
+500
+400
+300
+200
+100
Alpha ref
-100
-200
-300
-400
-500
0
Figure 3. Normalized power spectrum of the RRI series, averaged over all subjects (n=16), and synchronized to a common reference point. The abscissa is the time scale in seconds relative to reference point. Upper plot shows results with reference set on the time that the delta power reached two thirds of its average value after SO. Lower pane shows results with reference set on the time that the alpha power decreased to two thirds of its average value before SO.
References [1] Parmeggiani PL, Morrison AR. Alterations in autonomic functions during sleep. In: Loewy AD, Spyer KM, editors. Central Regulation of Autonomic Functions. Oxford: Oxford University Press, 1990:367-86. [2] Akselrod S, Gordon D, Ubel FA, Shanon DC, Barger AC, Cohen RJ. Power spectrum analysis of heart rate fluctuation: a quantitative probe of beat-to-beat cardiovascular control. Science, 1981;213:220-2. [3] Akselrod S. Basic Principles of Heart Rate Variability. In: Malik M, Camm AJ, editors. Heart Rate Variability. New York: Futura Publishing Company, 1995:147-63. [4] Malliani A., Association of heart rate variability components with physiological regulatory mechanisms. In: Malik M, Camm AJ editors. Heart rate variabiliy. New York: Futura Publishing Company, 1995:173-88. [5] Keselbrener L, Akselrod S. Selective discrete Fourier transform algorithm –SDA – for time-frequency analysis: Methods and application on simulated and cardiovascular signals. IEEE Trans. Biomed. Eng., 1996, 43: 789-802. [6] Toledo E, Gurevich O, Hod H, Eldar M, Akselrod S. Wavelet analysis of instantaneous heart rate: a study of autonomic control during thrombolysis. American Journal of Physiology: Regulatory, Integrative and Comparative Physiology 2003;284:R1079-91. [7] Ogilvie RD, Wilkinson RT. The detection of sleep onset: behavioral, physiological, and subjective convergence. Sleep, 1989;12:458-74. [8] Ogilvie RD. The process of falling asleep. Sleep Medicine Reviews, 2001;5:247-70. [9] Rechtschaffen A., Kales A.. A manual of Standardized Terminology, Techniques and Scoring system for Sleep Stages of Human Subjects. US Government Printing Office, Washington, DC, NIH Publication 1968, 204. [10] Trinder J, Whitworth F, Kay A., Wilkin P. Respiratory instability during sleep onset. J. Appl. Physiol., 1992, 73: 2462-9. [11] Worsnop C, Kay A, Pierce R, Kim Y, Trinder J. Activity of respiratory pump and upper airway muscles during sleep onset. J. Appl. Physiol., 1998, 85:908-20. [12] Hirch JA, Bishop B. Respiratory sinus arrhythmia in humans: how breathing pattern modulates heart rate. Am. J. Physiol., 1981;241: H620-9. [13] Baharav A., Kotagal S, Gibbons V, Rubin BK, Pratt G, Karin J, Akselrod S. Fluctuations in autonomic nervous activity during sleep displayed by power spectrum analysis of heart rate variability. Neurology, 1995;45:1183-7
Address for correspondence. Zvika Shinar. Physics Dept, Tel-Aviv University, Tel-Aviv, Israel.
[email protected].
306