Nutrients 2012, 4, 1794-1811; doi:10.3390/nu4121794 OPEN ACCESS
nutrients ISSN 2072-6643 www.mdpi.com/journal/nutrients Article
Changes in Dairy Food and Nutrient Intakes in Australian Adolescents Carole E. Parker 1,†, Wendy J. Vivian 1,†, Wendy H. Oddy 2, Lawrence J. Beilin 3, Trevor A. Mori 3 and Therese A. O’Sullivan 1,2,* 1
2
3
†
School of Exercise and Health Science, Edith Cowan University, Joondalup, Western Australia, 6027, Australia; E-Mails:
[email protected] (C.E.P.);
[email protected] (W.J.V.) Telethon Institute for Child Health Research, Centre for Child Health Research, University of Western Australia, West Perth, Western Australia, 6005, Australia; E-Mail:
[email protected] School of Medicine and Pharmacology Royal Perth Hospital Unit, The University of Western Australia, Perth, 6000, Australia; E-Mails:
[email protected] (L.J.B.);
[email protected] (T.A.M.) These authors contributed equally to this work.
* Author to whom correspondence should be addressed; E-Mail:
[email protected]; Tel.: +61-8-6304-5055; Fax: +61-8-6304-5384. Received: 22 August 2012; in revised form: 16 October 2012 / Accepted: 5 November 2012 / Published: 22 November 2012
Abstract: Dairy nutrients, such as calcium, are particularly important in adolescence, a critical time for growth and development. There are limited Australian data following individuals through adolescence, evaluating changes in dairy nutrient and dairy product consumption. We used a validated food frequency questionnaire to investigate consumption in adolescents participating in both the 14 and 17 year follow-ups of the Western Australian Pregnancy Cohort (Raine) Study. Most adolescents did not reach age and gender specific recommended daily intakes for calcium or magnesium at 14 years, and this decreased as they aged to 17 years (from 33.0% to 29.2% meeting for calcium, P < 0.05, and from 33.6% to 20.5% meeting for magnesium, P < 0.01). Mean intakes of calcium, potassium, riboflavin and vitamin A also decreased with age (P < 0.01). Mean dairy intake decreased from 536 ± 343 g/day to 464 ± 339 g/day (P < 0.01), due mostly to a decrease in regular milk, although flavoured milk consumption increased in boys. Cheese and butter were the only products to show a significantly increased consumption over the
Nutrients 2012, 4
1795
period. Girls decreased from 2.2 to 1.9 serves/day of dairy, while boys remained relatively steady at 2.9 to 2.8 serves/day. Our findings suggest that dairy product consumption decreases over adolescence. This may have implications for bone mass, development and later health. Keywords: dairy; dietary intake; adolescent; teenage; Raine study; calcium; milk; yoghurt; cheese
1. Introduction Dairy products such as milk, cheese and yoghurt are an important source of essential micronutrients including calcium, riboflavin, phosphorus, potassium, magnesium, zinc, vitamin A and vitamin B12 [1]. They also provide a combination of protein, carbohydrate, and fat. Nutrients from dairy products are well known for their role in building and maintaining strong bones [2], although meta-analyses of different populations show varied results in the area of dairy and bone health. Increased dietary calcium and dairy products have been shown to significantly improve total bone mineral content in children with initially low intakes [3], and positive benefits of calcium on bone mineralization in children and adolescents have been found in nine out of ten randomized controlled trials in a meta-analysis [4]. Despite this, the latter analysis found no consistent benefit when all types of studies were considered [4], and an analysis examining milk and hip fracture risk in adults was also inconclusive [5]. However dairy nutrients are also reported to be important for immune and nervous systems, red blood cell production, eyesight, muscle and nerve function, skin maintenance and wound healing [6]. In terms of chronic disease, higher dairy intakes are also associated with a reduction in risk for all cause deaths, cardiovascular disease and diabetes [7]. Hence, dairy products are recommended as part of a healthy diet in childhood, adolescence [8] and adulthood [9]. Adequate intake of nutrients found in dairy products, such as calcium, is particularly important in adolescence as this is a critical time for growth and accumulation of bone mass [10,11], with 40% of total bone mass development occurring during this period [12]. Bone turnover is high and bone accrual lags due to increases in height and weight, with peak bone mass usually attained by 20 years of age [13,14]. This increase in nutrient requirements for growth coincides with increasing autonomy of the adolescent to make their own food and drink choices [15], and the establishment of eating patterns that track into adulthood [16]. Increasing independence, peer acceptance, more time spent at school or other activities, and self image contribute to food choices made at this time, setting the scene for long term health outcomes [17,18]. Despite the importance of dairy nutrients, the 2007 Australian National Children’s Nutrition and Physical Activity Survey indicated the majority of Australian adolescents do not consume the recommended intakes of some of these nutrients, in particular calcium [19]. Dieting is one factor that has been strongly associated with low consumption of dairy foods [20]. Girls appear to be at a higher risk than boys of not meeting their dietary calcium requirements, and consumption of dairy foods is often reported as low in adolescent groups [19,21–23]. Analysis of dairy products from the Australian National Children’s Nutrition and Physical Activity Survey indicated that milk products and dishes
Nutrients 2012, 4
1796
contributed between 32% and 60% of dietary calcium across childhood and adolescence, highlighting their importance in the diet [24]. To our knowledge, there is a lack of Australian data following the same individuals through adolescence evaluating how nutrient intakes and dairy product consumption change over time. This study tracks the dietary intakes of dairy products and associated nutrients of adolescents participating in the Western Australian Pregnancy Cohort (Raine) Study. The same subjects were followed from 14 to 17 years of age. We hypothesize that intake of dairy products and associated nutrients decreases from 14 to 17 years, and that greater decreases are associated with female gender, lower socio-economic status and higher weight category. 2. Subjects and Methods 2.1. Subjects The Raine Study is a longitudinal observational study that commenced in 1989 when 2900 mothers were recruited from King Edward Memorial Hospital and local clinics in Perth, Australia. Details of recruitment have been previously published, with 2868 babies available for follow-up [25]. Children were assessed at birth, 1, 2, 3, 5, 8, 10, 14 and 17 years of age. This study reports on data collected at the 14 and 17 year follow-ups, with collection at each follow-up occurring over a three year period commencing in 2003 and 2006, respectively. From the original cohort of 2868 live births, 1631 adolescents completed the FFQ in the 14 year follow-up and 1009 completed the FFQ in the 17 year follow-up. A total of 860 adolescents (46% male, 89% Caucasian) who completed FFQs at both the 14 and 17 year follow-ups were included in this study, after 26 were excluded for implausible energy intakes. The ethics committees of King Edward Memorial Hospital for Women and Princess Margaret Hospital for Children granted ethics approval for the study. Informed consent for participation was obtained from the participant’s parent or guardian, and the participant. 2.2. Dietary Data Collection At both the 14 and 17 year follow-ups, dietary intakes were assessed using a self reported food frequency questionnaire (FFQ) booklet developed by the Commonwealth Scientific and Industrial Research Organization (CSIRO) Adelaide, Australia [26]. This semi-quantitative FFQ asked about frequency of consumption in relation to standard serve sizes and collected information on 212 foods, mixed dishes, and beverages, including items popular amongst adolescents [27]. Caregivers assisted with completion of the booklets. The FFQs were checked by a research nurse and discrepancies clarified with the adolescent/caregiver [27]. 2.3. Weight Status and Socio-Economic Status Height was measured to the nearest 0.1 cm using a Holtain Stadiometer, and weight to the nearest 100 g using a Wedderburn Digital Chair Scale. Body mass index (BMI) was calculated as weight (kg)/(height (m))2. Age and gender specific BMI cut offs were used to determine underweight, normal weight, overweight and obesity [28,29]. The Socio-Economic Indexes for Areas (SEIFA) based on 2006 Australian Bureau of Statistics census data for Index of Education and Occupation,
Nutrients 2012, 4
1797
ranked residential postcodes into decile ratings as a measure of socio-economic status, with lower deciles being relatively disadvantaged compared to higher deciles [30]. 2.4. Data Analysis Using the FFQ data, dairy consumption was calculated for core dairy foods which included total milk, yoghurt, cheese, custard, and non-core dairy foods butter, cream and ice cream. Total milk comprised of flavored milk, milkshakes and smoothies in addition to plain milk. Contributions to milk, butter and cheese from mixed dishes such as milk puddings, mornay dishes and pizza were included after analysis with FoodWorks® Professional 2009 dietary software (Xyris Software Pty Ltd., Queensland, Australia). Recipes were standardised against ―Cookery the Australian Way‖ [31] and the ―Taste Australia‖ website [32], with dairy content determined and added to the applicable category. Dairy foods were categorised into either regular or reduced fat dairy, which were either specified as such in the FFQ or calculated based on FoodWorks analysis or nutrient information panels. Serve sizes were based on the Australian Guide to Healthy Eating for milk (250 mL), cheese (40 g), yoghurt (200 g) and custard (250 mL) [33]. A serve size was estimated to contain 300 mg calcium (range 252–350 mg), and this was used to calculate equivalent serve sizes for non-core dairy foods based on calcium content. The recommended daily intake for serves of dairy that we used to compare our data was three serves per day, based on the Australian Guide to Healthy Eating ―Healthy Diet example A‖ for children aged 12–18 years [33]. Data were analysed with Predictive Analytics Software (PASW) for Windows, version 18.0, 2009 (SPSS Inc., IBM, Chicago, IL, USA). Descriptive statistics including mean and standard deviation were used to report data within each age group and gender. Data analyses were conducted on each age cohort for intakes of nutrients including calcium, magnesium, phosphorus, potassium, zinc, vitamin B12, vitamin A, riboflavin, protein, saturated, monounsaturated and polyunsaturated fats and were compared to Australian Nutrient Reference Values for Recommended Daily Intakes (RDI) or Adequate Intakes (AI) if RDI were not available [34]. The Estimated Average Requirement (EAR) was also calculated for each nutrient. EAR describes the daily nutrient level required to meet the needs of half the healthy individuals of a gender and life stage [34]. Subjects were excluded due to implausible intake energy data, defined as less than 3000 kJ or greater than 20,000 kJ [35]. Paired sample t-tests were used to assess changes in individual intakes over time, which was appropriate for both normal and non-normal distributions given our large sample size [36]. Crosstab analyses identified percentages of adolescents meeting the RDI for each nutrient and were also used to categorise the spread of dairy nutrients consumption across genders and age groups. The McNemar test was performed to identify whether the proportion of adolescents meeting recommended intakes were different between 14 and 17 year follow-ups. Analysis of variance was used to assess associations between BMI, socio-economic status (SES) and change in dairy intake. P values less than 0.05 were considered statistically significant.
Nutrients 2012, 4
1798
3. Results 3.1. Subjects The mean age of participants included in this study at the 14 year follow-up was 14.0 ± 0.2 years with a range of 13.0–14.9 years, while the mean age at the 17 year follow-up was 16.9 ± 0.2 years with a range of 15.8–18.3 years. The majority of participants were of normal weight at the 14 year follow-up (69.4%), followed by overweight (18.0%), underweight (6.9%) and obese (5.7%). The majority of participants were in the highest three deciles of SEIFA (52.3%), followed by the middle four deciles (33.7%) and the lowest three deciles (14.0%). 3.2. Intake of Dairy Nutrients Micro and macronutrient intakes of interest for the 14 and 17 year follow-ups are displayed in Table 1. At 14 years, the majority of both boys and girls did not reach the RDI for calcium or magnesium, and the proportion meeting the RDI went on to decrease at 17 years for both these nutrients, significantly for magnesium (both genders) and for calcium (girls only). Although total energy intake was not significantly different for the group from 14 to 17 years, mean intakes of potassium, riboflavin, vitamin A and fats decreased. Mean intakes of vitamin B12, zinc, energy, and protein significantly increased for boys, while no nutrients significantly increased for girls. The majority of this cohort met the EAR for most of the nutrients, with exceptions of calcium and magnesium. For calcium, 41.4% of girls at 14 years and 30.6% at 17 years met the EAR, while 62.7% of boys at 14 years and 59.9% at 17 years met the EAR. Similarly, for magnesium, 50.1% of girls at 14 years and 34.1% at 17 years met the EAR, while 57.9% of boys at 14 years and 46.6% at 17 years met the EAR. 3.3. Intake of Dairy Products by Grams Intake of dairy products by type at 14 and 17 years is shown in Table 2, for the total group and also separately for those considered to be ―consumers‖ (adolescents who reported consuming an average of at least one gram per day of the product). Total dairy intake significantly decreased for both boys and girls, due mostly to a decrease in consumption of regular milk, although flavoured milk consumption increased in boys. Cheese and butter were the only dairy products to show a significantly increased consumption over the adolescent period. Milk was the product consumed by the highest proportion of adolescents, followed by cheese and ice cream.
Nutrients 2012, 4
1799
Table 1. Micro and macronutrient intakes for 14 and 17 year Raine study follow-up participants compared to Recommended Daily Intake (RDI) according to gender and age in years (y). 14 year follow-up (aged 13–15 y) One Nutrients
Calcium (mg) Potassium (mg) Phosphorus (mg) Magnesium (mg) Riboflavin (mg) Vitamin A d (μg) Vitamin B12 (mg) Zinc (mg) Energy (MJ) Protein (g)
Total (n = 860)
dairy
Mean ±
serve a
SD
300
318
251 23.6 0.47 86.7 n/a 1.12 842 9.67
1154 ± 525 3674 ± 1217 1599 ± 561 309 ± 102 2.37 ± 0.95 1219 ± 582 4.34 ± 2.12 12.5 ± 4.1 9.42 ± 2.89 92.7 ± 28.9
Girls (n = 461)
% meet
RDI b
RDI 33.0
1300 AI c
70.2
13 y: 2500 14–15 y: 2600
70.6 33.6 93.3 83.7 88.7 78.5 n/a 95.1
1250
Mean ± SD 1030 ± 480 3476 ± 1217 1456 ± 525
13 y: 240
288 ±
14–15 y: 360
98.9
13 y: 0.9
2.13 ±
14–15 y: 1.1
0.85
13 y: 600
1176 ±
14–15 y: 700
610
13 y: 1.8
3.93 ±
14–15 y: 2.4
2.10
13 y: 6
11.5 ±
14–15 y: 7
3.8
n/a
8.74 ± 2.78
13 y: 35
85.3 ±
14–15 y: 45
27.3
17 year follow-up (aged 16–18 y) Boys (n = 399)
% meet
RDI
RDI 23.4
1300 AI c
76.4
13 y: 3000 14–15 y: 3600
59.2 31.7 91.8 87.0 84.2 90.9 n/a 96.7
1250
Mean ± SD 1298 ± 539 3903 ± 1177 1765 ± 558
13 y: 240
335 ±
14–15 y: 410
100
13 y: 0.9
2.65 ±
14–15 y: 1.3
0.98
13 y: 600
1269 ±
14–15 y: 900
543
13 y: 1.8
4.81 ±
14–15 y: 2.4
2.03
13 y: 6
13.5 ±
14–15 y: 13
4.1
n/a
10.20 ± 2.82
13 y: 40
101 ±
14–15 y: 65
28.4
Total (n = 860) % meet RDI 44.1
63.2
83.7 35.8 95.0 79.9 94.0 64.2 n/a 93.2
Mean ± SD 1088 ± 592 ** 3408 ± 1276 ** 1564 ± 657 303 ± 115 2.24 ± 1.03 ** 1091 ± 802 ** 4.41 ± 2.76 12.2 ± 4.8 9.35 ± 3.37 92.2 ± 36.1
Girls (n = 461)
% meet
RDI
RDI 29.2 *
1300
56.9 **
2600
63.8 **
1250
20.5 **
360
88.0 **
1.1
67.5 **
700
83.2 **
2.4
68.7 **
7
n/a
n/a
89.5 **
45
Mean ± SD 913 ± 465 ** 3095 ± 1113 ** 1343 ± 526 ** 269 ± 96.8 ** 1.91 ± 0.84 ** 1030 ± 716 ** 3.70 ± 2.34 ** 10.5 ± 4.0 ** 8.00 ± 2.64 ** 79.1 ± 28.8 **
Boys (n = 399) %
meet
RDI
RDI 17.6 *
1300
63.3 **
3600
51.2 **
1250
14.8**
410
84.9 **
1.3
70.6 **
900
75.1 **
2.4
81.6 **
13
n/a
n/a
90.9 **
65
Mean ± % meet SD 1291 ± 655 3771 ± 1355 1819 ± 701 342 ± 122 2.63 ± 1.10 1161 ± 887 * 5.23 ± 2.98 * 14.1 ± 4.9 * 10.90 ± 3.47 ** 107.3 ± 37.9 **
RDI 42.6
49.4 **
78.4 * 27.1 ** 91.6 63.7 ** 92.7 53.4 ** n/a 88.0 **
Nutrients 2012, 4
1800 Table 1. Cont.
Saturated fat (g)
5.77
Monounsaturated
2.13
fat (g) Polyunsaturated fat (g)
0.27
39.0 ± 15.8 30.8 ± 11.2 13.5 ± 6.5
n/a
n/a
n/a
n/a
n/a
n/a
35.7 ± 14.5 28.5 ± 10.3 12.8 ± 6.1
n/a
n/a
n/a
n/a
n/a
n/a
42.8 ± 16.5 33.4 ± 11.7 14.2 ± 6.9
n/a
n/a
n/a
37.1 ± 18.3 ** 28.7 ± 12.4 ** 11.7 ± 6.5 **
n/a
n/a
n/a
n/a
n/a
n/a
30.7 ± 14.4 ** 24.1 ± 9.73 ** 10.4 ± 5.7 **
n/a
n/a
n/a
n/a
n/a
n/a
44.6 ± 19.6 34.0 ± 13.2 13.3 ± 7.1 *
n/a
n/a
n/a
* P < 0.05 significant difference from 14 y, ** P < 0.01 significant difference from 14 y; a Nutrients provided by standard serve of dairy, based on average values of cheese (40 g), yogurt (200 g), regular milk 3.5% fat (250 mL) and custard (250 mL); b RDI = Recommended Daily Intake (RDI) according to gender and age in years [34]; c AI = Adequate Intake—the average daily nutrient intake, assumed to be adequate for a group of healthy people [34]; d Vitamin A in retinol equivalents.
Table 2. Daily intake of dairy products for 14 and 17 year Raine study follow-up participants for the total group and those who are consumers (>1 g/day). 14 year follow-up Dairy product Total dairy (g)
17 year follow-up
Total (n = 860)
Boys (n = 399)
Girls (n = 461)
Total
Boys (n = 399)
Girls (n = 461)
Mean ±SD
Mean ±SD
Mean ±SD
Mean ±SD
Mean ±SD
Mean ±SD
523 ±326
622 ±349
437 ±279
452 ±330 **
570 ±372 **
350 ±246 **
Consumers (%)
99.9
100
99.8
99.8
99.7
99.8
Consumer intake (g) #
523 ±326
622 ±349
438 ±278
453 ±329
571 ±371
350 ±246
Total milk (g)
424 ±307
517 ±335
343 ±254
368 ±309 **
479 ±353 *
272 ±225 **
98.7
99.2
98.3
97.3 *
98.2
96.5
429 ±305
521 ±333
349 ±252
378 ±307
488 ±350
281 ±223
205 ±297
269 ±362
149 ±212
153 ±260 **
223 ±18 **
92 ±176 **
55.0
55.1
54.9
48.7 **
53.4
44.7 **
373 ±313
488 ±361
273 ±221
314 ±298
419 ±329
206 ±214
150 ±253
167 ±267
136 ±238
138 ±240
160 ±285
118 ±191
Consumers (%) Consumer intake (g)
#
Regular milk (g) Consumers (%) Consumer intake (g) Reduced fat milk (g)
#
Nutrients 2012, 4
1801 Table 2. Cont.
Consumers (%) Consumer intake (g)
#
Skim milk (g)
42.2
40.9
43.4
42.8
39.8
45.3
357 ±279
410 ±276
314 ±274
323 ±274
403 ±326
262 ±207
17.6 ±85.9
20.8 ±98.8
14.8 ±72.9
23.8 ±101
19.9 ±97.8
27.2 ±104 *
Consumers (%)
6.3
6.0
6.5
9.5 **
7.3
11.5 **
Consumer intake (g) #
280 ±211
346 ±226
227±185
250 ±228
275 ±252
237 ±215
Milkshakes (g)
22.1 ±39.2
24.7 ±41.7
19.8 ±36.8
17.1 ±37.1 **
23.3 ±47.1
11.7 ±24.3 **
56.3
57.8
54.8
48.2 **
51.7
45.0 **
39.3 ±45.4
42.3 ±47.3
36.6 ±43.5
36.2 ±47.1
45.7 ±57.6
26.5 ±30.7
Flavored milk (g)
25.3 ±56.0
31.6 ±69.5
19.8 ±40.1
33.7 ±78.0 **
49.0 ±103 **
20.5 ±42.3
Consumers (%)
59.1
66.6
52.2
54.2
59.3
49.6
42.9 ±67.6
47.7 ±80.8
37.7 ±48.9
62.6 ±97.4
82.4 ±123
41.9 ±52.5
20.7 ±17.6
20.5 ±18.8
20.8 ±16.5
24.2 ±28.3 **
26.0 ±29.4 **
22.5 ±27.1
Consumers (%) Consumer intake (g)
Consumer intake (g)
#
#
Total cheese (g) Consumers (%)
98.4
98.5
98.3
96.0 **
96.7
95.4 *
Consumer intake (g) #
21.0 ±17.6
20.8 ±18.8
21.2 ±16.4
25.1 ±28.4
26.9 ±29.5
23.6 ±27.2
Regular cheese (g)
11.2 ±15.0
11.3 ±17.7
11.1 ±12.2
13.1 ±21.1 **
14.6 ±21.6 **
11.9 ±20.5
75.7
74.4
76.8
72.3 **
73.2 **
71.6 **
13.5 ±14.5
14.6 ±17.2
12.5 ±11.8
18.2 ±22.9
20.0 ±23.1
16.6 ±22.6
6.52 ±10.9
5.85 ±9.40
7.09 ±11.9
7.72 ±17.1 *
7.19 ±16.4
8.19 ±17.7
47.6
45.6
49.2
43.4 *
38.1 *
47.9
Consumers (%) Consumer intake (g)
#
Reduced fat cheese (g) (including cottage cheese) Consumers (%) Consumer intake (g)
#
9.4 ±12.7
8.5 ±10.6
10.0 ±14.2
17.8 ±22.3 **
18.9 ±22.2 **
17.1 ±22.5 **
Cheese from pizza (g)
2.7 ±2.6
3.0 ±3.0
2.4 ±2.2
3.0 ±4.2 **
3.9 ±5.3 **
2.3 ±2.8
Consumers (%)
86.5
87.0
86.1
81.7 **
86.7
77.4 **
3.1 ±2.6
3.4 ±2.9
2.7 ±2.2
3.7 ±4.4
4.5 ±5.5
3.0 ±2.8
Total yoghurt (g)
50.5 ±62.9
52.9 ±66.2
48.4 ±59.9
35.5 ±59.2 **
36.0 ±60.3 **
35.0 ±58.4 **
Consumers (%)
73.6
71.9
75.1
60.5 **
58.6 **
62.0 **
68.7 ±64.3
73.6 ±67.6
64.5 ±61.2
58.7 ±66.6
61.5 ±68.1
56.5 ±65.4
Consumer intake (g)
Consumer intake (g)
#
#
Nutrients 2012, 4
1802 Table 2. Cont.
Regular yoghurt (g)
16.9 ±43.5
18.3 ±49.1
15.7 ±38.1
12.7 ±42.7 *
16.5 ±48.6
9.36 ±36.5 **
26.6
25.8
27.3
21.2 **
26.1
16.9 **
63.6 ±64.6
70.9 ±75.2
57.6 ±53.9
60.1 ±76.1
63.6 ±78.2
55.3 ±73.4
Reduced fat yoghurt (g)
33.4 ±56.5
34.3 ±56.8
32.6 ±56.3
22.7 ±47.6 **
19.2 ±43.6 **
25.7 ±50.6 *
Consumers (%)
46.5
45.4
47.5
39.1 **
32.3 **
44.9
#
71.8 ±64.2
75.6 ±63.3
68.7 ±64.8
58.1 ±61.1
59.5 ±59.2
57.2 ±62.4
a
Dairy from milk dishes (g)
3.2 ±8.1
3.7 ±9.7
2.7 ±6.384
2.6 ±7.8
3.3 ±9.5
1.9 ±6.00
Consumers (%)
31.2
34.1
28.6
22.9 **
25.3 **
20.8 **
10.2 ±11.8
10.9 ±4.0
9.46 ±8.87
11.2 ±13.1
12.9 ±15.2
9.35 ±10.2
17.6 ±15.1
18.8 ±14.8
16.4 ±15.3
12.4 ±13.9 **
14.1 ±16.1 **
11.0 ±11.5 **
Consumers (%) Consumer intake (g)
Consumer intake (g)
Consumer intake (g)
#
#
Total ice cream (g) Consumers (%)
96.1
96.9
95.4
88.1 **
87.4 **
88.8 **
#
18.2 ±14.9
19.4 ±14.5
17.1 ±15.2
14.1 ±13.9
15.9 ±16.2
12.5 ±11.5
Regular ice cream (g)
15.3 ±14.6
16.3 ±14.4
14.5 ±14.9
10.9 ±13.6 **
12.8 ±15.8 **
9.34 ±11.1 **
Consumers (%)
94.5
95.7
93.5
85.6 **
85.5 **
85.7 **
16.2 ±14.6
17.0 ±14.3
15.5 ±14.8
12.8 ±13.9
14.9 ±16.1
10.9 ±11.2
2.3 ±6.9
2.6 ±7.2
2.0 ±6.6
1.5 ±4.1 **
1.3 ±4.3 **
1.7 ±3.8
Consumer intake (g)
Consumer intake (g)
#
Reduced fat ice cream (g) Consumers (%)
27.6
27.3
27.8
28.6
23.3
33.2
Consumer intake (g) #
8.3 ±11.1
9.4 ±11.3
7.3 ±10.9
5.3 ±6.1
5.6 ±7.5
5.1 ±5.1
Butter (g)
4.8 ±10.5
5.5 ±11.6
4.2 ±9.5
7.2 ±12.1 **
8.8 ±14.6 **
5.7 ±9.3 **
21.2
22.6
20.0
36.7 **
38.1 **
35.6 **
22.5 ±11.1
24.3 ±11.5
20.8 ±10.4
19.5 ±12.6
23.2 ±15.0
16.1 ±8.7
0.9 ±2.3
0.9 ±2.1
0.9 ±2.5
0.8 ±4.0
0.8 ±5.4
0.7 ±2.1
34.9
35.6
34.3
24.5 **
23.6 **
25.4 **
2.7 ±3.3
2.6 ±2.9
2.7 ±3.7
3.2 ±7.6
3.6 ±10.7
2.8 ±3.3
Custard (g)
4.9 ±12.1
6.5 ±15.2
3.4 ±8.3
3.8 ±11.4 *
4.8 ±13.5
2.9 ±9.07
Consumers (%)
37.6
42.4
33.4
27.7 **
31.3 **
24.5 **
13.0 ±16.9
15.2 ±20.3
10.6 ±11.6
13.6 ±18.4
15.2 ±20.8
11.8 ±15.2
Consumers (%) Consumer intake (g)
#
Cream (g) Consumers (%) Consumer intake (g)
Consumer intake (g)
#
#
#
* P < 0.05 significant difference from 14 year, ** P < 0.01 significant difference from 14 year; Significance not calculated for consumer intake in grams as subjects differed between age categories; a Milk dishes refers to milk pudding and mornay dishes.
Nutrients 2012, 4
1803
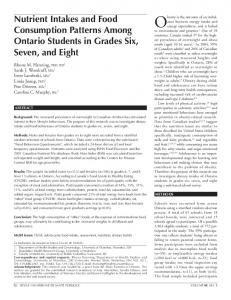
3.4. Intake of Dairy Products by Serves Figure 1 shows the mean intake of core and non-core dairy product serves per day for boys and girls from 14 to 17 years, compared with the recommended three serves per day for these age groups [33]. Girls at 17 years reported the lowest mean intake with 1.85 serves, followed by girls at 14 years with 2.17 serves. Boys at 14 years reported the highest intake with 2.92 serves, with boys at 17 years reporting 2.80 serves. Milk was the largest contributor to daily serves for both genders and age groups, followed by cheese and yoghurt. Non-core dairy products accounted for 1% or less of daily serves on a matched calcium basis. At 14 years, 21.5% of girls and 40.1% of boys met the 3 serves/day guideline. At 17 years, this decreased to 13.9% of girls and 36.6% of boys. Figure 1. Mean serves of dairy per day for girls and boys at 14 and 17 years, split by type. Core dairy products are milk (including flavoured milk and smoothies), yoghurt, cheese and custard. Non-core dairy products are butter, ice cream and cream adjusted to calcium serves of 300 mg. The dashed line represents the recommended minimum three serves a day guideline for adolescents [33].
3.5. Gender, BMI and SES as Predictors of Change in Dairy Intake Although both genders decreased mean daily dairy intake from 14 to 17 years, girls compared to boys reported greater decreases in total dairy (87 g vs. 52 g, P = 0.13), reduced fat dairy intake (13 g vs. 7 g, P = 0.78) and regular fat dairy intake (75 g vs. 45 g, P = 0.13). Dairy intake decreased from 14 to 17 years across all weight status categories. Adolescents who were overweight significantly decreased their intake by an average of 190 g between 14 and 17 years of age (P = 0.048). Boys who were underweight or normal weight were the only ones to show an increase in dairy (reduced fat), and this was significantly increased compared with the obese group (P = 0.044) (Figure 2). No significant
Nutrients 2012, 4
1804
differences over BMI categories were observed for girls. There were also no statistically significant differences in change in intake over SES category, although boys from the low SES areas were the only group to report a mean increase in dairy intake (reduced fat) (Figure 3). Figure 2. Mean change in grams of total, reduced fat and regular fat dairy in grams per day in Raine Study participants from 14 to 17 year follow-ups, split by body mass index (BMI) categories at 14 years [28,29]. Underweight
Normal Weight
Overweight
Obese
Mean change in grams per day
100
50
0
-50
-100
-150
-200 Boys Change in Reduced Fat Dairy
Boys Change in Regular Fat Dairy
Girls Change in Reduced Fat Dairy
Girls Change in Regular Fat Dairy
Figure 3. Mean change in grams of total, reduced fat and regular fat dairy in grams per day in Raine Study participants from 14 to 17 year follow-ups, split by socioeconomic status (SES) at 14 years as determined by Socio-Economic Indexes for Areas [30].
Mean change in grams per day
100
SES
SES
SES
Low
Med
High
80 60 4 0 2 00
-2 -04 -06 -08
0 -10 0
Boys Change in Reduced Fat Girls Change in Reduced Fat
Boys Change in Regular Fat Girls Change in Regular Fat
Nutrients 2012, 4
1805
4. Discussion Results of our study indicate that on average, adolescents decrease their dairy intake from 14 to 17 years. As a consequence, our findings suggest that nutrient intakes are less than optimal during the important adolescent growth period. Based on an average serve of dairy contributing 300 mg of calcium, from our study results we estimate that dairy products contribute 65% of calcium intake for girls and 68% for boys at 14 years, decreasing slightly to 61% for girls and 65% for boys at 17 years. The majority of our adolescents did not meet the RDIs for calcium and magnesium at 14 years, and this situation worsened as they became older. Suboptimal calcium intake has been previously identified in Australian adolescents [21,37], with girls showing lower intakes than boys [21]. Our results are also similar to a longitudinal study conducted in the United States, which showed that teenagers reduced their calcium intake from the ages of 16 to 21, particularly females [38]. These findings are of concern for both genders, as adequate calcium intake during adolescence is important for bone growth, development and for reducing the risk of bone fractures during adolescence, as well as laying the foundation for bone health later in life [10,39–41]. Females in particular are at risk of osteoporosis and hip fracture, due to the loss of the bone protective factor oestrogen during menopause and older age [1,39]. In addition to calcium being of concern, magnesium is also an important nutrient as a cofactor for over 300 enzymes involved in metabolism of food and synthesis of metabolic products [42]. Associations have been found between magnesium deficiency and insulin resistance in obese children [43], and there are links with osteoporosis [11,44] and diabetes [42,45]. The link with insulin resistance and diabetes is thought to be related to the use of magnesium in carbohydrate metabolism [42]. Magnesium is thought to contribute to bone health through affects on parathyroid hormone secretion, with low intakes of magnesium leading to lower parathyroid hormone and a decrease in serum 1,25 dihydroxy vitamin D3, resulting in altered hydroxyapitite crystal formation and impaired bone health [42]. In our cohort, mean intakes for dairy products fell short of the recommended three serves per day [33] for girls at both age groups, with boys closer to but still less than three. Our figures of between 14% and 22% of girls and 37% and 40% of boys meeting recommendations supports previously reported figures of 17% for girls and 38% of boys in the Australian adolescent population overall [46]. Depending upon an individual’s activity level and energy requirements, some adolescents, particularly boys, may benefit from up to five serves of dairy per day [33]. We observed in our study that lower milk consumption was responsible for the largest decrease as the adolescents grew older. Total dairy intake, and that of most dairy products, decreased from 14 to 17 years for both boys and girls. The exceptions were cheese and butter, which increased significantly over this period. To compare our results with other Australian research, the 1995 National Nutrition Survey reported cheese intake along with butter/dairy fat intake was higher in 16–18 years old compared with 12–15 years old [47], although the total dairy category of milk products and dishes was also shown to be higher in the older age group. The National Nutrition Survey is an older study and therefore it is possible there has been some change in habits and eating patterns since the time of data collection. The more recent Child and Adolescent Physical Activity and Nutrition Survey of Western Australia surveyed primary and secondary school students in 2003 and 2008, and found the proportion of
Nutrients 2012, 4
1806
students consuming milk products and dishes decreased from primary to secondary school, and from 2003 to 2008, significantly so for girls [21]. These results are similar to our findings, although this survey used a different group of adolescents at each time point (2003 and 2008), whereas our study followed the same adolescents. The 2007 Australian National Children’s Nutrition and Physical Activity Survey also showed gender differences. Total milk intake was lower in girls in the 14–16 year age group compared to the 9–13 age group, but the opposite was reported for boys [24]. This survey also showed mean intake of flavoured milk was higher in older boys, similar to the trend we observed in our adolescents. This trend may be due in part to marketing campaigns targeting the male audience, and the increasing overall popularity of flavoured milk (usually fat reduced), particularly iced coffee [48]. We found in the Raine Study that boys from the low SES areas were the only group to report a mean increase in dairy intake. We postulate that boys from lower SES backgrounds may be more likely to drop out of school and enter apprenticeships as blue collar workers [49], and tradesmen may have more of a culture of consumption of flavored milks like iced coffee. An Australian product development company refers to market research describing the primary consumers of iced coffee as stalwart tradesman who would consume several cartons daily, often referring to it as ―daytime beer‖ [50]. In terms of predicting change in dairy intake from 14 to 17 years, our results showed that weight category was a significant predictor. Adolescents who were overweight at 14 years were more likely to have decreased their dairy intake at 17 years, by an average of 190 g/day. Decreasing dairy intake may be a result of trying to lose weight, particularly in girls [20,51]. The category of underweight boys was the only weight category to increase consumption from 14 years, and this may reflect trying to build body mass or a lack of concern over weight gain related to dairy intake, whether this stigma is justified or not. Recent evidence suggests that it is not justified, with a review of prospective cohort studies suggesting that the consumption of dairy foods may actually reduce the risk of overweight, rather than increase [52]. The review found that three out of ten studies in children and adolescents showed protection against weight gain, with one suggesting an increased risk and six studies showing no association. In adults, a meta-analysis of randomized controlled trials found an overall negative association between weight gain and dairy intake which bordered significance, with the combination of increased dairy with energy restriction significantly associated with a decrease in weight [53]. Our study is unique as it follows the same large population based sample of adolescents from 14 years to 17 years to allow matched pairing of subjects for analysis of changes in dairy consumption over time. This study also provides valuable information for further studies of calcium intake and bone status in the same cohort. The FFQ method for analysing dietary intake has the advantage of being cost effective given the large subject group size and with a relatively low subject burden. A potential limitation of the CSIRO FFQ was that quantity information was generated from frequency data in relation to standard serve sizes. This required the respondent to consider their usual serve size in comparison to the standard given and then adjust the reported frequency accordingly, which may increase the risk of estimation error. Although the accuracy of FFQs can be of concern [54], the FFQ used has been validated in our Raine Study group with a three day food record [55]. The power of analyses investigating intakes by BMI and SES categories were limited by small numbers in some groups. Although Raine Study adolescents participating in dietary studies tend to have older mothers, higher family income or a lower BMI than the non-respondents [56], families who were involved in
Nutrients 2012, 4
1807
the study were more likely to be of middle to lower socioeconomic status initially [57], which may improve the generalisation of our results. 5. Conclusions Our findings identify a discernible gap between reported consumption and recommended nutrient and dairy product intake over the adolescent period, particularly for girls. Possible barriers for adolescents consuming dairy products may include lactose intolerance, changes in eating patterns with a changing lifestyle (for example skipping breakfast), and being conscious of their weight and body image. Increasing intake of dairy products will help improve intakes of a range of important nutrients, particularly calcium and magnesium that were especially lacking compared to recommended intakes in our subject group. A recent review identified taste exposure and prompting practice as important strategies utilised in effective interventions to increase calcium or dairy intake, along with concentrated delivery across a variety of settings [58]. Our results suggest that both girls and boys are reducing their intake of dairy foods at a time when calcium and other nutrient requirements are increased. Furthermore, the majority of adolescents are not meeting their calcium requirements at early adolescence, and this continues into later adolescence. Adolescence is considered an important time for physiological growth and prevention of future chronic disease such as osteoporosis [11,44] and diabetes [45]. Based on our findings, public health messages for this age group may benefit from promotion of a calcium rich food at every meal, such as dairy products. Non-dairy foods that are good sources of calcium include sardines and salmon (with bones), broccoli, nuts and seeds, and products fortified with calcium such as breakfast cereals, and soy beverages. It may be more beneficial to obtain calcium from food sources than supplements, due to suggestions that high dosage supplements may have health consequences such as kidney stones and artery calcification which could lead to heart disease [59]. Future research investigating reasons behind the decline we have observed in our population would help further inform public health campaigns addressed at improving healthy eating during adolescence. Acknowledgments The authors would like to extend their thanks to the Raine Study participants and their families, and also to the Raine Study team for cohort coordination and data collection. Also, the NH&MRC for long term contribution to funding over the last 20 years and the Telethon Institute for Child Health Research for ongoing support of the Study. Core management funding for the Raine Study is provided by: the University of Western Australia (UWA), the Telethon Institute for Child Health Research, the Raine Medical Research Foundation, the Faculty of Medicine, Dentistry and Health Sciences at UWA, Women and Infants Research Foundation and Curtin University. Funding for the 14 year follow-up was provided by NH&MRC (Sly et al., ID 211912), NH&MRC Program Grant (Stanley et al., ID 003209). Funding for the 17 year follow-up was provided by an NH&MRC Project Grant (Beilin et al. ID 403981) and Program Grant (Stanley et al., ID 353514). The Dairy Health and Nutrition Consortium Australia funded the analysis and write up of this study.
Nutrients 2012, 4
1808
Conflict of Interest The authors declare no conflict of interest. References 1. 2. 3. 4. 5.
6. 7.
8. 9. 10. 11. 12. 13. 14.
15. 16. 17.
Shils, M.S. Modern Nutrition in Health and Disease, 10th ed.; Lipponcott Williams & Wilkins: Philadelphia, PA, USA, 2006. Heaney, R.P. Dairy and bone health. J. Am. Coll. Nutr. 2009, 28, 81S–90S. Huncharek, M.; Muscat, J.; Kupelnick, B. Impact of dairy products and dietary calcium on bone-mineral content in children: Results of a meta analysis. Bone 2008, 2, 312–321. Lanou, A.J.; Berkow, S.E.; Barnard, N.D. Calcium, dairy products and bone health in children and young adults: A reevaluation of the evidence. Pediatrics 2005, 115, 736–743. Bischoff-Ferrari, H.A.; Dawson-Hughes, B.; Baron, J.A.; Kanis, J.A.; Orav, E.J.; Staehelin, H.B.; Kiel, D.P.; Burckhardt, P.; Henschkowski, J.; Spiegelman, D.; et al. Milk intake and risk of hip fracture in men and women: A meta-analysis of prospective cohort studies. J. Bone Miner. Res. 2011, 26, 833–839. Stipanuk, M.H. Biochemical, Physiological, and Molecular Aspects of Human Nutrition, 2nd ed.; Saunders Elsevier: St. Louis, MO, USA, 2006. Elwood, P.; Pickering, J.; Givens, D.; Gallacher, J. The consumption of milk and dairy foods and the incidence of vascular disease and diabetes: An overview of the evidence. Lipids 2010, 45, 925–939. National Health and Medical Research Council. Dietary Guidelines for Children and Adolescents in Australia; Commonwealth of Australia: Canberra, Australia, 2003. National Health and Medical Research Council. Dietary Guidelines for Australian Adults; Commonwealth of Australia: Canberra, Australia, 2003. Martin, A.D.; Bailey, D.A.; McKay, H.A.; Whiting, S. Bone mineral and calcium accretion during puberty. Am. J. Clin. Nutr. 1997, 66, 611–615. Kalkwarf, H.J.; Khoury, J.C.; Lanphear, B.P. Milk intake during childhood and adolescence, adult bone density and osteoporotic fractures in US women. Am. J. Clin. Nutr. 2003, 77, 257–265. Baroncelli, G.I.; Bertelloni, S.; Sordini, F.; Saggese, G. Osteoporosis in children and adolescents: Etiology and management. Paediatr. Drugs 2005, 7, 295–323. US Department of Human Services. Bone Halth and Osteoporosis: A Surgeons Report; US Department of Health and Human Services: Rockville, MD, USA, 2004. Sanders, K.M.; Nowson, C.A.; Kotowicz, M.A.; Briffa, K.; Devine, A.; Reid, I.R. Calcium and bone health: Position statement for the Australian and New Zealand Bone and Mineral Society, Osteoporosis Australia and the Endocrine Society of Australia. Med. J. Aust. 2007, 190, 316–320. Birch, L.L.; Fisher, J.O. Development of eating behaviors among children and adolescents. Pediatrics 1998, 101, 539–549. Kelder, S.H.; Perry, C.L.; Klepp, K.I.; Lytle, L.L. Longitudinal tracking of adolescent smoking, physical activity, and food choice behaviors. Am. J. Public Health 1994, 84, 1121–1126. Spear, B.A. Adolescent growth and development. J. Am. Diet. Assoc. 2002, 102, S23–S29.
Nutrients 2012, 4
1809
18. Siega-Riz, A.M.; Carson, T.; Popkin, B. Three squares or mostly snacks—what do teens really eat? A sociodemographic study of meal patterns. J. Adolesc. Health 1998, 22, 29–36. 19. 2007 Australian National Childrens Nutrition and Physical Activity Survey—Main Findings; Commonwealth of Australia: Canberra, Austrilia, 2008. 20. Neumark-Sztainer, D.; Story, M.; Dixon, L.; Resnick, M.D.; Blum, R.V. Correlates of inadequate consumption of dairy products among adolescents. J. Nutr. Educ. 1997, 29, 12–19. 21. Martin, K.; Rosenberry, M.; Miller, M.; French, S.; McCormack, G.; Bull, F.; Giles-Corti, B.; Pratt, S. Child and Adolescent Physical Activity and Nutrition Survey WA Final Report 2008: Key Findings; Western Australian Government: Perth, Australia, 2009. 22. Abbott, R.; Macdonald, D.; Stubbs, C.; Lee, A.; Harper, C.; Gedge, V.; Davies, P. The Healthy Kids Queensland Survey: Key findings. J. Sci. Med. Sport 2007, 10, 26. 23. NSW Centre for Overweight and Obesity. NSW School Physical Activity and Nutrition Survey (SPANS) 2004: Short Report; NSW Department of Health: Sydney, Austrilia, 2006. 24. Baird, D.L.; Syrette, J.; Hendrie, G.A.; Riley, M.D.; Bowen, J.; Noakes, M. Dairy food intake of Australian children and adolescents 2–16 years of age: 2007 Australian National Children’s Nutrition and Physical Activity Survey. Public Health Nutr. 2012, 15, 2060–2073. 25. Newnham, J.P.; Evans, S.F.; Michael, C.A.; Stanley, F.J.; Landau, L.I. Effects of frequent ultrasound during pregnancy: A randomised controlled trial. Lancet 1993, 342, 887–891. 26. Baghurst, K.I.; Recird, S.J. A computerized dietary analysis system for use with diet diaries or food frequency questionnaires. Community Health Stud. 1984, 8, 11–18. 27. Ambrosini, G.L.; de Klerk, N.H.; O’Sullivan, T.A.; Beilin, L.J.; Oddy, W.H. The reliability of a food frequency questionnaire for use among adolescents. Eur. J. Clin. Nutr. 2009, 63, 1251–1259. 28. Cole, T.J.; Bellizzi, M.C.; Flegal, K.M.; Dietz, W.H. Establishing a standard definition for child overweight and obesity world-wide: International survey. BMJ 2000, 320, 1240–1243. 29. Cole, T.J.; Flegal, K.M.; Nicholls, D.; Jackson, A.A. Body mass index cut offs to define thinness in children and adolescents: International survey. BMJ 2007, 335, 194–201. 30. Australian Bureau of Statistics SEIFA Socio-Economic Indexes for Areas. Available online: http://www.abs.gov.au (accessed on 20 February 2012). 31. The Trustees of the Home Economics Teachers Group; Baldwin, E.M.; Barrowman, E.M.; Cameron, S.; McDonnell, E.D.; Russell, S.M.; Williams, W.I. Cookery—The Australian Way; McMillan of Australia: Melbourne, Australia, 1967. 32. Taste Australia. Available online: http://www.taste.com.au/ (accessed on 20 April 2012). 33. National Health and Medical Research Council. The Australian Guide to Healthy Eating; Commonwealth of Australia: Canberra, Australia, 2003. 34. Australian Government; Department of Aging; National Health and Medical Research Council. Nutrient Reference Values for Australia and New Zealand: Including Recommended Dietary Intakes; NHMRC: Canberra, Australia, 2005. 35. Rockett, H.R.; Breitenbach, M.; Frazier, A.L.; Witschi, J.; Wolf, A.M.; Field, A.E.; Colditz, G.A. Validation of a youth/adolescent food frequency questionnaire. Prev. Med. 1997, 26, 808–816. 36. Lumley, T.; Diehr, P.; Emerson, S.; Chen, L. The importance of the normality assumption in large public health data sets. Ann. Rev. Public Health 2002, 23, 151–169.
Nutrients 2012, 4
1810
37. Portsmouth, K.; Henderson, K.; Graham, N.; Price, R.; Cole, J.; Allen, J. Dietary calcium intake in 18 year old women: Comparison with recommended daily intake and dietary energy intake. J. Adv. Nurs. 1994, 20, 1073–1078. 38. Larson, N.I.; Neumark-Sztainer, D.; Harnack, L.; Wall, M.; Story, M.; Eisenberg, M.E. Calcium and dairy intake: Longitudinal trends during transition to young adulthood and correlates of calcium intake. J. Nutr. Educ. Behav. 2009, 41, 254–264. 39. Ali, N.; Siktberg, L. Osteoporosis prevention in female adolescents: Calcium intake and exercise participation. Pediatr. Nurs. 2001, 27, 135–139. 40. Chan, G.M. Dietary calcium and bone mineral status of children and adolescents. Am. J. Dis. Child. 1991, 145, 631–634. 41. Cashman, K.D. Calcium intake, calcium bioavailability and bone health. Br. J. Nutr. 2002, 87, S169–S177. 42. Mahan, L.K.; Escot-Stump, S. Krause’s Food and Nutrition Therapy, 12th ed.; Saunders Elsevier Evolve: St. Louis, MO, USA, 2008. 43. Huerta, M.G.; Roemmich, J.N.; Kington, M.L.; Bovbjerg, V.E.; Weltman, A.L.; Holmes, V.F.; Patrie, J.T.; Rogol, A.D.; Nadler, J.L. Magnesium deficiency is associated with insulin resistance in obese children. Diabetes Care 2005, 28, 1175–1181. 44. Lunt, M.; Masaryk, P.; Scheidt-Nave, C.; Nijis, J.; Poor, G.; Pols, H.; Falch, J.A.; Hammermeister, G.; Reid, D.M.; Benevolenskaya, L.; et al. The effects of lifestyle, dietary dairy intake and diabetes on bone mineral density and vertebral deformity prevalence: The EVOS study. Osteoporosis Int. 2001, 12, 688–698. 45. Malik, V.S.; Sun, Q.; van Dam, R.M.; Rimm, E.B.; Willett, W.C.; Rosner, B.; Hu, F.B. Adolescent dairy product consumption and risk of type 2 diabetes in middle-aged women. Am. J. Clin. Nutr. 2011, 94, 854–861. 46. Doidge, J.C.; Segal, L. Most Australians do not meet recommendations for dairy consumption: Findings of a new technique to analyse nutrition surveys. Aust. N. Z. J. Public Health 2012, 36, 236–240. 47. McLennan, W.; Podger, A. National Nutrition Survey: Foods Eaten, Australia 1995; Commonwealth of Australia: Canberra, Australia, 1999. 48. Coffee kick: The undisputed champion of the flavoured milk world just keeps getting stronger. Convenience & Impulse Retailing, Sep/Oct 2009. Available online: http://www.c-store.com.au/ article-archive/2009-sept-oct-coffee-kick (accessed on 12 October 2012). 49. NCLS Research Profiling Australians: Blue-collar worker. Available online: http://www.ncls.org.au (accessed on 3 October 2012). 50. Outerspace Case Study: Farmers Union Iced Coffee Stubby. Available online: http://www.outer spacedesign.com/index.php?id=117 (accessed on 12 October 2012). 51. Packard, P.; Krugstrand, K.S. Half of rural girls aged 8–17 report concerns and dietary changes, with both more prevalent with age. J. Am. Diet. Assoc. 2002, 102, 672–677. 52. Louie, J.C.Y.; Flood, V.M.; Hector, D.J.; Rangan, A.M.; Gill, T.P. Dairy consumption and overweight and obesity: A systematic review of prospective cohort studies. Obes. Rev. 2011, 12, e582–e592.
Nutrients 2012, 4
1811
53. Abargouei, A.S.; Janghorbani, M.; Salehi-Marzijarani, M.; Esmaillzadeh, A. Effect of dairy consumption on weight and body composition in adults: A systematic review and meta-analysis of randomized controlled clinical trials. Int. J. Obes. 2012, doi:10.1038/ijo.2011.269. 54. Cade, J.; Thompson, R.; Burley, V.; Warm, D. Development, validation and utilisation of food-frequency questionnaires—a review. Public Health Nutr. 2002, 5, 567–587. 55. Ambrosini, G.L.; O’Sullivan, T.A.; de Klerk, N.H.; Movi, T.A.; Beilin, L.J.; Oddy, W.H. Relative validity of adolescent dietary patterns: A comparison of a food frequency questionnaire and a 3 day food record. Br. J. Nutr. 2011, 105, 625–633. 56. O’Sullivan, T.A.; Ambrosini, G.L.; Beilin, L.J.; Mori, T.A.; Oddy, W.H. Dietary intake and food sources of fatty acids in Australian adolescents. Nutrition 2011, 27, 153–159. 57. Li, J.; Kendall, G.E.; Henderson, S.; Downie, J.; Landsborough, L.; Oddy, W.H. Maternal psychosocial well-being in pregnancy and breastfeeding duration. Acta Paediatr. 2008, 97, 221–225. 58. Hendrie, G.A.; Brindal, E.; Baird, D.; Gardner, C. Improving children’s dairy food and calcium intake: Can intervention work? A systematic review of the literature. Public Health Nutr. 2012, doi:10.1017/S1368980012001322. 59. Bolland, M.J.; Grey, A.; Avenell, A.; Gamble, G.D.; Reid, I.R. Calcium supplements with or without vitamin D and risk of cardiovascular events: Reanalysis of the Women’s Health Initiative limited access dataset and meta-analysis. BMJ 2011, 342, d2040. © 2012 by the authors; licensee MDPI, Basel, Switzerland. This article is an open access article distributed under the terms and conditions of the Creative Commons Attribution license (http://creativecommons.org/licenses/by/3.0/).