J Neurophysiol 101: 969 –979, 2009. First published December 10, 2008; doi:10.1152/jn.91131.2008.
Changes in Locomotor Muscle Activity After Treadmill Training in Subjects With Incomplete Spinal Cord Injury Monica A. Gorassini,1 Jonathan A. Norton,3 Jennifer Nevett-Duchcherer,1 Francois D. Roy,1 and Jaynie F. Yang2 1
Department of Biomedical Engineering, 2Department of Physical Therapy, and 3Department of Surgery, Centre for Neuroscience, University of Alberta, Edmonton, Alberta, Canada
Submitted 9 October 2008; accepted in final form 1 December 2008
Gorassini MA, Norton JA, Nevett-Duchcherer J, Roy FD, Yang JF. Changes in locomotor muscle activity after treadmill training in subjects with incomplete spinal cord injury. J Neurophysiol 101: 969 –979, 2009. First published December 10, 2008; doi:10.1152/jn.91131.2008. Intensive treadmill training after incomplete spinal cord injury can improve functional walking abilities. To determine the changes in muscle activation patterns that are associated with improvements in walking, we measured the electromyography (EMG) of leg muscles in 17 individuals with incomplete spinal cord injury during similar walking conditions both before and after training. Specific differences were observed between subjects that eventually gained functional improvements in overground walking (responders), compared with subjects where treadmill training was ineffective (nonresponders). Although both groups developed a more regular and less clonic EMG pattern on the treadmill, it was only the tibialis anterior and hamstring muscles in the responders that displayed increases in EMG activation. Likewise, only the responders demonstrated decreases in burst duration and cocontraction of proximal (hamstrings and quadriceps) muscle activity. Surprisingly, the proximal muscle activity in the responders, unlike nonresponders, was three- to fourfold greater than that in uninjured control subjects walking at similar speeds and level of body weight support, suggesting that the ability to modify muscle activation patterns after injury may predict the ability of subjects to further compensate in response to motor training. In summary, increases in the amount and decreases in the duration of EMG activity of specific muscles are associated with functional recovery of walking skills after treadmill training in subjects that are able to modify muscle activity patterns following incomplete spinal cord injury.
Body-weight–supported treadmill training (BWSTT) is an effective treatment method for retraining walking in individuals with motor-incomplete spinal cord injury (iSCI). Intensive training leads to greater ability to walk on the treadmill with less assisted body-weight support, faster walking speeds, and better endurance (for review see Field-Fote 2000; Harkema 2001). Furthermore, improvements on the treadmill eventually transfer to increased gains in overground walking. Kinematically, training leads to better symmetry of steps (Field-Fote et al. 2005), less stride-to-stride variability (Grasso et al. 2004), more normal excursion in joints of the lower extremity (Barbeau and Blunt 1991; Barbeau et al. 1993), and a toe trajectory that is more similar to that of the uninjured (Barbeau et al. 1993; Grasso et al. 2004). Clinically, subjects require less assistance with walking, both in terms of personal assistance
and walking aids (Behrman and Harkema 2000; Wernig et al. 1995), and they show improved sitting and standing balance (Behrman and Harkema 2000; Dobkin et al. 2006). Improvements in walking are seen whether the training is in the acute (Dobkin et al. 2006; Grasso et al. 2004; Nymark et al. 1998) or chronic phase after injury (Wernig et al. 1995). Moreover, those who regain the ability to walk in the household or community maintain this improvement over several years and some continued to improve after training (Hicks et al. 2005; Wernig et al. 1998; Wirz et al. 2001). What are the neural mechanisms that bring about these walking improvements? Is the motor pattern reverting to an uninjured pattern or is the nervous system finding new solutions? Answers to these questions remain incomplete; however, studying the motor pattern through surface electromyography (EMG) has provided some answers. For example, qualitative reports on single subjects suggest better timing of muscle activation (Barbeau and Blunt 1991) and some reduction in cocontraction between antagonists (Dietz et al. 1994, 1998). Quantitative information exists for the gastrocnemius muscles, which show greater activation in the stance phase after training (Dietz et al. 1994, 1995). However, this change could be explained by the increasing ability of subjects to support more of their own body weight from pre- to posttraining (Dietz et al. 1994, 1995, 1998) since extensor EMG is responsive to the amount of weight-bearing, even in individuals with complete spinal cord injury (Harkema et al. 1997). In addition, these subjects were trained acutely after the injury, so spontaneous recovery could also have contributed to the increased EMG activity (Calancie et al. 2000). More recently, Grasso and colleagues (2004) reported that subjects show marked improvement in the endpoint trajectory of the toe during walking, but the muscle patterns that lead to this improvement are quite different from those seen in uninjured subjects walking under matched conditions (Ivanenko et al. 2003). Their interesting findings suggested that new motor patterns were learned during BWSTT. Perhaps different subjects find their own motor solutions that may not be similar to the uninjured or to other injured individuals. In the Grasso study, only composite EMG scores were reported (i.e., average change in amplitude ratios), so the training-induced changes in EMG activation in individual muscles and between subjects remain unclear.
Address for reprint requests and other correspondence: M. Gorassini, 513 HMRC, Centre for Neuroscience, University of Alberta, Edmonton, Alberta, Canada T6G 2S2 (E-mail:
[email protected]).
The costs of publication of this article were defrayed in part by the payment of page charges. The article must therefore be hereby marked “advertisement” in accordance with 18 U.S.C. Section 1734 solely to indicate this fact.
INTRODUCTION
www.jn.org
0022-3077/09 $8.00 Copyright © 2009 The American Physiological Society
969
970
GORASSINI, NORTON, NEVETT-DUCHCHERER, ROY, AND YANG
The purpose of this study was to quantify the changes in EMG activity from several major muscle groups in the lower extremity before and after training in a group of chronically (⬎0.8 yr) injured subjects, under walking conditions that were identical (i.e., matched for both walking speed and weightsupport). We sought to determine the changes in EMG amplitude, the timing of muscle activity, and the amount of cocontraction between antagonists. We also compared the frequency content of the EMG activity both before and after training—a measure that has not been compared in the past—to determine whether training has any effect on the degree of clonic activity during walking. Subjects were separated into two groups: those who gained functional improvements in overground walking ability (responders) and those who did not (nonresponders). To assess functional overground walking ability, we used the Walking Index for Spinal Cord Injury II (WISCI II) (Ditunno and Ditunno 2001), which was developed and validated for the SCI population. The WISCI II contains a larger number of discrete categories compared with that of other walking scales such as the modified Wernig scale (Hicks et al. 2005; Wernig et al. 1998) or the Hauser scale (Hauser et al. 1983). We also defined improvements in overground walking function as any increase in overground walking speed of ⬎0.06 m/s because this has recently been shown to be functionally relevant (Musselman 2007). Subjects who eventually showed clinical improvements in overground walking showed EMG patterns that were vastly different from those of uninjured controls and also displayed changes in amplitude and timing in distinct muscles TABLE
that were not observed in subjects that did not respond to training. METHODS
Subjects All experiments were carried out with the approval of the Human Research Ethics Board at the University of Alberta and with the written, informed consent of the subjects. Approval from a family physician was also obtained before each subject participated in the training. Our sample consisted of 19 subjects with incomplete spinal cord injury (iSCI) and 6 neurologically intact, control individuals (Table 1). Inclusion criteria for treadmill training were that subjects must have sustained damage to the spinal cord and have the ability to move at least one of the leg joints (American Spinal Injury Association [ASIA] Impairment Scale C and D; Ditunno et al. 1994). Exclusion criteria were 1) orthopedic problems that could affect walking ability; 2) bone density that was ⱕ30% of age-matched, noninjured subjects; 3) impaired mental capacity or severe depression; and 4) other medical contraindications to treadmill training (such as cardiovascular problems, pulmonary disorders, history of deep vein thromboses, etc.). In one subject (3M), who had an L1 lesion, data were excluded for the left tibialis anterior (TA) and soleus (SOL) due to lower motor neuron damage; however, the activity patterns in the remaining muscles were similar to those of other subjects before training, with no evidence of denervation activity (i.e., fibrillation potentials) in the raw EMG traces, so 3M was included in the analysis.
1. Demographic, injury, training, and experimental details for all iSCI and control subjects
Code/Sex
Age
Injury Level
1M 2M 3M 4M 5M 6M 7M 8F 9F 10M* 11M* 12M 13M 14M 15M 16M 17F 18M 19M 20F 21F 22F 23M 24M 25M
41 25 58 71 78 48 34 74 24 50 42 30 23 47 66 56 44 21 42 32 41 55 28 33 32
C3–5 T7/8 L1 T5–9 T4/5 C4–5 C1–3 T4–5 T10 C5–6 T11–12 C6 and T10 T4–5 C5/6 C5/6 C3 and C6 T2–4 C7 C3–4 N/A N/A N/A N/A N/A N/A
ASIA Score
Years Post Injury
C C C D D D D D C D C C C D C C C C C E E E E E E
0.8 1.8 3.0 0.8 2.0 10.0 0.8 7.4 1.0 28.2 1.2 3.8 0.9 20.0 5.0 1.5 1.0 1.0 1.0 N/A N/A N/A N/A N/A N/A
BWS, lbs (%BWS)
Belt Speed, m/s
Initial MMS (60 max)
Weeks Training
Initial
End
Initial
35 35 19 46 46 32 44 45 38 37 18 11 2 23 15 20 31 15 38 60 60 60 60 60 60
10 19 10 14 10 12 26 12 17 18 20 12 11 13 12 28 11 10 11 N/A N/A N/A N/A N/A N/A
50 (35%) 90 (32%) 150 (70%) 150 (73%) 20 (10%) 120 (50%) 20 (14%) 50 (32%) 60 (44%) 60 (50%) 110 (65%) 130 (70%) 80 (44%) 90 (55%) 110 (55%) 150 (75%) 70 (50%) 110 (70%) 120 (53%) 40% 40% 40% 40% 40% 40%
20 (14%) 30 (11%) 60 (28%) 60 (29%) 20 (10%) 60 (25%) 0 (0%) 60 (38%) 30 (22%) 30 (25%) 80 (47%) 100 (54%) 90 (50%) 50 (30%) 110 (55%) 150 (75%) 50 (36%) 90 (57%) 300 (44%) N/A N/A N/A N/A N/A N/A
0.22 0.45 0.36 0.54 0.36 0.36 0.22 0.22 0.22 0.45 0.63 0.36 0.36 0.22 0.22 0.22 0.22 0.22 0.13 0.7 0.7 0.7 0.7 0.7 0.7
End
WISCI II Pre–Post (diff)
Overground Speed, m/s Pre–Post (diff)
0.36 0.36 0.54 0.54 0.72 0.36 0.59 0.27 0.45 0.54 0.63 0.54 0.72 0.22 0.27 0.36 0.31 0.45 0.31 N/A N/A N/A N/A N/A N/A
8–13 (5) 12–16 (4) 1–3 (2) 4–8 (4) 13–19 (6) 12–16 (4) 6–19 (13) 13–13 (0) 6–9 (3) 9–9 (0) 0–4 (4) 0–0 5–5 9–9 0–0 0–0 9–9 9–9 0–0 20 20 20 20 20 20
0.05–0.28 (0.23) 0.34–0.53 (0.19) N/T N/T 0.65–0.78 (0.13) 0.57–0.60 (0.03) 0.33–1.20 (0.87) 0.10–0.16 (0.06) 0.15–0.32 (0.17) 0.8–1.1 (0.3) N/T 0.0–0.0 (0.0) N/T 0.11–0.10 (⫺0.01) 0.0–0.0 (0.0) 0.0–0.0 (0.0) 0.14–0.18 (0.04) N/T 0.0–0.0 (0.0) N/A N/A N/A N/A N/A N/A
Responders are in white columns, nonresponders in light gray (12M–19M), and controls in dark gray (20F–25M). All iSCT subjects sustained trauma to the spinal cord except for subjects 8F and 17F, where damage occurred due to transverse myelitis and a surgical bleed, respectively. Subject 9F also sustained a head trauma. Subject 7M performed overground training two to three times a week in the last 4 mo of training. ASIA scores (Ditunno et al. 1994) include global sensory and motor scores from all body segments below the lesion. “Years Post Injury,” the time between the injury and the onset of training, is indicated. MMS, the initial manual muscle strength; BWS, body weight support. The initial BWS and belt speed were used at each EMG testing session. The end BWS and belt speed were the values used during the final training sessions. N/A, not applicable; N/T, not tested. *indicates subjects included in clonic analysis only. J Neurophysiol • VOL
101 • FEBRUARY 2009 •
www.jn.org
TRAINING-INDUCED CHANGES IN EMG AFTER SCI
Training Training consisted of 1 h/day of partial BWSTT, as described elsewhere (Thomas and Gorassini 2005). The target frequency was 5 days/wk; on average, subjects trained 3.3 ⫾ 1.3 (SD) days/wk for an average of 14 ⫾ 6 wk. Training continued until subjects reached a plateau in walking function, which was defined as a lack of change in overground walking ability or speed (see Clinical assessment in the following text). In subjects in whom no improvements were seen, training lasted for a minimum of 10 wk. For subject 7M, two to three treadmill sessions/wk were replaced with overground training for the last 4 wk. Briefly, each training session consisted of body-weight support (BWS) combined with manual assistance of leg movements while the subject walked on a motorized treadmill. Depending on the need, one or two people were positioned at the lower limbs to provide stepping assistance by lifting the foot through swing, flexing the knee at the start of swing, and/or stabilizing the knee during stance. A bungee cord tied to the harness and the support frame was sometimes used to help stabilize the subject’s trunk; in other cases, a trainer manually stabilized the trunk. Features of stepping, such as base of support, weight shift between the two legs, step length, postural alignment, hip extension at the end of stance, and foot contact during stance (heel to toe), were monitored by the therapist to ensure subjects stepped as efficiently and safely as possible. Subjects were encouraged to swing one or both of their arms when possible. If arm swing resulted in instability of the body, subjects were allowed to grasp horizontal bars positioned at chest level on each side to aid in balance control, but not for weight-bearing. Subjects walked at a slow pace, between 0.2 and 0.6 m/s (0.5–1.4 mph), enabling them to concentrate on voluntarily activating their muscles during walking. Rests were taken when needed, but subjects were encouraged to walk/rest at close to 10-min intervals. The amounts of body-weight support and/or stepping assistance were gradually decreased and the treadmill speed was increased when the physical therapist noticed improvements in cardiovascular tolerance, better ability to volitionally control the limbs, smooth weight transition between limbs, and better upright trunk alignment. The responders decreased the amount of BWS by 39.1 ⫾ 32.7 lbs on average, compared with the nonresponders who decreased the amount of BWS by only 15.0 ⫾ 16.9 lbs (P ⫽ 0.07; see Table 1 for individual values). The average increase in walking speed at the end of training compared with the start of training was similar between the two groups (responders, 0.12 ⫾ 0.15 m/s vs. nonresponders, 0.15 ⫾ 0.11 m/s; P ⫽ 0.61; Table 1). The average amount of time that a responder walked during a training session also increased from 25.4 ⫾ 11.2 to 36.2 ⫾ 11.4 min with the nonresponders increasing from 14.6 ⫾ 11.3 to 29.8 ⫾ 9.2 min (average differences not significant, P ⫽ 0.4). The amount of assistance given by the physical therapists was not systematically documented in all subjects.
Clinical assessments Clinical assessments of walking function were performed by experienced physiotherapists. Functional overground walking ability was assessed by the WISCI II, a 21-point ordinal scale that incorporates the use of aids required to achieve the walking function (Ditunno and Ditunno 2001). As in our previous study (Norton and Gorassini 2006), we separated subjects who did not show an improvement in WISCI II score (nonresponders) from those who did (responders). In addition, subjects that increased their walking speed by ⱖ0.06 m/s were also considered to be responders because this increment is considered functionally relevant (Musselman 2007). Manual muscle strength (MMS) was assessed by experienced physiotherapists who used the qualitative MRC scale (Medical Research Council 1976) to assess the strength of the major muscle groups in the leg (hip, knee, and ankle flexors and extensors, 5-point maximum per muscle group). The maximum score obtainable with this method is 60 (6 muscles per J Neurophysiol • VOL
971
leg ⫻ 2 legs ⫻ 5 points per muscle ⫽ 60). Subjects were also classified using the ASIA classification scale (Ditunno et al. 1994). All participants in this study were classified as either ASIA C or D (Table 1).
EMG assessment Irrespective of the length of the training program, comparisons of EMG activity while walking on the treadmill were made between the start and end of the treadmill training period using the initial (pretrain) BWS and treadmill belt speed values for each subject (Table 1). EMG activity was also measured in six uninjured control individuals who walked on the treadmill at the average walking speed (0.3 m/s) and BWS (40%) of the iSCI subjects. In the control subjects, test/retest reliability of the EMG measures was established by using two instances of walking on a treadmill separated by at least 1 wk in which subjects did not alter their exercise routine, to avoid any novel training effects. EMG measurements were also made while controls walked at a more natural speed (0.9 m/s) for comparison. In both iSCI and controls, EMG activity from ⱖ30 steps was recorded bilaterally from the tibialis anterior (TA), soleus (SOL), hamstrings (HAM), and quadriceps (QUAD) muscles using isolated EMG amplifiers (Octopus, Bortec Technologies, Calgary, Alberta, Canada). Signals were recorded using bipolar surface electrodes (Kendall H59P, Tyco Electronics, Worchester, MA) and were amplified (⫻500 –1,000) and filtered (band-pass 10 –1,000 Hz) before being stored on a PC using a Digidata1200 AD card and Axoscope software (Axon Instruments/ Molecular Devices, Sunnyvale, CA). All data were sampled at a rate of 5 kHz. Changes in knee angle during stepping were recorded with an electrogoniometer (Biometrics, Ladysmith, VA). Data from muscles on the right and left legs in a single subject were considered to be independent because of the asymmetry in lesion location in all subjects.
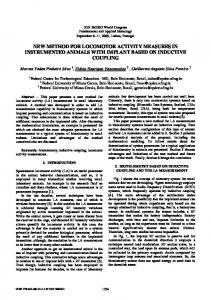
Peak and total EMG activity Peak and total EMG activity were analyzed in 17 subjects (1M–9F, 12M–19M) using custom-written software within the Matlab programming environment (The MathWorks, Natick, MA). The EMG signals were first rectified and then smoothed using a 150-ms sliding average (Fig. 1A). These data were then resampled at 50 Hz. The knee angle was used to estimate the start and end of each step. To obtain the amount of peak EMG activity reached during each step, the maximum and minimum values in the rectified and smoothed EMG were automatically determined. The minimum values were used to characterize the level of background EMG (noise) in each step and were subsequently subtracted from the maximum EMG value to obtain a measure of peak EMG activation in each step. The peak EMG value for each step was then averaged across all steps for a given experiment. The total EMG area was calculated by summing all the points within a step after subtracting the mean level of background EMG (or noise). Likewise, the total EMG area for each step was averaged across all steps.
EMG burst duration and area To quantify the percentage of time that a muscle was active during a step cycle (EMG burst duration), the data were first normalized to the step length (with each step having 100 points; Fig. 1B). The onset and end of the EMG burst were estimated by visual inspection of the normalized recordings (see dashed vertical lines in Fig. 1B) and were expressed as a percentage of the total step cycle (out of 100%). The EMG burst area was calculated by summing all points within the delineated burst after subtracting the background EMG, then averaging across all steps. In some muscles (n ⫽ 3), it was not possible to measure the onset or end of the EMG burst due to contact artifact in the EMG signal.
101 • FEBRUARY 2009 •
www.jn.org
972
GORASSINI, NORTON, NEVETT-DUCHCHERER, ROY, AND YANG
the associated r value. This normalized value (1 indicating no spread and 0 indicating no clustering) was used to determine whether stepping became more regular after training.
Clonus To determine whether treadmill training had any effect on the amount of clonic EMG activity before and after training, customwritten scripts within the Matlab environment were used to rectify the data and apply a fast Fourier transform. The power in the 7.2- to 8.8-Hz band was then calculated per unit time (Hidler et al. 2002) for the four muscles of each leg during a walking trial (data with contact artifact were excluded). For each subject, we averaged the power spectrum of all eight muscles together because there was not a statistical tendency for any particular muscle group to be any more clonic (contain appreciable power in the ⬃7- to 9-Hz range) than other muscle groups. Data from two additional subjects (10M and 11M, both responders) were included in the clonic EMG analysis (Table 1). Power in the clonic frequency band was also measured from EMG activity generated during treadmill walking in the six uninjured control individuals in the same manner as for the iSCI subjects.
Statistics
FIG. 1. A: for each step cycle (as determined from the knee angle) the minimum value of the rectified and smoothed electromyograph (EMG) was subtracted from the maximum value (dashed horizontal lines) to calculate the peak EMG activity for that step. The peak EMG values were then averaged for a given stepping trial. B: to calculate burst duration, the step cycle was first normalized to 100% and the time of onset of the burst was subtracted from the time at the end of the burst (vertical dashed lines) for each step. The burst duration values were then averaged for a given stepping trial. To calculate burst area, the points within the burst were summed. The amount of cocontraction was measured as the percentage of time in the step cycle a pair of antagonist muscles (tibialis anterior/soleus [TA/SOL] and hamstrings/quadriceps [HAM/QUAD]) were active at the same time.
Cocontraction Cocontraction occurred when antagonistic muscles (TA and SOL or HAM and QUAD) were both active at the same time in the step cycle (see Fig. 1B). Again, the duration of cocontraction between two antagonist pairs of muscles was expressed as a percentage of the total step cycle (100%) and values for each step were averaged for a given experiment.
Variability of muscle on and off times Because the on or off time of an EMG burst can cross the boundary of a step cycle that is delineated by the knee angle data, we used circular statistics to assess the variability in on and off times for each muscle burst. Using this approach, the on or off time of a particular EMG burst was plotted on the edge of a unit circle at an angle indicating the point in the step cycle that the muscle becomes active or inactive (see Fig. 6A). This process was repeated both before and after training for each muscle on and off time. To measure the degree of spread of the points (i.e., the angular dispersion), the length of the mean vector (r) was calculated, which is represented as the distance from the origin of the circle to the center of mass of the points (Zar 1999). In the example shown in Fig. 6A, a selection of onset times for a muscle is plotted on a circular measure of the gait cycle along with J Neurophysiol • VOL
Statistical analysis was performed using SigmaPlot 8.0 for Windows (SPSS, Chicago, IL) and Matlab. For normally distributed data, statistical analysis was performed using paired Student’s t-test to compare parametric data within groups. Wilcoxon tests were used for nonparametric and nonnormally distributed data and the unpaired Student’s t-test was used to compare parametric data between responders and nonresponders, responders, and controls or nonresponders and controls. When a Wilcoxon test was used, it is stated in the text; otherwise, Student’s t-tests were used. In all cases a significance level of 95% was considered to be statistically significant and all data are given as means ⫾ SD. RESULTS
Changes in walking function The responder group (subjects 1–9, Table 1) was comprised of four ASIA C and five ASIA D subjects, whereas the nonresponder group (subjects 12–19) had seven ASIA C and only one ASIA D subject. Likewise, the responders had initial MMS scores for the leg (38 ⫾ 9) that were twofold greater than those of the nonresponders (19 ⫾ 11, P ⬍ 0.01, Wilcoxon test; see Table 1 for individual values). The average time from the injury date to the start of training was lower in the responders compared with the nonresponders (3.1 ⫾ 3 vs. 4.3 ⫾ 7 yr, respectively), although the difference was not significant (P ⬎ 0.6) and the number of weeks during which subjects were trained (responders, 14.4 ⫾ 5 wk; nonresponders, 13.5 ⫾ 6 wk; P ⬎ 0.7) was also similar. The speed of the treadmill belt at which the testing was carried out was higher in the responders (0.33 ⫾ 0.12 m/s) compared with that in the nonresponders (0.24 ⫾ 0.08), but the difference did not reach significance (P ⫽ 0.11). However, the nonresponders did use a greater amount of percentage BWS during testing compared with that of the nonresponders (40 ⫾ 22% responders vs. 59 ⫾ 11% nonresponders; P ⫽ 0.04). The average improvement in the WISCI II score for the responders was 4.6 points (from 8.3 ⫾ 4 to 12.9 ⫾ 5; P ⬍ 0.01, Wilcoxon test) with an average increase in overground walking speed of 0.24 m/s (from 0.31 ⫾ 0.3 to 0.55 ⫾ 0.4 m/s; P ⬍ 0.05, Wilcoxon test). Nonresponders had no increases in WISCI II scores and an
101 • FEBRUARY 2009 •
www.jn.org
TRAINING-INDUCED CHANGES IN EMG AFTER SCI
average increase in walking speed of ⬍0.06 m/s, given that many did not walk overground before or after training (from 0.04 ⫾ 0.07 to 0.05 ⫾ 0.08 m/s; P ⫽ 0.58, Wilcoxon test). EMG activation in responders, nonresponders, and controls Responders showed greater EMG activity during BWS treadmill walking prior to training compared with the nonresponders. Typical results are presented in Fig. 2 (gray lines, pretraining), which demonstrates that responders (left column) started out with greater EMG activity compared with that of nonresponders (middle column), especially in the TA and HAM muscles for these two subjects. The amount of TA and SOL EMG activation in the responder is comparable to the amount generated in the control subject walking at a similar speed (0.3 m/s) and BWS (40%, right column), but the amount of HAM and QUAD activity is greater in the iSCI subjects, especially in the responder. In addition, the amount of EMG activity generated during treadmill walking increased substantially in the responder after training (Fig. 2, black traces), especially in the TA and HAM muscles, in contrast to the nonresponder whose EMG profiles (except for HAM) did not change appreciably in response to training. Peak EMG activation As a group, the amount of peak EMG activation in the responders increased significantly for the TA and HAM muscles (Fig. 3A, P ⬍ 0.05; Table 2) but not for the SOL and QUAD muscles in response to training. In fact, the average peak EMG activation in TA and HAM after training was greater than the average values measured in the controls walking at 0.3 m/s, as represented by the solid horizontal lines in Fig. 3 (TA: P ⬍ 0.05; HAM: P ⬍ 0.01). The amount of SOL peak EMG activation did not change after training and was slightly higher than that in controls (P ⫽ 0.07), in contrast to the QUAD values, which were much higher than those in controls both before (P ⫽ 0.0001) and after (P ⫽ 0.02) training. In the nonresponders (Fig. 3B), the initial peak EMG
973
activation for all muscles was about half of that seen in the responders, with SOL and HAM values closer to those of the controls. Following training, there were small to negligible increases in peak EMG activation in the nonresponders (Table 2), although none was statistically significant. Similar trends occurred for total and burst EMG activation in a step cycle for both responders and nonresponders (see Total Area and Burst Area, Table 2). EMG values for controls walking at a more natural speed (0.9 m/s) are also shown in Table 2 for comparison. EMG burst duration In addition to changes in the amplitude of EMG activity with treadmill training, there were also changes in the timing of EMG activity measured in the responders. For example, the percentage of time that a muscle was active in the step cycle (burst duration; see METHODS) was reduced in some muscles following training, even though the treadmill speed was kept constant. There was a significant decrease in burst duration for the QUAD muscle after training and a strong trend to decrease in the HAM muscle (Fig. 4A, Table 2). After training, the duration of HAM and QUAD burst activity decreased, to reach amounts that were closer to values in the controls, whereas the TA and SOL burst durations remained below and above control values, respectively. In contrast, the burst duration times did not change with training in the nonresponders, although there was a nonsignificant decrease in the burst duration of the QUAD muscle after training (P ⫽ 0.14; Fig. 4B, Table 2). Note that the large variability in the burst duration for the HAM and QUAD muscles in the control subjects was due to the fact that the burst duration could vary by as much as 50% of the step cycle between subjects. This variability in timing was likely of little functional consequence because the amplitude of HAM and QUAD activation is very low in the noninjured (Fig. 3). This is also in agreement with the low levels and high variability of muscle moments about the knee reported by others for walking in noninjured subjects (Winter 1991).
FIG. 2. EMG activity from the TA, SOL, HAM, and QUAD muscles recorded during treadmill walking from a responder (left column) and nonresponder (middle column) both before (gray lines) and after (black lines) treadmill training. Knee angle is shown in the bottom trace and the onset of the swing is shown as an upward deflection in the knee angle. Example EMG recording in a control individual is shown in the right column. All EMG signals are displayed on the same y-axis scale.
J Neurophysiol • VOL
101 • FEBRUARY 2009 •
www.jn.org
974
GORASSINI, NORTON, NEVETT-DUCHCHERER, ROY, AND YANG
FIG. 3. Summary of the changes in peak EMG activation. A: responders: changes in peak EMG activity before (gray bars) and after (black bars) training. The numbers in the bottom right of each graph represent the number of muscles included in each average. Solid and dashed horizontal lines represent mean and ⫾SD values, respectively, for the control group. B: nonresponders. Same format as in A (*P ⬍ 0.05).
Cocontraction We also examined the amount of time during which there was coincident activity in muscles traditionally defined as antagonists (TA/SOL and HAMS/QUADS), a measure of cocontraction (see METHODS). In responders, there was a greater amount of cocontraction in TA/SOL and HAM/QUAD compared with that in controls (P ⬍ 0.05; Fig. 5A). In controls, there was a large degree of variability in HAM/QUAD cocontraction because, at the 0.3 m/s walking speed, HAM activity occurred either in the stance or swing phase with QUAD activity occurring mainly in the stance phase. In iSCI subjects, HAM activity mainly occurred in the stance phase alongside
the QUAD activity. After training, as a group there were no net changes in cocontraction in the responders given that half of the muscle pairs increased and half of the muscle pairs decreased in cocontraction. Of note, in 6 of the 13 HAM/QUAD muscle pairs examined, a decrease in cocontraction of ⬎15% of the total step cycle occurred after training. An example of a decrease in HAM/QUAD cocontraction for a responder subject is shown in Fig. 5C, whereas an example of a HAM/QUAD increase in cocontraction is shown for the responder subject in Fig. 2. The amount of cocontraction for both TA/SOL and HAM/QUAD in the nonresponders (Fig. 5B) was lower compared with that in responders and more similar to control
2. Data summarizing EMG analysis for responders, nonresponders (before and after training), and control subjects (walking at 0.3 and 0.9 m/s for comparison)
TABLE
Peak EMG, V Subjects Responders TA SOL HAM QUAD Nonresponders TA SOL HAM QUAD Control (0.3 m/s) TA SOL HAM QUAD Control (0.9 m/s) TA SOL HAM QUAD
Total Area, V
Burst Duration, % Step Cycle
Burst Area, V
Pre
Post
Pre
Post
Pre
Post
Pre
Post
67 ⫾ 46 38 ⫾ 21 36 ⫾ 25 54 ⫾ 32
135 ⴞ 98 39 ⫾ 22 50 ⴞ 43 40 ⫾ 40
1,900 ⫾ 1,116 1,731 ⫾ 937 1,419 ⫾ 941 2,234 ⫾ 1,364
3,877 ⴞ 3,245 1,760 ⫾ 945 1,996 ⴞ 1,417 1,963 ⫾ 1,595
1,284 ⫾ 1,080 1,088 ⫾ 694 788 ⫾ 494 1,919 ⫾ 1,299
2,424 ⴞ 2,298 1,404 ⫾ 796 1,275 ⴞ 923† 1,692 ⫾ 2,010
54 ⫾ 22 70 ⫾ 10 83 ⫾ 10 83 ⫾ 11
49 ⫾ 18 67 ⫾ 19 72 ⴞ 17# 73 ⴞ 13
33 ⫾ 59 23 ⫾ 25 23 ⫾ 25 22 ⫾ 19
31 ⫾ 55 31 ⫾ 15 32 ⫾ 29 27 ⫾ 16
1,282 ⫾ 2,594 1,175 ⫾ 1,026 1,049 ⫾ 1,279 1,341 ⫾ 1,274
898 ⫾ 1,442 1,556 ⫾ 944 1,595 ⫾ 1,593 1,283 ⫾ 759
695 ⫾ 1,514 810 ⫾ 864 665 ⫾ 797 822 ⫾ 683
562 ⫾ 731 951 ⫾ 555 923 ⫾ 985 900 ⫾ 540
41 ⫾ 20 71 ⫾ 12 63 ⫾ 25 78 ⫾ 16
42 ⫾ 22 72 ⫾ 9 63 ⫾ 21 69 ⫾ 17
56 ⫾ 20 29 ⫾ 8 14 ⫾ 9 11 ⫾ 6
N/A N/A N/A N/A
1,963 ⫾ 981 959 ⫾ 217 534 ⫾ 601 394 ⫾ 253
N/A N/A N/A N/A
1,631 ⫾ 775 649 ⫾ 175 384 ⫾ 423 326 ⫾ 207
N/A N/A N/A N/A
62 ⫾ 11 46 ⫾ 8 47 ⫾ 22 55 ⫾ 24
N/A N/A N/A N/A
79 ⫾ 26 58 ⫾ 13 18 ⫾ 12 24 ⫾ 21
N/A N/A N/A N/A
1,823 ⫾ 644 1,164 ⫾ 245 364 ⫾ 394 462 ⫾ 480
N/A N/A N/A N/A
2,225 ⫾ 1,031 1,252 ⫾ 488 366 ⫾ 415 474 ⫾ 653
N/A N/A N/A N/A
61 ⫾ 4 46 ⫾ 11 46 ⫾ 17 44 ⫾ 21
N/A N/A N/A N/A
Values are means ⫾ SD. Calculation of total area and burst area were done differently (see methods) and are not directly comparable. Numbers marked in bold represent a statistically significant change posttraining compared with pretraining (P ⬍ 0.05, paired t-test). Differences in EMG values between iSCI subjects and controls are stated in the text. N/A, not applicable. #P ⫽ 0.06; †P ⫽ 0.10. J Neurophysiol • VOL
101 • FEBRUARY 2009 •
www.jn.org
TRAINING-INDUCED CHANGES IN EMG AFTER SCI
975
FIG. 4. Changes in EMG burst duration with training expressed as a percentage of the total step cycle that is normalized to 100%. Same format as in Fig. 3. In some muscles (one SOL, one HAM, and one QUAD of responders), burst duration values could not be measured because of contact artifact affecting the EMG signal. Solid and dashed horizontal lines represent mean and ⫾SD values, respectively, for the control group. *P ⬍ 0.05; #P ⫽ 0.06.
values given the shorter burst durations in the TA and HAM muscles. In only one of the 12 HAM/QUAD muscle pairs studied in the nonresponders was there a decrease in cocontraction of ⬎15% of the step cycle after training.
off times was similar between the two groups (0.96 ⫾ 0.04 responders vs. 0.94 ⫾ 0.07 nonresponders, values combined for all muscles, P ⫽ 0.17). Changes in clonic activity
Regularity of EMG activation (on and off times of EMG burst) To determine whether training affected the regularity of stepping, the on and off times of an EMG burst for each subject were plotted on a circular representation of the step cycle (Fig. 6A) and the angular dispersion (r), a measure of variability, was calculated (see METHODS). There was less variability in the on and off times of muscle activity in the responders before training compared with the nonresponders, as reflected in higher r values obtained by combining data from all muscles [0.92 ⫾ 0.07 vs. 0.89 ⫾ 0.1, P ⬍ 0.05; Fig. 6, B and C (gray bars)]. After training several muscles in both responders and nonresponders showed a statistically significant decrease in variability in either the on or off time, indicated by an increase in the r value (black bars in Fig. 6, B and C, P ⬍ 0.05 in all cases). After training, the amount of variability in the on and
In the EMG activity of all subjects, including the controls, power in the clonic frequency band (⬃7 to 9 Hz) was detected. An example of visible clonus in the EMG signal from the HAM muscle generated during the stance phase of walking is shown for a responder in Fig. 7A (before training). There were no differences between responders and nonresponders in the amount of power in the clonic band before training (4.2 ⫾ 1.1 and 4.0 ⫾ 0.9 dB/s, respectively; P ⬎ 0.6, Fig. 7C, gray bars). After training, the amount of power in the 7- to 9-Hz band decreased, as shown for the responder subject in Fig. 7B. Similar trends occurred for both groups where the amount of clonic EMG activity decreased to 3.7 ⫾ 0.9 dB/s in the responders and to 3.5 ⫾ 0.9 dB/s in the nonresponders (Fig. 7C, black bars, P ⬎ 0.05). The iSCI subjects (combined data from responders and nonresponders) showed significantly more power in the approximately 7- to 9-Hz band both before
FIG. 5. Changes in cocontraction with training. A: responder group. Amount of cocontraction expressed as a percentage of normalized step cycle both before (gray bars) and after (black bars) treadmill training for the TA/SOL (left graph) and HAM/QUAD (right graph) muscle pairs. Same format as in Figs. 3 and 4. B: corresponding data for the Nonresponder group. C: example data from Responder subject (1M) demonstrating decrease in cocontraction (marked by gray boxes) for the HAM/QUAD muscle pairs after training, which is mainly due to a decrease in burst duration of the HAM muscle.
J Neurophysiol • VOL
101 • FEBRUARY 2009 •
www.jn.org
976
GORASSINI, NORTON, NEVETT-DUCHCHERER, ROY, AND YANG
FIG. 6. Angular dispersion (r) was used to estimate the variability in onset and offset times for each muscle group. A: each dot on the circle represents the onset time of a muscle expressed as a percentage of the normalized step cycle. The vector points to the center of gravity of the dots, the length being an indicator of the spread of the dots. B: responders: there was a decrease in the variability of both the on (left bars) and off (right bars) times for all muscle groups as indicated by increased r values (pre: gray bars; post: black bars). Increases were significant in 3 cases (paired t-test). C: nonresponders: increases in r values were significant in 4 cases. *P ⬍ 0.05.
(4.1 ⫾ 1.0 dB/s) and after (3.7 ⫾ 0.9 dB/s) training than that in the controls (2.5 ⫾ 0.2 dB/s, all P ⬍ 0.005). Reproducibility of EMG measures Because EMG measurements were made on data acquired on different recording days, it was necessary to ensure that
factors such as small differences in positioning and/or impedance of recording electrodes did not appreciably change the measured EMG values. Reproducibility of the measured peak EMG activity was examined by recording muscle activity during treadmill walking in three controls (at two intervals separated by ⱖ1 wk). Muscle activity patterns in the controls should not change since no training was undertaken in the intervening period, allowing us to assess the test/retest reliability of our measures and to ensure that any changes in EMG activity were indeed a result of training. Peak EMG activation for any muscle did not vary by ⬎10% (all P ⬎ 0.1) and this is in accord with published guidelines on EMG test/retest reliability (Hallet et al. 1994). DISCUSSION
Although responders and nonresponders both developed a more regular and less clonic EMG pattern on the treadmill, only the responders showed increases in EMG activation and shortening of the EMG burst duration in select muscles. Interestingly, the responders also had vastly different EMG profiles in proximal muscles compared with those of uninjured controls, both before and after training. Therefore the ability to modify the activation of muscles during walking after injury may predict whether a patient can produce further compensations in response to training. Mechanisms responsible for the muscle activation patterns observed during walking after iSCI and the changes induced by training are discussed in the following text. FIG.
7. Changes in clonic EMG activation from training. Example HAM EMG during a single step before (A) and after (B) training, respectively. Although some clonic activity in the 7- to 9-Hz range remains after training it is reduced in amplitude. C: the amount of clonic activity decreased in both the responder and nonresponders. Although clonic activity was reduced after training, it remained higher than that in controls. *P ⬍ 0.05; **P ⬍ 0.005. J Neurophysiol • VOL
Training altered EMG activity in certain muscles Increases in muscle activation have been reported for iSCI subjects undergoing training at an earlier stage of recovery (Grasso et al. 2004: 1– 6 mo postinjury), but the changes were not reported for individual muscle groups and subjects who
101 • FEBRUARY 2009 •
www.jn.org
TRAINING-INDUCED CHANGES IN EMG AFTER SCI
responded positively to the training were averaged with those who did not respond. Moreover, spontaneous recovery could also have contributed to the changes during the relatively acute phase postinjury. The present study controls for spontaneous recovery by examining subjects ⱖ8 mo postinjury who had already plateaued in their walking function. In the responders only, the TA and HAM muscles showed increases in peak, total, and burst EMG activity. However, both responders and nonresponders showed patterns of stepping that were equally less variable at the end of the training period compared with their initial values; thus a decrease in variability of walking alone does not account for the changes in EMG activation observed in the responder group. The increase in the regularity of stepping may arise from sources intrinsic to the subject, such as improved modulation of muscle activity associated with the subjects becoming more accustomed to the treadmill, or from extrinsic factors, such as improved timing of assistance from the therapists. To avoid the increased regularity of stepping affecting our calculation of EMG amplitudes and timing, we examined each step individually rather than calculating these values from averaged EMG profiles. In addition, we were careful to ensure that the recording conditions before and after training were identical, particularly with regard to treadmill speed and body-weight unloading, which can affect both the amplitude and timing of EMG activation during treadmill walking (Harkema et al. 1997; Ivanenko et al. 2003, 2006). Changes in EMG activation as a result of changing walking speed are also shown for the control subjects walking at 0.3 and 0.9 m/s (Table 2). In the Grasso et al. (2004) study, a correlational analysis of muscle activity before and after treadmill training was presented. In that study, although the kinematics of the movement became more similar to that of the uninjured, especially the foot trajectory, the muscle activity did not show the same trend and, in some subjects, the activity pattern actually became less like controls. In our recordings, it was surprising to note that the responders, who on average had twice the volitional muscle strength as that of the nonresponders (see MMS scores in Table 1), also displayed EMG activation patterns during walking that were vastly different from those of uninjured controls. In particular, the proximal HAM and QUAD activity, which mainly occurred during stance, was three- to fourfold greater than that in controls and likely reflects the greater need to control for postural instabilities resulting from reduced muscle strength and/or control of important muscles for walking. Unlike controls, the responders likely cannot take advantage of the limbs’ biomechanics to help stabilize the body during stance and propel the limbs forward in swing, but must use additional EMG activation. For example, the knee is often more flexed during stance in individuals with iSCI than in the uninjured, necessitating more extensor activity to prevent collapse (Winter 1980). Once the responders became more stable in their walking after training, some actually showed a decrease in QUAD muscle activity to reach values closer to those of the controls, although this was not a consistent trend across all subjects. In contrast, the nonresponders were too weak to provide the added muscle activity needed to compensate for the inefficient biomechanics and, ironically, had similar amounts of activation in proximal muscles compared with that in the uninjured controls. As discussed in the following text, a lack of compensation from training in the nonresponders may arise J Neurophysiol • VOL
977
from an insufficient amount of residual descending pathways, as evidenced by the more pronounced muscle weakness in these subjects compared with that in the responders. Neuronal mechanisms producing changes in EMG activation A prolonged period of treadmill training with partial bodyweight support leads to an increase in overground walking ability that is accompanied by changes in amplitude and timing of select muscles. Observations from animals with anatomically complete spinal cord lesions indicate that the spinal cord contains neural circuits capable of generating a stepping pattern (Lovely et al. 1986). Treadmill training in these adult animals, which presumably occurs by training these neural circuits or central pattern generators (Barbeau and Rossignol 1987), leads to improved treadmill walking, but does not translate to overground, self-propulsive walking. Based on the animal findings (Barrie`re et al. 2008), a possible mechanism to explain our current observations is that we are training spinal circuits or reflexes to generate a better stepping pattern. The observed reduction in clonic activity suggests changes in spinal reflex pathways or circuitry may contribute to the improvements in walking function (Barbeau et al. 1999; Dimitrijevic et al. 1980). However, a decrease in the amount of clonic activity was not correlated with an improvement in function because a similar number of responders and nonresponders demonstrated decreases in clonic activity. An alternative and additional mechanism to produce improved walking may be an increase in the activation of descending pathways from the motor cortex and/or brain stem. This may also explain why changes occurred only in the TA and HAM, and not SOL muscles. Estimates of the cortical projections to the leg indicate that the SOL muscle receives fewer cortical inputs than the TA and the more proximal muscles (Bawa et al. 2002; Brouwer and Ashby 1990). The SOL is predominantly a postural muscle whose activity is heavily modulated by spinal load-dependent reflexes (Duysens et al. 2000; Harkema et al. 1997) and the similar amounts of SOL EMG activation between the stronger controls and weaker nonresponders may reflect the spinally driven element of the SOL activity. Our earlier studies have demonstrated a relationship between functional recovery and descending corticospinal drive. The increase in the size of the maximal motor-evoked potential in the TA and QUAD muscles from training was positively correlated with functional improvement in walking (Thomas and Gorassini 2005). The degree of common cortical drive during walking, as measured by coherence of the EMG signal in the 20- to 40-Hz bandwidth, was also found to be higher for the thigh muscles (HAM and QUAD) of iSCI subjects who responded to treadmill training (Norton and Gorassini 2006). Together with the current data, this result suggests that muscles with greater descending drive from the motor cortex are also the ones that change the most with training. In addition to training-induced increases in the activation of excitatory spinal circuits by spared corticospinal and brain stem inputs, increases in the activation of inhibitory spinal circuits by descending inputs may also have occurred in response to training. For example, decreases in the burst duration (and cocontraction) of proximal muscles may have been produced by a stronger descending activation of inhibitory inter-
101 • FEBRUARY 2009 •
www.jn.org
978
GORASSINI, NORTON, NEVETT-DUCHCHERER, ROY, AND YANG
neurons controlling the duration of muscle timing during walking (Shefchyk and Jordan 1985). Summary and clinical implications Before training there was a difference in the amplitude of muscle activity during walking between the responders and the nonresponders. This initial level of muscle activity produced during walking may be a useful predictor of subjects who will respond to the therapy, especially in the ASIA C class, which is very broad and within which there are currently no predictors for who will benefit from treadmill training therapy. This is an issue we will address in a forthcoming publication. This study has shown distinct changes in the way the damaged nervous system activates the muscles of the leg during walking that parallel functional recovery of walking skills after treadmill training. The altered pattern of EMG activity from training in iSCI subjects likely reflects changes at both spinal and supraspinal levels of the neural axis, although evidence for the former still needs to be established in the human. Finally, this study also highlights that functional gains in overground walking ability can be made several years after a spinal cord injury and raises the concern that protocols using both regeneration-based interventions (e.g., olfactory ensheathing cell graphs) and motor training in subjects with chronic injury must take into account the effects of training in isolation. ACKNOWLEDGMENTS
We thank all the subjects in this study for profound dedication and enthusiasm; K. Brunton, P. Doughty, S. Jamieson, J. McPhail, G. Hendricks, R. Lohlun, and all student volunteers for providing excellent patient care and training; and L. Guevremont for providing advice on analysis of the gait data. GRANTS
Funding for this work was provided by the Alberta Paraplegic Association, Canadian Institutes of Health Research, National Institute of Neurological Disorders and Stroke Grant R01 NS-048170, Alberta Heritage Foundation for Medical Research, Faculties of Medicine and Dentistry and Rehabilitation Medicine of the University of Alberta, Canadian Neurotrauma Fund, and the Spinal Cord Injury Treatment Society of Edmonton. REFERENCES
Barbeau H, Blunt R. A novel interactive locomotor approach using body weight support to retrain gait in spastic paretic subjects. In: Plasticity of Motoneuronal Connections, edited by Wernig A. New York: Elsevier Science, 1991, p. 461– 474. Barbeau H, Danakas M, Arsenault B. The effects of locomotor training in spinal cord injured subjects: a preliminary study. Restor Neurol Neurosci 5: 81– 84, 1993. Barbeau H, McCrea DA, O’Donovan MJ, Rossignol S, Grill WM, Lemay MA. Tapping into spinal circuits to restore motor functions. Brain Res Rev 30: 27–51, 1999. Barbeau H, Rossignol S. Recovery of locomotion after chronic spinalization in the adult cat. Brain Res 412: 84 –95, 1987. Barrie`re G, Leblond H, Provencher J, Rossignol S. Prominent role of the spinal central pattern generator in the recovery of locomotion after partial spinal cord injuries. J Neurosci 28: 3976 –3987, 2008. Bawa P, Chalmers GR, Stewart H, Eisen AA. Response of ankle extensor and flexor muscles to transcranial magnetic stimulation. J Neurophysiol 88: 124 –132, 2002. Behrman A, Harkema SJ. Locomotor training after human spinal cord injury: a series of case studies. Phys Ther 80: 688 –700, 2000. Brouwer B, Ashby P. Corticospinal projections to upper and lower limb spinal motoneurons in man. Electroencephalogr Clin Neurophysiol 76: 509 –519, 1990. J Neurophysiol • VOL
Calancie B, Del Rosario M, Bronton JG. Neural plasticity as revealed by the natural progression of movement expression— both voluntary and involuntary—in humans after spinal cord injury. Prog Brain Res 128: 71– 88, 2000. Dietz V, Colombo G, Jensen L. Locomotor activity in spinal man. Lancet 344: 1260 –1263, 1994. Dietz V, Colombo G, Jensen L, Baumgartner L. Locomotor capacity of spinal cord in paraplegic patients. Ann Neurol 37: 574 –582, 1995. Dietz V, Wirz M, Colombo G, Curt A. Locomotor capacity and recovery of spinal cord function in paraplegic patients: a clinical and electrophysiological evaluation. Electroencephalogr Clin Neurophysiol 109: 140 –153, 1998. Dimitrijevic MR, Nathan PW, Sherwood AM. Clonus: the role of central mechanisms. J Neurol Neurosurg Psychiatry 43: 321–332, 1980. Ditunno JF, Young W, Donovan WH, Creasy G. The International Standard Booklet for neurological and functional classification of spinal cord injury. Paraplegia 32: 70 – 80, 1994. Ditunno PL, Ditunno JF. Walking index for spinal cord injury (WISCI II): scale revision. Spinal Cord 39: 654 – 656, 2001. Dobkin BH, Apple D, Barbeau H, Basso DM, Behrman A, Deforge D, Ditunno JF, Dudley GA, Elashoff RM, Fugate L, Harkema SJ, Saulino M, Scott M. Weight-supported treadmill vs over-ground training for walking after acute incomplete SCI. Neurology 66: 484 – 493, 2006. Duysens J, Clarac F, Cruse H. Load-regulating mechanisms in gait and posture: comparative aspects. Physiol Rev 80: 83–133, 2000. Field-Fote EC. Spinal cord control of movement: implications for locomotor rehabilitation following spinal cord injury. Phys Ther 80: 477– 484, 2000. Field-Fote EC, Lindley SD, Sherman AL. Locomotor training approaches for individuals with spinal cord injury: a preliminary report of walkingrelated outcomes. J Neurol Phys Ther 29: 127–137, 2005. Grasso R, Ivanenko YP, Zago M, Molinari M, Scivoletto G, Castellano V, Macellari V, Lacquaniti F. Distributed plasticity of locomotor pattern generators in spinal cord injured patients. Brain 127: 1019 –1034, 2004. Hallet M, Berardelli A, Delwaide P, Freund HJ, Kimura J, Lucking C, Rothwell J, Shahani BT, Yanagisawa N. Central EMG and tests of motor control. Report of an IFCN committee. Electroencephalogr Clin Neurophysiol 90: 404 – 432, 1994. Harkema SJ. Neural plasticity after human spinal cord injury: application of locomotor training to the rehabilitation of walking. Neuroscientist 7: 455– 468, 2001. Harkema SJ, Hurley SL, Patel UK, Requejo PS, Dobkin BH, Edgerton VR. Human lumbosacral spinal cord interprets loading during stepping. J Neurophysiol 77: 797– 811, 1997. Hauser SL, Dawson DM, Lehrich JR, Beal MF, Kevy SV, Propper RD, Mills JA, Weiner HI. Intensive immunosuppression in progressive multiple sclerosis. N Engl J Med 308: 173–180, 1983. Hicks AL, Adams MM, Ginis KM, Giangreorio L, Latimer A, Phillips SM, McCartney N. Long-term body-weight-supported treadmill training and subsequent follow-up in persons with chronic SCI: effects on functional walking ability and measures of subjective well-being. Spinal Cord 43: 291–298, 2005. Hidler JM, Harvey RL, Rymer WZ. Frequency response characteristics of ankle plantar flexors in humans following spinal cord injury: relation to degree of spasticity. Ann Biomed Eng 30: 969 –981, 2002. Ivanenko YP, Grasso R, Zago M, Molinari M, Scivoletto G, Castellano V, Macellari V, Lacquaniti F. Temporal components of the motor patterns expressed by the human spinal cord reflect foot kinematics. J Neurophysiol 90: 3355–3565, 2003. Ivanenko YP, Poppele RE, Lacquaniti F. Spinal cord maps of spatiotemporal alpha-motoneuron activation in humans walking at different speeds. J Neurophysiol 95: 602– 618, 2006. Lovely RG, Gregor RJ, Roy RR, Edgerton VR. Effects of training on the recovery of full-weight-bearing stepping in the adult spinal cat. Exp Neurol 92: 421– 435, 1986. Mazzaro N, Grey MJ, de Nascimento OF, Sinkjaer T. Afferent-mediated modulation of the soleus muscle activity during the stance phase of human walking. Exp Brain Res 173: 713–723, 2006. Medical Research Council (MRC). Aids to the Investigation of Peripheral Nerve Injuries. Memorandum 45. London: Her Majesty’s Stationery Office, 1976. Musselman KE. Clinical significance testing in rehabilitation research: what, why, and how? Phys Ther Rev 12: 287–296, 2007. Norton JA, Gorassini MA. Changes in cortically related inter-muscular coherence accompanying improvements in locomotor skills in incomplete spinal cord injury. J Neurophysiol 95: 2580 –2589, 2006.
101 • FEBRUARY 2009 •
www.jn.org
TRAINING-INDUCED CHANGES IN EMG AFTER SCI Nymark J, Deforge D, Barbeau H, Badour M, Bercovitch S, Tomas J, Gourdreau L, MacDonald J. Body weight support treadmill gait training in the subacute recovery phase of incomplete spinal cord injury. J Neurol Rehabil 12: 119 –138, 1998. Shefchyk SJ, Jordan LM. Motoneuron input resistance changes during fictive locomotion produced by stimulation of the mesencephalic locomotor region. J Neurophysiol 54: 1101–1108, 1985. Thomas SL, Gorassini MA. Increases in corticospinal tract function by treadmill training after incomplete spinal cord injury. J Neurophysiol 94: 2844 –2855, 2005. Wernig A, Muller S, Nanassy A, Cagol E. Laufband therapy based on “rules of spinal locomotion” is effective in spinal cord injured persons. Eur J Neurosci 7: 823– 829, 1995.
J Neurophysiol • VOL
979
Wernig A, Nanassy A, Muller S. Maintenance of locomotor abilities following Laufband (treadmill) therapy in para- and tetraplegic persons: follow-up studies. Spinal Cord 36: 744 –749, 1998. Winter DA. Overall principle of lower limb support during stance phase of gait. J Biomech 13: 923–927, 1980. Winter DA. The Biomechanics and Motor Control of Human Gait: Normal, Elderly and Pathological (2nd ed.). Waterloo, Ontario, Canada: Univ. of Waterloo Press, 1991, p. 41. Wirz M, Colombo G, Dietz V. Long-term effects of locomotor training in spinal humans. J Neurol Neurosurg Psychiatry 71: 93–96, 2001. Zar JH. Biostatistical Analysis. Upper Saddle River, NJ: Prentice Hall, 1999.
101 • FEBRUARY 2009 •
www.jn.org