1804
Changes in mesopredator-community structure in response to urbanization Suzanne Prange and Stanley D. Gehrt
Abstract: Common raccoons (Procyon lotor (L., 1758)), Virginia opossums (Didelphis virginiana Kerr, 1792), and striped skunks (Mephitis mephitis (Schreber, 1776)) are common urban inhabitants, yet their relative demographic response to urbanization is unknown. Urbanization often affects community structure, and understanding these effects is essential in rapidly changing landscapes. We examined mesopredator-community structure in small and large patches of natural habitat surrounded by urban, suburban, or rural matrices. We created generalized logit models using road-survey and livetrapping data to examine effects of surrounding land use on proportions of opossums and skunks relative to raccoons, while accounting for effects of season and year and their interactions. For large sites, the land use × season model was chosen for both data sets, and occurrence of opossums and skunks relative to raccoons was higher at the rural site (P < 0.001 for all tests). For small sites, the land-use model best fit the road-survey data, with a higher occurrence of skunks relative to raccoons at the rural site (χ2 = 21.06, df = 1, P < 0.001). However, the season model best fit the trapping data for small sites. Our data indicated that raccoons exhibited a greater demographic response to urbanization, suggesting that they exploit anthropogenic resources more efficiently. Although numerous reasons exist for disparity in anthropogenic-resource use, differences in intraspecific tolerance and the role of learning in foraging behaviors were best supported by our observations. Résumé : Le raton laveur (Procyon lotor (L., 1758)), la sarigue de Virginie (Didelphis virginiana Kerr, 1792) et la moufette rayée (Mephitis mephitis (Schreber, 1776)) sont des habitants communs des zones urbaines; on ne connaît néanmoins pas leurs réactions démographiques relatives à l’urbanisation. L’urbanisation affecte souvent la structure de la communauté et il est essentiel de comprendre ces effets dans les paysages soumis à des transformations rapides. Nous avons étudié la structure de la communauté de mésoprédateurs dans de petites et de grandes parcelles d’habitat naturel entourées de matrices urbaines, suburbaines et rurales. Nous avons mis au point des modèles logit généralisés avec des données d’inventaires routiers et de piégeages d’animaux vivants afin d’étudier l’effet de l’utilisation des terres adjacentes sur les proportions de sarigues et de moufettes relativement aux ratons laveurs, tout en tenant compte des effets des saisons et des années et de leurs interactions. Dans les grandes parcelles, nous avons retenu le modèle d’utilisation des terres × saisons pour les deux séries de données et la fréquence des sarigues et des moufettes est plus grande par rapport à celle des ratons laveurs dans le site rural (P < 0,001 dans tous les tests). Dans les petites parcelles, le modèle d’utilisation des terres s’ajuste mieux aux données d’inventaire routier et indique une fréquence plus élevée des moufettes par rapport aux ratons laveurs au site rural (P2 = 21,06, dl = 1, P < 0,001). Cependant, le modèle des saisons s’ajuste mieux aux données de piégeage dans les petites parcelles. Nos données indiquent que les ratons laveurs ont une réaction démographique plus forte à l’urbanisation, ce qui laisse croire qu’ils exploitent les ressources anthropiques plus efficacement. Bien qu’il existe plusieurs raisons pour expliquer les différences dans l’utilisation des ressources d’origine humaine, nos observations privilégient la tolérance interspécifique et le rôle de l’apprentissage dans les comportements de quête de nourriture. [Traduit par la Rédaction]
Prange and Gehrt
Introduction Since the 1960s, the amount of urbanized land in the United States has more than doubled, with over 400 000 ha of land per year lost to urban and suburban development from 1960 to 1990 (Heimlich and Anderson 2001). Rapid urbanization and attendant loss of agricultural and natural areas have raised concerns regarding the effects of urbanization on individual species as well as natural communities.
1817
Preserving patches of natural habitat within urbanizing landscapes is often advocated as a method of conserving natural communities (Fernández-Juricic and Jokimäki 2001; Marzluff and Ewing 2001; Rudd et al. 2002). However, the resultant communities may not be representative of those in unaltered systems. Studies regarding bird and small-mammal communities have documented changes in both composition and structure in urbanized landscapes (Blair 1996; Bolger et al. 1997; Söderström et al. 2001; Bock et al. 2002; Green and
Received 5 January 2004. Accepted 7 December 2004. Published on the NRC Research Press Web site at http://cjz.nrc.ca on 5 February 2005. S. Prange1 and S.D. Gehrt. Max McGraw Wildlife Foundation, P.O. Box 9, Dundee, IL 60118, USA, and School of Natural Resources, The Ohio State University, 2021 Coffey Road, 210 Kottman Hall, Columbus, OH 43210, USA. 1
Corresponding author (e-mail:
[email protected]).
Can. J. Zool. 82: 1804–1817 (2004)
doi: 10.1139/Z04-179
© 2004 NRC Canada
Prange and Gehrt
Baker 2003; Hennings and Edge 2003). Understanding the effects of urbanization on natural communities is essential to conservation efforts in rapidly changing landscapes (Niemelä 1999). Alterations in community composition and structure often occur as a consequence of habitat fragmentation, and the response of species to fragmentation in urbanized landscapes has been the subject of much recent research (Crooks 2002; Fernández-Juricic 2002; Tigas et al. 2002; Patten and Bolger 2003; Riley et al. 2003). Decreased patch size, increased isolation, increased edge effects, and higher levels of human disturbance can serve to reduce or eliminate populations of fragmentation-sensitive species (Crooks 2002; FernándezJuricic 2002; Patten and Bolger 2003). Habitat fragmentation and its associated effects, however, are not the only factors that contribute to changes in natural communities. Urbanization also alters ecosystem processes through human activities, which can degrade habitats but can also augment resources. Species capable of efficiently exploiting refuse as food and man-made structures as den or roost sites often occur at higher densities than in comparable rural areas (Harris and Rayner 1986; Fedriani et al. 2001; McKinney 2002; Prange et al. 2003). Thus, a disparity in anthropogenicresource use by members of a community could result in the dominance of a few or even a single species in urbanized areas. Species that respond positively to anthropogenic resources are typically generalists, with broad dietary and habitat requirements (McKinney 2002). Among mammals, many medium-sized predators or mesopredators (1–15 kg; sensu Buskirk 1999) fit this description. Common raccoons (Procyon lotor (L., 1758)), Virginia opossums (Didelphis virginiana Kerr, 1792), and striped skunks (Mephitis mephitis (Schreber, 1776)) are common North American mesopredators. These species are sympatric throughout much of their geographic ranges and can exhibit a great deal of niche overlap, utilizing similar habitats, foods, and den sites (Shirer and Fitch 1970; Kissell and Kennedy 1992; Ladine 1997). All are also tolerant of fragmentation and human presence, and therefore are commonly present in urban habitats (Crooks 2002). Further, all 3 species are generalists in terms of both diet and habitat (McManus 1974; Lotze and Anderson 1979; Wade-Smith and Verts 1982) and therefore may be expected to respond positively to anthropogenic resources. Yet even among such similar species, differences may exist in their demographic response to urbanization. Raccoons appear to be highly efficient at exploiting anthropogenic resources, and consequently raccoon populations in urbanized areas may attain densities much higher than those in rural habitats (Riley et al. 1998; Prange et al. 2003). Whereas rural raccoon densities typically range from 2 to 20/km2 (Lotze and Anderson 1979; Gehrt 2003), reported urban densities have ranged from 37 to 333/km2 (Schinner and Cauley 1974; Hoffmann and Gottschang 1977; Rosatte et al. 1991; Feigley 1992; Riley et al. 1998; Prange et al. 2003). Skunk densities do not appear to respond to urbanization to a similar extent as raccoons (Gehrt 2004). Reported rural skunk densities have ranged from 1 to 26/km2 (Ferris and Andrews 1967; Wade-Smith and Verts 1982). In urban Ontario, Rosatte et al. (1991) reported locally elevated densities, with estimates ranging from 1 to 36 skunks/km2. However, population mod-
1805
els for the same area depicted raccoon densities ranging from 37 to 94/km2, whereas skunk densities ranged from 6 to 13/km2 and were not substantially higher than typical rural densities (Broadfoot et al. 2001). Similar demographic information is lacking for urban opossums, and it is not known whether their response to urbanization rivals that of raccoons. If these species differ in their demographic response to anthropogenic resources, community structure may be altered in urbanized habitats relative to rural areas. To address this question we identified mesopredator-community structure in 6 patches of natural habitat in northeastern Illinois that were surrounded by different levels of urbanization. Although other mesopredators resided within our study areas (e.g., red foxes (Vulpes vulpes (L., 1758)), American mink (Mustela vison Schreber, 1777)), we focused our analyses on raccoons, opossums, and skunks because of their similarities and their potential for a high degree of niche overlap. Our objective was to determine whether these 3 similar and urban-adapted species differ in their demographic response to urbanization, resulting in altered mesopredator-community structure in urbanized areas.
Materials and methods Study sites We selected 6 study sites in northeastern Illinois, of which 3 were >500 ha and 3 were 10% in Cook County) is protected in the form of forest preserves and parks, therefore this region is an optimal area in which to address the effects of urbanization on natural communities residing within protected habitat fragments. Our large study sites were Ned Brown Forest Preserve (urban) in Cook County, Max McGraw Wildlife Foundation property (suburban) in Kane County, and Glacial Park (rural) in McHenry County. We selected as small sites Beck Lake Forest Preserve (urban) in Cook County, and 2 forest preserves in Kane County: Burnidge Forest Preserve (suburban), and Hampshire Forest Preserve (rural). We classified study sites based on surrounding land use within a 1-km radius of each site (Table 1). We defined urban matrices as those that consisted primarily of areas of human development (≥50%), most of which was commercial and (or) industrial. Suburban matrices were defined as having substantial human development as well (≥25%), but development was primarily residential. Rural matrices were defined as those consisting primarily of agricultural lands, with ≤25% developed areas (commercial, industrial, and residential). As a consequence of the level of human development, traffic volumes were highest in urban landscapes and lowest in rural areas (Table 1). Although we could not select study areas that were identical in habitat composition, all contained the general habitats of woodland, wetland, and grassland. We exported aerial maps (full resolution 1:5000) from PhotoMapper™ version © 2004 NRC Canada
Note: Surrounding land use was determined using the Illinois Land Cover Atlas (Illinois Department of Natural Resources 1996), 1997 aerial photographs, and ground truthing. a Includes open water. b Includes old fields. c Includes school yards and cemeteries. d From the 1997 Cook County Traffic Map, Office of Planning and Programming, Illinois Department of Transportation. e From the 1997 Kane County Traffic Map, Office of Planning and Programming, Illinois Department of Transportation. f Includes wet prairie and sedge meadows. g From the 1997 McHenry County Traffic Map, Office of Planning and Programming, Illinois Department of Transportation.
18 400 – 122 100d 1 450 – 38 900e 400 – 6 300e 31c 17 10 0 54 84 81 20 27 360 204 100
7 4 8
12 76 65
0 0 0
34 24 6
35 5 0
34 600 – 147 200d 17 600 – 57 900e 900 – 5 800g 22c 28 14 0 33 78 51 44 20
Large sites Urban Suburban Rural Small sites Urban Suburban Rural
1499 526 1214
19 13 33f
30 15 40
0 28 7
35 33 8
43 6 0
Mean traffic volumes Residential Agriculture Agriculture Woodlands
Habitat (%)
Wetlandsa
Grasslandsb
Surrounding land use (%)
Commercial and industrial
Open space
Can. J. Zool. Vol. 82, 2004
Size (ha)
Table 1. Size, habitat composition, surrounding land use within a 1-km buffer area, and range of mean traffic volumes (number of vehicles/24 h) on adjacent roads for large (urban: Ned Brown Forest Preserve, Cook County; suburban: Max McGraw Wildlife Foundation, Kane County; rural: Glacial Park, McHenry County) and small (urban: Beck Lake Forest Preserve, Cook County; suburban: Burnidge Forest Preserve, Kane County; rural: Hampshire Forest Preserve, Kane County) open areas in northeastern Illinois.
1806
4.01 (American Aerial Photos 2004) and used ArcView® version 3.3 (Environmental Systems Research Institute, Inc. 2002) to create polygons that represented each major habitat type (woodlands, wetlands (including open water), grasslands (including old fields), and agricultural areas; Table 1). Ground truthing was conducted when habitat delineations were unclear from aerial photographs. Sites varied in the level of human use they received and consequently in the availability of anthropogenic resources (Prange et al. 2004). The large urban site was intensively used by humans, receiving approximately 1.5 million visitors a year during the 1980s (Dwyer et al. 1985), and currently may receive as many as 3 million visitors annually (Cook County Forest Preserve District, unpublished data). A total of 32 picnic areas and shelters plus numerous additional garbage cans provided supplemental food. The large suburban site was private property and was therefore closed to the public. However, significant amounts of refuse were available at restaurants, amusement parks, and residences within and adjacent to the property. Conversely, little refuse was available at the large rural site, which only contained 2 small picnic areas that received limited use. The pattern of resource availability was similar at small sites: greater human use led to an increase in anthropogenic-resource availability with urbanization. Additionally, resource availability in surrounding areas may be of particular importance to mesopredators residing within smaller preserves because a greater proportion of individuals in the population may have home ranges that extend beyond the preserve boundaries. Therefore, the higher proportions of commercial/industrial and residential areas surrounding the small urban and suburban sites likely served to further increase anthropogenicresource availability at these sites relative to the rural site. Data collection Studies regarding mesopredator communities typically employ the use of scent stations (Oehler and Litvaitis 1996; Dijak and Thompson 2000; Crooks 2002; Gehring and Swihart 2003). However, although scent stations may document presence or absence, they provide little information concerning relative abundance among species or community dynamics. Therefore, we determined mesopredatorcommunity structure based on livetrapping and road-survey data collected as part of a larger study on raccoon demographics. We conducted road-kill surveys from June 1995 to February 2000 at the large sites and from June 1995 to November 1997 at the small sites. We drove fixed survey routes on roads bordering and bisecting each site 2 times per week (Gehrt 2002). We identified all vehicle-killed mammals to species and recorded their location as distance to the nearest landmark (e.g., intersection) or determined Universal Transverse Mercator (UTM) coordinates with a hand-held global positioning system (GPS) unit. Raccoon carcasses were removed from roads. For other species, we noted location to prevent double-counting. At large sites, lengths of routes were 16.0 km for the urban, 8.4 km for the suburban, and 17.4 km for the rural site. On average, routes were shorter at the small sites: lengths were 6.4 km for the urban, 11.0 km for the suburban, and 8.7 km for the rural site. Data were summarized by season, with seasons defined as spring © 2004 NRC Canada
Prange and Gehrt
(March–May), summer (June–August), autumn (September– November), and winter (December–February). Road-kill surveys are subject to a number of biases (Case 1978), particularly when comparisons are made among species. For example, different species may not be equally vulnerable to vehicles. Therefore, we did not assume equal vulnerability for our species, just that relative vulnerabilities were consistent across study sites. This assumption allowed for the comparison of mesopredator-community structure across sites using the proportions of mesopredators collected. However, road-kill surveys may be affected by traffic volume, and our sites varied substantially in this respect (Gehrt 2002; Table 1). Raccoons at our large urban site apparently learned to avoid roads with the highest traffic volumes (Gehrt 2002; Prange et al. 2004). Thus, the relative vulnerability of raccoons may have decreased at the urban sites in comparison with the suburban and rural sites, although the response of opossums and skunks to high traffic volumes is unknown. Despite raccoons’ avoidance of roads with very high traffic volumes, road-kill survey indices were found to be reliable indicators of raccoon population trends, although they may be less reliable in the detection of small changes in low-density populations (Gehrt 2002). Although survey-route length and total number of surveys varied to a small degree among sites within each size category, we assumed that the proportion of mesopredators collected did not vary as a result of differences in total number of kilometres surveyed. We also conducted livetrapping at each site using Tomahawk box traps (Tomahawk Live Trap Company, Tomahawk, Wisconsin) baited with commercial cat food. Trapping sessions were conducted during spring and autumn from 1995 to 1999 at the large sites and from 1995 to 1997 (except autumn 1995) at the small sites. At the large sites, 30 traps were placed in a standardized pattern within a 2.4-km2 grid and maintained for 10–13 nights during each trapping session (Gehrt 2002). Sixteen traps were placed within a 0.6km2 grid and maintained for 6–7 nights at the small sites. Trapping effort differed between large and small sites because of the objectives of the larger study on raccoon demographics. Trapping grids for both large and small sites did not cover the entire study area. Because of the objectives of the larger study, grid locations were chosen to maximize raccoon captures. Thus, although grids encompassed all habitat types, they contained higher proportions of woodland and wetland than were present overall. As with road-kill surveys, livetrapping can produce biased results. Owing to differences in mobility, perception, and behavior, species may vary in their vulnerability to traps. Therefore, we did not assume that these species were equally trappable, but we did assume that their relative vulnerabilities to capture did not vary among sites. Further, our placement of trapping grids may have biased our samples toward raccoons. Road-kill surveys likely provided a less biased determination of community structure because roads bordering and bisecting each site ran through different habitat types, so they were sampled in closer proportion to their availability. However, because trapping-grid locations were chosen similarly across study sites, we assumed that this bias was consistent and therefore the comparison of proportions of mesopredators collected was valid. Finally, although
1807
trapping effort differed between large and small sites, within each size category the total number of trap-nights for each site was relatively consistent. Thus, we assumed that the relative proportion of each species captured did not vary because of small differences in total number of trap-nights within size categories. Captured raccoons were immobilized with an injection of ketamine hydrochloride and acepromazine or with Telazol (Fort Dodge Animal Health, Fort Dodge, Iowa; Gehrt et al. 2001). All raccoons were marked with individually numbered ear tags (Monel No. 3 or 4, National Band and Tag Company, Newport, Kentucky). Captured opossums were not immobilized but they were likewise marked with individually numbered ear tags (Monel No. 1) before release. Skunks were released unmarked. However, because of the small number of skunks captured it was possible to identify individuals by their pelage patterns. Only the initial capture of an individual during each trapping session was used in our analyses. Analyses We summarized our data by calculating seasonal road-kill indices (road kills/1000 km) and capture rates (captures/100 trap-nights). However, we used the proportions of mesopredators collected for analyses of community structure. We analyzed the effects of surrounding land use, season, year, and their interactions on mesopredator community structure using the generalized logits model performed by the CATMOD procedure in SAS version 8.02 (SAS Institute Inc. 1999). The CATMOD procedure performs categorical data modeling and can be used to fit linear models to response functions in the form of generalized logits. We performed separate analyses for road-survey and trapping data and for large and small sites. We separated our analyses for large and small sites because of differences in trapping protocols and length of study periods between the size categories. In each analysis, except for the analysis of trapping data from the small sites, 2 response functions were used: [1]
logit1 = log(p1/p3)
[2]
logit2 = log(p2/p3)
In these functions, p1 is the proportion of opossums, p2 is the proportion of skunks, and p3 is the proportion of raccoons. CATMOD requires that 1 of the dependent variables (proportions of raccoons, opossums, and skunks collected) be used as a reference category. Because we speculated that raccoons exhibit a greater demographic response to urbanization than the other 2 species, we used the proportion of raccoons as the reference category. Thus, the relationships between the predictor variables (land use, season, and year) and the logarithm of the probabilities of collecting (via trapping or road survey) an opossum or skunk relative to the probability of collecting a raccoon were determined. For trapping data from the small sites, only 1 response function, logit1, was used because of the paucity of skunk captures. Only 2 skunks were captured during 1 trapping session at these sites. Model selection was based on Akaike’s Information Criteria corrected for small-sample bias (AICc; Burnham and Anderson 2002). We used ∆ i to rescale the AICc values, which © 2004 NRC Canada
1808
results in the model with the minimum AICc having a value of 0 (∆ i = AICc,i – AICc,min). The larger the ∆ i value, the less likely that model i represents the best model. The following rules were used when interpreting ∆ i values: models with ∆ i ≤ 2 have substantial support, those where 4 ≤ ∆ i ≤ 7 have considerably less support, and those with ∆ i ≥ 10 have essentially no support (Burnham and Anderson 2002). Additionally, we calculated AICc weights (wi) for each model. The wi values range from 0 to 1, such that the sum of weights for all models in the candidate set equals 1.0. The larger the wi value, the more likely that model i represents the best model. Thus, wi provides additional “evidence of support” and aids in model selection (Burnham and Anderson 2002). For the most appropriate model(s) from each analysis, we present the results of the maximum-likelihood analysis of variance (ANOVA) generated by CATMOD. This test provides Wald’s χ2 statistics and associated P values for the effect of each predictor variable (and their interaction, if present) in the model on the response functions. CATMOD also produces maximum-likelihood estimates (log odds ratios) and standard errors for the categories of each predictor variable; however, CATMOD uses one category of each variable as a reference category, such that k – 1 maximumlikelihood estimates are produced, where k is the number of categories for a given variable. CATMOD generates Wald’s χ2 statistics for each maximum-likelihood estimate, and we used these statistics to analyze the differential effects of each category of predictor variables relative to the reference category on the response functions. We used urban, spring, and final study year as reference categories for land use, season, and year, respectively. The appropriate choice of reference category can aid in model interpretation, but choice does not affect the models themselves.
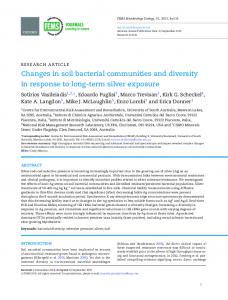
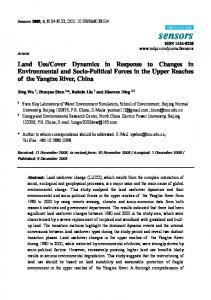
Results Large sites Road-kill surveys From June 1995 to February 2000 we surveyed a total of 16 930 km and identified 1321 road-killed individuals (502 urban; 362 suburban; 457 rural). Raccoons dominated the mesopredator community at all sites, but their relative occurrence was greater at the urbanized sites (urban and suburban; Fig. 1). Road-kill indices for raccoons were higher at the urban and suburban sites than at the rural site for most seasons (Fig. 2). Road-kill indices for opossums and skunks exhibited less variation among sites, although indices for opossums were higher during autumn at the rural site (Fig. 2). Examination of ∆i and wi values for mesopredatorcommunity models revealed the land use × season model best fit the data. For other models ∆ i values were ≥35.9, indicating essentially no support. Additionally, all weight was placed on the land use × season model (wi = 1.0). Land use (χ2 = 71.95, df = 4, P < 0.001), season (χ2 = 44.38, df = 6, P < 0.001), and their interaction (χ2 = 25.90, df = 12, P = 0.011) all explained a significant amount of variation in the response functions. The probabilities of the occurrence of opossums (χ2 = 43.76, df = 1, P < 0.001) and skunks (χ2 = 31.81, df = 1, P < 0.001) relative to raccoons were higher at the rural site. Additionally, the probability of the occurrence
Can. J. Zool. Vol. 82, 2004
of skunks relative to raccoons at the suburban site was somewhat lower (χ2 = 4.19, df = 1, P = 0.041). For all sites combined, the likelihood of collecting opossums relative to raccoons was lower during summer (χ2 = 31.76, df = 1, P < 0.001), and the probability of collecting skunks relative to raccoons was higher during winter (χ2 = 5.57, df = 1, P = 0.018). Interactions of land use and season were observed only in the collection of opossums at the rural site, where the likelihood of their collection relative to raccoons was higher during autumn (χ2 = 7.76, df = 1, P = 0.005) and lower during summer (χ2 = 5.23, df = 1, P = 0.022). Trapping Overall, we captured 2212 individuals (818 urban; 892 suburban; 502 rural). Results from livetrapping were similar to those obtained via road-kill surveys. Although raccoons dominated the mesopredator community at all sites, higher proportions of raccoons were captured at the urbanized sites (Fig. 1). Capture rates were higher for raccoons at the urban and suburban sites than at the rural site during all seasons (Fig. 3). Capture rates for opossums and skunks exhibited much less variation among sites, although skunk capture rates were typically lower at the suburban site. Capture rates for opossums were higher during autumn than spring at all sites (Fig. 3). The land use × season model was again chosen as the best model in the candidate set. All of the weight was placed on this model and other models had ∆i values of ≥129.4. Land use (χ2 = 138.55, df = 4, P < 0.001), season (χ2 = 117.84, df = 2, P < 0.001), and their interaction (χ2 = 12.01, df = 4, P = 0.017) all explained a significant amount of variation in the response functions. Relative to raccoons, a higher probability of capture of opossums (χ2 = 84.22, df = 1, P < 0.001) and skunks (χ2 = 59.00, df = 1, P < 0.001) occurred at the rural site, whereas a lower relative probability of skunk captures occurred at the suburban site (χ2 = 14.94, df = 1, P < 0.001). For all sites combined, the likelihood of capture of opossums relative to that of raccoons was greater during autumn (χ2 = 113.84, df = 1, P < 0.001). Additionally, a land use × season interaction was seen at the rural and suburban sites with respect to the likelihood of opossum captures, with higher probabilities relative to raccoon captures occurring during autumn at these sites (rural: χ2 = 6.63, df = 1, P = 0.010; suburban: χ2 = 3.86, df = 1, P = 0.049). Small sites Road-kill surveys From June 1995 to November 1997, we surveyed a total of 5593 km and recorded 379 individuals (165 urban; 162 suburban; 52 rural). As at the large sites, raccoons dominated the road-killed fauna at all small sites, but a higher proportion of raccoons occurred at the urban and suburban sites (Fig. 4). Road-kill indices for raccoons varied the most among sites and were higher at the urban and suburban sites during most seasons, with strong seasonal peaks observed at the urban site (Fig. 5). Road-kill indices for opossums also varied among sites, although to a lesser degree, with higher indices typically occurring at the urban and suburban sites (Fig. 5). Indices for skunks were lowest at the urban site, but were low and varied among years at all sites (Fig. 5). Unlike the large-site models, season did not appear among the best © 2004 NRC Canada
Prange and Gehrt
1809
Fig. 1. Relative proportions of common raccoons (Procyon lotor), Virginia opossums (Didelphis virginiana), and striped skunks (Mephitis mephitis) collected via road-kill surveys (June 1995 – February 2000) (A) and livetrapping sessions (spring and autumn, 1995 – 1999) (B) at our large study sites (urban: Ned Brown Forest Preserve, Cook County; suburban: Max McGraw Wildlife Foundation, Kane County; rural: Glacial Park, McHenry County) in northeastern Illinois.
models for small sites and the land-use model best fit the data. The second best model was land use × year, but the high ∆i and low wi values (wi = 0.012; ∆i = 8.7) indicated little support for this model. Land use explained a significant portion of the variation in the response functions (χ2 = 30.74, df = 4, P < 0.001). Although the proportion of opossums relative to raccoons was greater at the rural than at the urban site, only the likelihood of the occurrence of skunks relative to raccoons was significant, being higher at the rural site (χ2 = 21.06, df = 1, P < 0.001). Trapping Overall, we captured a total of 464 individuals (171 urban; 166 suburban; 127 rural). Proportions of raccoons and
opossums captured were more similar among sites than proportions derived through road-kill surveys (Fig. 4). Capture rates, however, were higher for raccoons at the urban and suburban sites than at the rural site during most seasons (Fig. 6). Capture rates for opossums exhibited less consistent variation among sites than those for raccoons (Fig. 6). We had only 2 skunk captures and both occurred at the rural site during autumn 1997, thus only logit1 was included in the models. The season model best fit the data (wi = 0.942). The second best model was land use × season, and this model received at least a moderate level of support (wi = 0.046; ∆ i = 6.0). In the season model, the probability of the capture of opossums relative to raccoons was greater during autumn © 2004 NRC Canada
1810
Can. J. Zool. Vol. 82, 2004
Fig. 2. Road-kill indices (road-kills/1000 km) for raccoons (A), opossums (B), and skunks (C) at our large study sites (urban: Ned Brown Forest Preserve, Cook County; suburban: Max McGraw Wildlife Foundation, Kane County; rural: Glacial Park, McHenry County) in northeastern Illinois by season (Sp, spring; Su, summer; Au, autumn; Wi, winter). Note that the scale differs for each species.
(χ2 = 25.38, df = 1, P < 0.001). Although the land use × season model received some support, the maximum-likelihood ANOVA for this model revealed nonsignificant effects for both land use (χ2 = 3.41, df = 2, P = 0.182) and the interaction of land use and season (χ2 = 1.41, df = 2, P = 0.493). However, the maximum-likelihood estimate for the rural site approached significance (χ2 = 2.93, df = 1, P = 0.087), indicating marginal support for a higher likelihood of occurrence of opossums relative to raccoons at the rural site.
Discussion For our large sites, both data sources revealed a shift in mesopredator-community structure at our urbanized sites. Raccoon populations in urbanized areas often attain high densities (Hoffmann and Gottschang 1977; Rosatte et al. 1991), and raccoon densities were greater at our urbanized sites than at our rural site (Prange et al. 2003). Furthermore, raccoon-capture rates and road-kill indices varied the most © 2004 NRC Canada
Prange and Gehrt
1811
Fig. 3. Capture rates (captures/100 trap-nights) for raccoons (A), opossums (B), and skunks (C) at our large study sites (urban: Ned Brown Forest Preserve, Cook County; suburban: Max McGraw Wildlife Foundation, Kane County; rural: Glacial Park, McHenry County) in northeastern Illinois in spring (Sp) and autumn (Au). Note that the scale differs for each species.
among sites, being greatest at the urban and suburban sites. Differences in community structure among sites were primarily due to a disproportionate increase in numbers of raccoons at the urbanized sites. Raccoons may be more efficient at exploiting anthropogenic resources than either opossums or skunks. In support of this, raccoons were consistently observed feeding in or near trash cans and dumpsters at our large urban site, whereas similar observations of opossums and skunks were
rare (S.D. Gehrt, unpublished data). A number of hypotheses may be postulated to explain a greater use of anthropogenic resources by raccoons (Gehrt 2004). Larger body size and greater dexterity may allow raccoons better access to trash cans and dumpsters. However, though substantial amounts of refuse were often found on the ground near trash receptacles at the large urban site, opossums and skunks were not commonly observed making use of these resources (S.D. Gehrt, unpublished data). Alternatively, raccoons may com© 2004 NRC Canada
1812
Can. J. Zool. Vol. 82, 2004
Fig. 4. Relative proportions of raccoons, opossums, and skunks collected via road-kill surveys (June 1995 – November 1997) (A) and trapping sessions (spring and autumn, 1995 – 1997) (B) at our small study sites (urban: Beck Lake Forest Preserve, Cook County; suburban: Burnidge Forest Preserve, Kane County; rural: Hampshire Forest Preserve, Kane County) in northeastern Illinois.
petitively exclude smaller mesopredators from anthropogenic resources. However, Totton et al. (2002) observed no antagonism between raccoons and skunks feeding concurrently at a rural garbage dump, and we observed few antagonistic interactions between these species (S.D. Gehrt, unpublished data). Differences in intraspecific tolerance may also affect how anthropogenic resources are utilized. Although all 3 species are considered solitary, raccoons exhibit plasticity in their social behavior (Gehrt and Fritzell 1998a). Although in some systems female raccoons maintain minimum distances from one another (Mech et al. 1966; Schneider et al. 1971), highly aggregated distributions occur in other systems, including urbanized areas, apparently in response to resource
abundance and distribution (Gehrt and Fritzell 1998a; Prange et al. 2004). It was not uncommon to observe 3–7 raccoons at a single picnic area, often feeding in close proximity to one another (Prange et al. 2004). Information concerning social behavior of opossums and skunks in urbanized systems is lacking, but we did not observe similar aggregations of these species (S.D. Gehrt, unpublished data). In addition to plasticity in social behavior, raccoons may possess a greater flexibility in their foraging behavior, owing to their ability to learn to exploit new food sources (Dalgish and Anderson 1979). Feeding-group formation by raccoons may also facilitate the discovery of new food sources. Use of anthropogenic resources by opossums and skunks may be more opportunistic, occurring only when these resources are © 2004 NRC Canada
Prange and Gehrt
1813
Fig. 5. Road-kill indices (road-kills/1000 km) for raccoons (A), opossums (B), and skunks (C) at our small study sites (urban: Beck Lake Forest Preserve, Cook County; suburban: Burnidge Forest Preserve, Kane County; rural: Hampshire Forest Preserve, Kane County) in northeastern Illinois by season (Sp, spring; Su, summer; Au, autumn; Wi, winter). Note that the scale differs for each species.
encountered during normal foraging activities. The involvement of learning in foraging behavior coupled with the formation of extended familial bonds may further contribute to the raccoons’ enhanced response to urbanization. Gehrt (2004) suggested that cultural inheritance, or the passing of knowledge from one generation to the next, might explain why raccoons are more efficient than other mesopredators at exploiting urban environments. Juvenile raccoons may maintain familial relationships for almost a year (Gehrt and
Fritzell 1998b). During this time they may travel with their mother (Schneider et al. 1971; Gehrt and Fritzell 1998b) and thus learn behaviors from her, including the use of refuse. Juvenile skunks and opossums have a much shorter period of association with their mother (Verts 1967; Gillette 1980; S.D. Gehrt, unpublished data) and therefore have less of an opportunity to learn from her experience. Factors other than differences in anthropogenic-resource use may have contributed to differences in mesopredator© 2004 NRC Canada
1814
Can. J. Zool. Vol. 82, 2004
Fig. 6. Capture rates (captures/100 trap-nights) for raccoons (A) and opossums (B) at our small study sites (urban: Beck Lake Forest Preserve, Cook County; suburban: Burnidge Forest Preserve, Kane County; and rural: Hampshire Forest Preserve, Kane County) in northeastern Illinois in spring (Sp) and autumn (Au). Note that the scale differs for each species.
community structure. Regardless of the extent to which anthropogenic resources are exploited, opossums in this area may be unable to respond to urbanization to the extent that raccoons do. At northern latitudes, population size is highest during autumn because of annual recruitment and drops to a low in late winter, owing to over-winter mortality (Gardner 1982; Seidensticker et al. 1987). These annual population fluctuations were likely responsible for the autumnal increases in the relative proportions of opossums that we observed. Annual mortality rates for opossums may be quite high, with few individuals surviving longer than 1 year (Llewellyn and Dale 1964; Gillette 1980). However, if opossums exploited anthropogenic resources as efficiently as raccoons, including the use of man-made structures as den sites, then their chances of over-winter survival might be improved. Another potential factor is the increased likelihood of the transmission of diseases and parasites in areas with dense raccoon populations. Raccoons may serve as reservoirs of numerous diseases (Bigler et al. 1975; Rosatte et al. 1991) and parasites (Kazacos 1982), particularly where populations are dense (Page et al. 2001). Seroprevalence of canine distemper and leptospirosis was quite high in our urban raccoon
populations (S.D. Gehrt, unpublished data). Although information concerning interspecific disease or parasite transmission among these mesopredators is lacking, raccoontransmitted pathogens have been shown to impact other species. For example, the raccoon roundworm (Baylisascaris procyonis (Stefanski and Zarnowski, 1951)), which is benign in raccoons but highly pathogenic in other hosts, has been implicated in the decline of the Allegheny woodrat (Neotoma magister Baird, 1857; LoGiudice 2001, 2003). The greater likelihood of disease and parasite transmission in areas with dense raccoon populations potentially affects skunk and opossum populations as well. Differential predation may also play a role in mesopredatorcommunity structure. Through radiotelemetry, we documented cause-specific mortality rates for skunks at our large urban site and for raccoons at all of our large sites. Predation was not a major mortality factor for raccoons at any site (