Keil, S., D. Parris, R. Cobb, A. Edwards & R. McAllister, Too little, too late: Provision of ..... Stein, B.E., P.J. Laurienti, T.R. Stanford & M.T. Wallace. Neural ...
Developing an Interactive Overview for Non-Visual Exploration of Tabular Numerical Information
Johan Kildal
Submitted for the Degree of Doctor of Philosophy
Department of Computing Science, University of Glasgow September 2008
Abstract This thesis investigates the problem of obtaining overview information from complex tabular numerical data sets non-visually. Blind and visually impaired people need to access and analyse numerical data, both in education and in professional occupations. Obtaining an overview is a necessary first step in data analysis, for which current non-visual data accessibility methods offer little support. This thesis describes a new interactive parametric sonification technique called High-Density Sonification (HDS), which facilitates the process of extracting overview information from the data easily and efficiently by rendering multiple data points as single auditory events. Beyond obtaining an overview of the data, experimental studies showed that the capabilities of human auditory perception and cognition to extract meaning from HDS representations could be used to reliably estimate relative arithmetic mean values within large tabular data sets. Following a user-centred design methodology, HDS was implemented as the primary form of overview information display in a multimodal interface called TableVis. This interface supports the active process of interactive data exploration non-visually, making use of proprioception to maintain contextual information during exploration (non-visual focus+context), vibrotactile data annotations (EMA-Tactons) that can be used as external memory aids to prevent high mental workload levels, and speech synthesis to access detailed information on demand. A series of empirical studies was conducted to quantify the performance attained in the exploration of tabular data sets for overview information using TableVis. This was done by comparing HDS with the main current non-visual accessibility technique (speech synthesis), and by quantifying the effect of different sizes of data sets on user performance, which showed that HDS resulted in better performance than speech, and that this performance was not heavily dependent on the size of the data set. In addition, levels of subjective workload during exploration tasks using TableVis were investigated, resulting in the proposal of EMA-Tactons, vibrotactile annotations that the user can add to the data in order to prevent working memory saturation in the most demanding data exploration scenarios. An experimental evaluation found that EMA-Tactons significantly reduced mental workload in data exploration tasks. Thus, the work described in this thesis provides a basis for the interactive non-visual exploration of a broad range of sizes of numerical data tables by offering techniques to extract overview information quickly, performing perceptual estimations of data descriptors (relative arithmetic mean) and managing demands on mental workload through vibrotactile data annotations, while seamlessly linking with explorations at different levels of detail and preserving spatial data representation metaphors to support collaboration with sighted users.
ii
Table of Contents CHAPTER 1 INTRODUCTION
1
1.1
MOTIVATION OF THE THESIS
1
1.2
AIMS OF THE THESIS
3
1.3
TERMINOLOGY
4
1.4
THESIS STRUCTURE
6
CHAPTER 2 LITERATURE REVIEW
8
2.1
8
BROWSING FOR OVERVIEW INFORMATION IN DATA EXPLORATIONS
2.1.1
THE IMPORTANCE OF OBTAINING AN OVERVIEW
2.1.2
BROWSING DATA SETS
2.2
8 10
REVIEW OF CURRENT ACCESSIBILITY TOOLS FOR DATA EXPLORATION BY BLIND AND VISUALLY IMPAIRED USERS
11
2.2.1
SCREEN READERS, SPEECH SYNTHESIS AND REFRESHABLE BRAILLE DISPLAYS
11
2.2.2
SCREEN MAGNIFIERS
12
2.2.3
BRAILLE PRINT-OUTS, RAISED PAPER AND EMBOSSING FILM
13
2.2.4
HAPTIC TECHNOLOGIES
15
2.2.5
AUDITORY DISPLAYS USING NON-SPEECH SOUNDS
17
2.3
CURRENT RESEARCH ON NON-VISUAL PRESENTATION OF NUMERICAL INFORMATION
17
2.3.1
HAPTIC ACCESS TO NUMERICAL INFORMATION
18
2.3.2
AUDITORY DISPLAYS TO PRESENT NUMERICAL INFORMATION
20
2.4
CONCLUSIONS
24
CHAPTER 3 REQUIREMENTS CAPTURE
25
3.1
INTRODUCTION
25
3.2
STAKEHOLDERS
26
3.3
FOCUS GROUPS AND INTERVIEWS
26
3.3.1
WHERE AND WHEN GRAPHS AND TABLES ARE ENCOUNTERED
27
3.3.2
HOW GRAPHS AND TABLES ARE NORMALLY ACCESSED
27
3.3.3
GENERAL VIEWS AND EXPERIENCES OF USING GRAPHS AND TABLES
27
3.3.4
PERCEIVED USEFULNESS OF GRAPHS AND TABLES
28
iii
3.3.5
PROBLEMS ENCOUNTERED AND BARRIERS TO ACCESSIBILITY
28
3.3.6
TOOLS USED TO ACCESS GRAPHS AND TABLES: BENEFITS AND DRAWBACKS
29
3.3.7
STRATEGIES EMPLOYED WHEN USING ACCESSIBILITY TOOLS
30
3.3.8
SUMMARY
30
3.4
CLASSROOM OBSERVATIONS
31
3.4.1
REQUIREMENTS OF THE SCHOOL CURRICULUM
31
3.4.2
WAYS OF ACCESSING NUMERICAL DATA AND DIFFICULTIES ENCOUNTERED
31
3.4.3
SUMMARY
32
3.5
ADDITIONAL REQUIREMENTS
32
3.5.1
ABILITY TO COLLABORATE WITH SIGHTED COLLEAGUES
33
3.5.2
CONTROLLING THE EXPLORATION AND ACCESSING DETAILS ON DEMAND
33
3.5.3
ABILITY TO DEAL WITH REAL-WORLD DATA
33
3.5.4
SIMPLICITY AND AFFORDABILITY
34
3.6
CONCLUSIONS AND SUMMARY OF REQUIREMENTS
34
CHAPTER 4 HIGH-DENSITY SONIFICATION (HDS) AND ITS IMPLEMENTATION IN TABLEVIS
37
4.1
INTRODUCTION
37
4.2
DATA SETS CONSIDERED IN THIS THESIS
37
4.2.1
WHY NUMERICAL DATA TABLES?
38
4.2.2
WHICH NUMERICAL DATA TABLES?
38
HIGH-DENSITY SONIFICATION (HDS)
39
4.3 4.3.1 4.4
GENERAL DEFINITION OF HIGH-DENSITY SONIFICATION (HDS)
41
IMPLEMENTATION OF HDS IN TABLEVIS
41
4.4.1
GROUPING DATA TO RENDER WITH HDS
41
4.4.2
PARAMETRIC SONIFICATION
44
4.5
INTERACTION IN TABLEVIS
47
4.5.1
INTERACTION DESIGN PREMISES
48
4.5.2
SUPPORT FOR FOCUS+CONTEXT
49
4.5.3
GENERATING DATA SONIFICATIONS INTERACTIVELY
51
4.5.4
ACCESSING HIGHER LEVELS OF DETAIL
52
4.5.5
DESIGN LIMITATIONS
53
4.6
PROTOTYPE EVALUATION OF TABLEVIS
54
4.6.1
PARTICIPANTS
55
4.6.2
DATA SETS
55
4.6.3
PROCEDURE
55
iv
4.6.4
QUALITATIVE FEEDBACK
56
4.6.5
DISCUSSION
57
CONCLUSIONS
58
4.7
CHAPTER 5 TABLEVIS AND HDS: QUANTITATIVE AND QUALITATIVE EVALUATIONS
60
5.1
INTRODUCTION
60
5.2
EXPERIMENTAL STUDY
60
5.2.1
DESIGN OF THE EXPERIMENT
61
5.2.2
HYPOTHESES
64
5.2.3
DATA SETS
64
5.2.4
PARTICIPANTS
64
5.2.5
RESULTS
65
5.2.6
DISCUSSION
67
5.3
ANALYSIS OF EXPLORATORY STRATEGIES & PROCEDURES
68
5.3.1
STAGES OF AN EXPLORATION
69
5.3.2
EXPLORATORY STRATEGIES AND PROCEDURES
71
5.3.3
SOME COMMON PROBLEMS
78
5.4
CONCLUSIONS
79
CHAPTER 6 EFFECT OF TABLE SIZE IN THE USE OF TABLEVIS
81
6.1
INTRODUCTION
81
6.2
EXPERIMENTAL STUDY
82
6.2.1
DESIGN OF THE EXPERIMENT
82
6.2.2
DATA SETS AND TASKS
83
6.2.3
PARTICIPANTS
86
6.2.4
RESULTS
86
DISCUSSION
90
6.3 6.3.1
EFFECT OF TABLE SIZE
90
6.3.2
OTHER OBSERVATIONS
92
6.3.3
COMPARISON OF POPULATIONS
93
6.4
LIMITATIONS OF THIS STUDY
95
6.5
CONCLUSIONS
95
6.5.1
EFFECT OF TABLE SIZE
96
6.5.2
COMPARISON OF POPULATIONS
97
v
6.5.3
OTHER OBSERVATIONS
97
CHAPTER 7 EMA-TACTONS
99
7.1
INTRODUCTION
99
7.2
DESCRIPTION OF THE PROBLEM
99
7.2.1
FACTORS INFLUENCING MEMORY OVERLOAD IN TABLEVIS EXPLORATIONS
100
7.3
REQUIREMENTS FOR THE DESIGN OF EXTERNAL MEMORY AIDS
101
7.4
DESIGN AND IMPLEMENTATION OF EMA-TACTONS
105
7.5
PILOT STUDY
108
7.5.1
DESIGN OF THE STUDY
108
7.5.2
DATA SETS AND EXPLORATION TASKS
109
7.6
EXPERIMENTAL EVALUATION OF THE FIRST PROTOTYPE
110
7.6.1
EXPERIMENTAL CONDITIONS
110
7.6.2
PARTICIPANTS
111
7.6.3
PROCEDURE
111
7.6.4
DATA SETS
113
7.6.5
EXPERIMENT HYPOTHESES AND METRICS
113
7.6.6
RESULTS
115
7.6.7
DISCUSSION
117
7.7
PROTOTYPE REDESIGN
118
7.8
EVALUATION OF SECOND PROTOTYPE
121
7.8.1
DESCRIPTION OF THE EXPERIMENT
121
7.8.2
RESULTS
123
7.8.3
DISCUSSION
124
7.9
RE-EVALUATION OF THE SECOND PROTOTYPE
125
7.9.1
ANALYSIS OF NEW FACTORS TO CONSIDER IN THIS STUDY
125
7.9.2
DESCRIPTION OF THE EXPERIMENT
127
7.9.3
RESULTS
129
7.9.4
DISCUSSION
130
7.10 CONCLUSIONS
131
CHAPTER 8 UNDERSTANDING PERCEPTUAL AND COGNITIVE ASPECTS OF HDS
133
8.1
INTRODUCTION
133
8.2
FIRST EXPERIMENTAL STUDY
136
vi
8.2.1
DESIGN OF THE STUDY
8.2.2
STIMULI 137
8.2.3
PARTICIPANTS
140
8.2.4
RESULTS
141
8.2.5
DISCUSSION
141
8.3
SECOND EXPERIMENTAL STUDY
136
144
8.3.1
THE EXPERIMENT
144
8.3.2
STIMULI
144
8.3.3
PARTICIPANTS
147
8.3.4
RESULTS
147
8.3.5
DISCUSSION
151
8.4
THIRD EXPERIMENTAL STUDY
154
8.4.1
EXPERIMENT DESIGN
155
8.4.2
STIMULI
156
8.4.3
PARTICIPANTS
157
8.4.4
RESULTS
158
8.4.5
DISCUSSION
159
8.5
LIMITATIONS
162
8.6
CONCLUSIONS
163
CHAPTER 9 CONCLUSIONS
165
9.1
INTRODUCTION
165
9.2
SUMMARY OF THE THESIS
166
9.2.1
RESEARCH QUESTION 1
168
9.2.2
RESEARCH QUESTION 2
172
9.3 9.3.1
GUIDELINES GUIDELINES FOR THE DESIGN OF INTERFACES TO FACILITATE NON-VISUAL EXPLORATION OF TABULAR NUMERICAL DATA
9.3.2
175
GUIDELINES FOR THE DESIGN OF EMAS FOR DATA EXPLORATION INTERFACES
175 176
9.4
LIMITATIONS AND FUTURE WORK
177
9.5
FINAL REMARKS
179
APPENDICES
181
REFERENCES
182
vii
List of Tables Table 1. Summary of the data sets utilised to evaluate qualitatively the first prototype of TableVis
55
Table 2. Table showing the attributes and descriptions of modified NASA TLX workload questionnaires used in the experiment.
63
Table 3. Order in which the three conditions were presented to each of the 6 groups of participants. 83 Table 4. Summary of the three table sizes, showing the number of rows, columns and cells, as well as the time scales used for each axis in each case. Table 5. Requirements for annotation tools to be used in TableVis.
84 103
Table 6. Reliability of using HDS as a way of estimating relative arithmetic means of sets of numbers, according to results from the three previous studies with TableVis.
134
Table 7. Effect of the size of the table explored in effectiveness, efficiency and subjective workload, using hds in tablevis
174
viii
List of Figures Figure 1. Bar chart constructed with embossed graph paper, pins and rubber bands.
14
Figure 2. Example of a bar chart printed on raised paper.
15
Figure 3. Close up of a pin array from VirTouch’s VTPlayer mouse.
16
Figure 4. Reference model for the creations of visualisations from raw data.
38
Figure 5. Data subset patterns for canonical HDS of 2d-tables and 3d-tables.
43
Figure 6. Graphics tablet augmented with a tangible frame delimiting the working area..
49
Figure 7. The data table to be explored is presented on the active area of the tablet, scaled to fill it completely. Figure 8. Input device (Griffin Technology’s Powermate).
50 58
Figure 9. Examples of data tables in which different numbers of MSDs are required to identify the trend that the values in the table follow.
62
Figure 10. Efficiency in task completion for each condition
65
Figure 11. Effectiveness in task completion for each condition
66
Figure 12. For each condition, average scores of subjective overall workload
66
Figure 13. Mean values for modified NASA-TLX workload data for explorations using HDS and speech.
67
Figure 14. Steps in the exploration of a numerical data table, grouped in three stages and by type of information processed in each step.
70
Figure 15. Traces of all 12 explorations by 8 participants (4 blind and 4 partially sighted) in the HDS mode.
72
Figure 16. Example of the singular use of variable speed of scan.
73
Figure 17. Typical example of a search for a row.
74
Figure 18. Example of table exploration in rows and columns modes, in which each scan does not start at the top left corner.
75
Figure 19. Typical example of the use of speech details-on-demand.
77
Figure 20. Visual representation of the relative sizes of the three tables selected for this study.
84
Figure 21. Representation of ratios between table sizes.
85
Figure 22. Actual dimensions of a cell for the three sizes of table when mapped on a wacom graphire3 a5 (g-630) graphics tablet, as used in this experiment.
85
Figure 23. Average time for exploration of tables, in the three table size conditions.
86
Figure 24. Task solving accuracy in the three table size.
87
Figure 25. Overall subjective workload in the modified NASA-TLX scales, in the three table size conditions.
88
Figure 26. Mean values for modified NASA-TLX workload data in explorations of three different table sizes.
89
Figure 27. Comparison of performance by a population of sighted-blindfolded and of visually impaired participants, exploring for overview information with tablevis.
89
ix
Figure 28. Results from the three partially-sighted users that took part in this experiment.
90
Figure 29. Trajectory of the pen traversing three times a table with four rows, without lifting the pen from the surface of the tablet.
93
Figure 30. Excerpt from the collection of hand-annotated numerical tables used by the german composer karlheinz stockhausen (1928-2007) to construct his electronic composition “Etude” (1952).
101
Figure 31. Hand-annotated basis-weight analysis report of paper production samples from a paper machine (2007).
102
Figure 32. Tactaid VBW32 transducer mounted on the pen of the tablet.
106
Figure 33. Setup for the EMA-Tactons experiment.
112
Figure 34. Graphic representation of the relative arithmetic means of the values in the 24 columns of the data sets used.
113
Figure 35. Evaluation of the first EMA-Tactons prototype. Summary of results.
115
Figure 36. Results from the two blind users in the prototype evaluation.
116
Figure 37. Subjective overall workload, from the modified NASA-TLX questionnaires.
116
Figure 38. Graphic representation of temporally-synchronised audio and vibrotactile stimuli in the redesigned version of binary EMA-Tactons, as implemented in tablevis.
121
Figure 39. Graphic representation of both versions of EMA-Tactons as implemented in tablevis.
122
Figure 40. Evaluation of the second EMA-Tactons prototype. Summary of results.
123
Figure 41. Comparison of average subjective overall workloads between the groups of sightedblindfolded participants in the evaluations of the first and the second.
125
Figure 42. Comparison of pitch spaces between both evaluations of the second prototype.
128
Figure 43. Modified evaluation of the second EMA-Tactons prototype.
129
Figure 44. Comparison of average subjective overall workloads between the groups of sightedblindfolded participants in the evaluations of the first and the second prototype. Figure 45. Average time to complete the task in the three experiments.
130 131
Figure 46. Stages in the process of performing basic statistical analysis from tabular numerical data, using HDS.
135
Figure 47. Graphic representation of the families of pairs of chords used as stimuli in the first experiment. Figure 48. Waveform of a pair of chords in the first experiment.
139 140
Figure 49. Scatter plot summarising the results from the first experimental study for each family of pairs of chords.
142
Figure 50. Average number of times stimuli from each family were accessed before an answer was selected
143
Figure 51. Graphic representation of the families of pairs of chords used as stimuli in the second experiment.
146
Figure 52. Scatter plot showing the average correctness of the answers to the experimental task, grouped by family of pairs of chords.
148
x
Figure 53. Scatter plot showing the average number of times participants listened to each pair of chords before selecting an answer.
149
Figure 54. Comparison between the average correctness scores obtained in the first experimental study (visually impaired participants) and in the experiment (sighted participants).
151
Figure 55. Examples of grouping by proximity in internal voices of chords.
154
Figure 56. Screenshot of the interface used to run the third experiment
156
Figure 57. Wave form of a typical pair of chords in the experiment.
157
Figure 58. Percentage of participants that considered POP moving upwards in each pair of chords
160
Figure 59. Scatter plot showing, for each pair of chords with different arithmetic means, the proportion of participants that reported the pop to be moving upwards and whether that judgement was a correct estimation.
161
Figure 60. For each pair of chords in which the arithmetic mean remained constant, percentage of participants that reported pop to be moving upwards.
162
xi
Acknowledgements Firstly, I would like to thank my supervisor, Professor Stephen Brewster, for his help, encouragement and invaluable advice over the course of this research project. I would also like to thank my second supervisor, Dr Helen Purchase. Thanks are also due to Professor Stephen McAdams at McGill University, Montreal. I am also grateful to my colleagues in the Multimodal Interaction Group at the Department of Computing Science, University of Glasgow. In particular, I want to thank Dr. Andrew Crossan, Dr. David McGookin and Dr. Steven Wall, for many interesting research related discussions over the course of these years. I would also like to acknowledge my examiners, Professor Roderick Murray-Smith and Dr. Robert Stevens, for their constructive feedback. Particular thanks go to the students at the Royal National College for the Blind in Hereford, the Royal Blind School in Edinburgh, and Uddingston Grammar School in Glasgow, who participated in the requirements capture process and experimental studies for this thesis. Thanks are also due to the staff of these institutions and of the Royal National Institute for Blind People. I would also like to acknowledge the Ken Browning scholarship fund, which supported my placement at McGill University. Additionally, I want mention the support received in the final stages from my colleagues at Nokia Research Center in Finland. In particular, I want to thank Martin Schrader and Jari Kangas, Jyri Huopaniemi, Vuokko Lantz and my colleagues in the IC and MMI teams. Last but not least, I cannot overstate the importance of the support received from the people that have been on my side during the years that took to complete this piece of work. My biggest thanks go to Dr. Louisa Gairn, whose care and understanding have seen no limits. I am also hugely grateful to her parents, Margaret and Jim. Similarly, my parents, Johan and Axun, have been, as always before, of inestimable help and support, and for that I cannot be thankful enough. I also want to most dearly thank my three sisters (Karen, Liv and Anne) for so much care and worry. Finally, I must not forget to mention the names of Frode Laursen and Katrin Kirm, and to also extend my sincere thanks to my dear friends, whose friendship I have always carried with me while away from home. This research was supported by EPSRC Grant GR/S86150/01 as part of the MultiVis Project.
xii
Dedication To my father and friend Johan, who is an example of integrity and courage that I am always safe in trying to follow. Eskerrik asko, Aitatxo.
xiii
Declaration The material presented in this thesis is the result of my own research carried out at the Department of Computing Science at the University of Glasgow working under the supervision of Professor Stephen Brewster and Doctor Helen Purchase. The work contained in Chapter 4 has been published as Kildal & Brewster at CHI2006 [82]. The work contained in Chapter 5 has been published at CHI2007 [85]. The work contained in Chapter 6 has been published in the International Journal on Disability and Human Development [81] and in ICAD2006 [83]. Work contained in Chapter 7 has been published at INTERACT 2007 [84]. This thesis exploits only the parts of those publications directly attributable to the first author.
81. 82. 83. 84. 85.
Kildal, J. and S.A. Brewster, Exploratory Strategies and Procedures to Obtain Non-Visual Overviews Using TableVis. International Journal on Disability and Human Development, 2006. 5(3): p. 285-294. Kildal, J. and S.A. Brewster. Non-visual Overviews of Complex Data Sets. in Extended Abstracts of CHI 2006. 2006. Montreal, Quèbec, Canada: ACM Press. Kildal, J. and S.A. Brewster. Providing a Size-Independent Overview of Non-Visual Tables. in 12th International Conference on Auditory Display (ICAD2006). 2006. Queen Mary, University of London. Kildal, J. and S.A. Brewster. EMA-Tactons: Vibrotactile External Memory Aids in an Auditory Display. in IFIP Interact 2007. 2007. Rio de Janeiro, Brasil. Kildal, J. and S.A. Brewster, Interactive Generation of Overview Information Using Speech, in CHI '07 extended abstracts on Human factors in computing systems. 2007, ACM Press: San Jose, CA, USA. p. 2489-2494.
xiv
Chapter 1 Introduction 1.1 Motivation of the Thesis The World Health Organization reports that in 2002 the number of people with visual impairment worldwide was in excess of 161 million, of whom about 37 million were blind; in Europe alone, the population of blind and visually-impaired people was estimated at 15.5 million [124]. The United Nations Convention on the Rights of Disabled Persons (2006) sets out the obligation for governments to ensure that people with disabilities can enjoy real equality in society. As part of this requirement, UN member states are requested to take measures to ensure accessibility of the physical environment and information and communications technology [1]. In line with this, and other legislation such as the UK’s Disability Discrimination Act (1995), governments, employers and educators are now obligated to provide equality of opportunity to disabled people, including those who are blind and visually impaired. Advances in information technology in the last decades have contributed enormously to making information more accessible for users who are blind or visually impaired. The advent of screen reading technology, the generalisation of personal computers for work, study and leisure, and the democratisation of information availability though the internet, has drawn a new scenario in which information is, by and large, far more accessible in non-visual forms. However, in spite of this technological revolution and the accessibility policies now in force, there still exist significant barriers for blind and partially-sighted users to access many of the most common types of information. One example of particular concern in this thesis is access to numerical data sets. In the case of sighted users, highly-specialised data visualisations (designed to exploit human vision and visual information processing) provide quick and easy access to overview information and help with the performance of various aspects of data analysis, such as identifying trends, patterns and singular features that might be of interest. Understanding and analysing information using visualisations such as graphs, bar charts and 3dimensional (3D) plots is a common task for sighted people. The skills needed are learned early in school and then used throughout life. More importantly, the basic skills needed for creating and interpreting graphs are necessary for many aspects of education and employment. So ubiquitous has the use of such visualisation techniques become that an estimated 2.2 trillion graphs were published in 1994 alone (not including graphs displayed on television or computer terminals) [76]. Recent studies have found that subjects such as business management and accounting, information technology and computing science, and social and applied sciences are popular choices amongst blind and visually impaired students in UK higher education [60]. However, blind people have very restricted access to information presented in the data visualisations commonly utilised in the study of these subjects. While the majority of blind and visually impaired computer users utilise computers for word processing, email and web access, a significant percentage also regularly deal with spreadsheets and databases – more than one third of working-age blind adults, according to a 2007 survey [42]. The lack of accessibility tools to support obtaining quick overviews of data sets non-visually has serious implications for people who are blind or visually
1
impaired, limiting their freedom to decide about their studies or professional careers – a freedom which is now protected as a human right by the United Nations, European Union and national governments [169]. Not only do such barriers prevent blind and visually impaired people from fulfilling their potential and contributing to society in their chosen field of study, lack of access to employment also affects their sense of personal identity, status and self-respect [152]. A report commissioned by the Royal National Institute for Blind People found that 75% of blind and partially sighted people in the UK were unemployed in 2002 [126]. While several sociopolitical factors including workplace discrimination have been hypothesised as contributing to this statistic, research also suggests that educational attainment, supported by appropriate and accessible technologies, is a key factor influencing employment for blind and visually impaired people [117]. In order to ensure blind and visually impaired people have equality of educational opportunity, as well as the freedom to pursue a career in a scientific or financial discipline, new technologies need to be developed to make numerical data accessible nonvisually. Various computer-based accessibility technologies for visually impaired users already exist, such as screen readers, refreshable Braille displays, pin arrays and haptic interfaces such as SensAble Technology’s PHANTOM force-feedback device [137]. However, these are subject to a number of limitations for exploring numerical data sets. While such technologies provide access to computer based information non-visually, they do so by presenting information in full detail and often sequentially, with little or no support to obtain overview information quickly and easily at the beginning of the exploration of a new data set. As Shneiderman [138] asserts, any data exploration begins by obtaining an overview, to be followed by zooming and filtering operations, with detailed data available on demand by the user, in order to avoid saturation of the working memory. In addition to the potential benefits the development of such technologies would bring to blind and visually impaired people, such research can also contribute to interface improvements for all users. As Newell [112] has postulated, the “extra-ordinary needs [of disabled people] are only exaggerated ordinary needs”, thus interfaces designed for disabled people, including the blind and visually impaired, may also have applications for other users, either in the general populace or in specific circumstances such as fatigue or “high workload environments”, where the number of tasks required and quantity of data the user must assimilate exceeds the “input and output bandwidths” available to her. Besides the need to develop non-visual techniques to browse data sets so that blind and visually impaired users can access them efficiently, these techniques can also be useful for sighted users under certain circumstances. For instance, situations in which the user’s visual channel is busy with some monitoring or controlling task and accessing other visual information could lead to making mistakes, or even be dangerous. Mobile and handheld devices with small screens that are often accessed while walking on the street could also benefit from non-visual data representations. Unlike other media, a radio program cannot display visual data representations to its audience, and doing so with speech only may not be the most efficient way. Hence, these kinds of media could potentially benefit from non-visual data representations, for example to summarise information about weather or the economy. In addition, some data sets, like temporal data and large collections of scientific data, are easier to deal with when presented on auditory displays as Kramer and Walker illustrate with several examples from the literature [86, 164].
2
Therefore, visualisations alone are not always the best choice for data perceptualisation, and representations in modalities other than visual can be of as much interest for the sighted user as for the visually impaired. As Vanderheiden [157] observes, it is often the case that information presented through visual display “is not itself visual in nature, but is simply displayed visually for sighted users”. Instead of producing what Roberts [129] calls “equivalence designs”, it is interesting to consider whether certain types of data can be represented through techniques which do not directly translate a visual metaphor (such as a graph or diagram) into another modality since, “by focusing on an equivalent design, the temptation – and perhaps the consequence – is to recreate the design itself rather than representing the underlying phenomena’s aspects”. In this sense, there is, strictly speaking, nothing essentially spatial about a data set except for the fact that to present the raw data visually on some print medium a certain amount of physical space is required. Information visualisation techniques are designed to lay out data in the physical space so that mathematical or logical relations between data points become apparent. Those relations, however, are generally abstract and as such the spatial attributes are intrinsic to the visual representation and not to the data themselves. This thesis investigates the problem of obtaining overview information from complex numerical data sets non-visually, with a focus on tabular data structures which form an intermediate stage between raw data and data representations such as graphs, as it will be justified in Section 4.2.1. As such, non-visual representation techniques are investigated, which exploit the properties of the sensory channels involved (auditory, proprioceptive and cutaneous, and the interactions between them). In doing so, however, the essential spatial attributes of data in visual representations are preserved in order to provide a “common language” across different representations, and thus facilitate collaboration. Although primarily directed to the blind and visually impaired community, the author hopes that some of the findings can benefit sighted users as well.
1.2 Aims of the Thesis Thesis Statement: Obtaining an overview is a necessary first step in data analysis, for which current non-visual data accessibility methods offer little support. High-Density Sonification, in combination with proprioception and vibrotactile cues, forms a non-visual multimodal interaction technique that permits a user to extract overview information from tabular data sets efficiently and effectively. This thesis investigates the problem of obtaining overview information from complex numerical data sets nonvisually. In an attempt to reconcile the spatial metaphors employed in visual data representations with intrinsically non-visual forms of data representation, the work in this thesis focuses on the particular case of tabular numerical data structures, a middle ground between the raw data and the data perceptualisations constructed from them. This problem is addressed by focusing on the following thesis research questions:
RQ-1.
How can overview information from tabular numerical data sets be obtained non-visually?
RQ-2.
What level of performance can be achieved with the techniques proposed in this thesis?
3
RQ1 is addressed by combining a literature review with a user-centred design methodology, which results in the proposal of High-Density Sonification (HDS), a novel technique to extract overview information from tabular data interactively. HDS is implemented in TableVis, a multimodal interface in which the user maintains contextual information through proprioception and where vibrotactile cues can be used as external memory aids to annotate data and prevent high mental workload levels. To address RQ2, a series of empirical studies is conducted, quantifying the performance attained in the exploration of tabular data sets for overview information. This is done by comparing HDS with the main current non-visual accessibility technique (speech synthesis), and by quantifying the effect of different sizes of data sets on user performance. In addition, experimental studies are conducted to discover the capabilities of the human auditory system to extract meaning from auditory representations generated by HDS. Finally, levels of subjective workload during exploration tasks using TableVis are investigated, resulting in the proposal of EMA-Tactons, vibrotactile annotations that the user can add to the data in order to prevent working memory saturation in the most demanding data exploration scenarios. This work is novel in that it tackles the problem of obtaining overview information from complex numerical data sets efficiently, by taking an intrinsically non-visual approach in the solution proposed, while preserving spatial metaphors that are necessary for collaboration with users that utilize visual representations of the same data. A new data sonification technique is proposed (High-Density Sonification), which is also novel for permitting the representation of subsets of information in single auditory events, which can be compared against each other, revealing overview information and even enabling the user to perform basic statistical analysis of the data by exploiting properties of the human auditory system. In TableVis, the proposed multimodal interactive technique, a further contribution is the concept of EMA Tactons, a form of intrinsically non-visual data annotation which, through structured vibrotactile messages, support the user’s working memory during a cognitively-demanding exploration.
1.3 Terminology The English language offers a rich vocabulary to signify concepts related to accessing information in order to extract knowledge. “Explore”, “browse”, “analyse”, “search”, “seek”, “navigate”, “examine”, “look for”, and “data mine” are just a few examples, some of which are more commonly used than others in HCI, all with overlapping meanings and each with different connotations. In the literature relevant to this thesis, some of these terms are found to be used interchangeably and possibly subject to interpretation, influenced by previous uses of the terms. To make an informed decision about the term or terms to be used in this thesis, the Oxford English Dictionary (OED) [154] has been taken as the reference source for English language, and without reproducing verbatim its lengthy entries, the meanings of some of these terms are explained below and commented on in the context of this thesis:
4
•
Browse. Its original meaning was to “feed on the leaves and shoots of trees and bushes; to crop the shoots or tender parts of rough plants for food: said of goats, deer, cattle”. Regarding this first meaning, Cove & Walsh [36] comment that the term “…carries the connotation of selecting worthwhile and useful information” (p.31). From the late nineteenth century the term started to be used, by association, in the context of looking through collections of documents or even a single document. In any case, the meaning of browsing involved casually looking around in order to discover items of interest while sampling, especially without knowledge of what to look for beforehand, but without a clear objective or any plan as such.
•
Explore. To explore implies a stronger sense of purposeful search: “to investigate, seek to ascertain or find out” (e.g., to explore a possibility); “to look into closely, scrutinise” (e.g., to explore a problem); most recently, it came to mean “to search into or examine (a country, a place, etc.) by going through it; to go into or range over for the purpose of discovery”. Exploring involves having some kind of planned objective or particular aim for learning about what a system contains, and it leaves room for having a strategy to accomplish that objective.
•
Analyse. According to the OED, to analyse is “to take to pieces; to separate, distinguish, or ascertain the elements of anything complex, as a material collection, chemical compound, light, sound, a miscellaneous list, account or statement, a sentence, phrase, word, conception, feeling, action, process, etc.”. This separation of anything complex into its constituent parts, for the purpose of an examination of each separately involves taking a very close up look, retrieving every detail from that system.
•
Seek. Its main meaning is synonymous of “look for”: “To go in search or quest of; to try to find, look for (either a particular object, person, thing, or place whose whereabouts are unknown, or an indefinite object suitable for a particular purpose)”. It is a purposeful search for something specific known or expected to be somewhere in the system.
•
Search. “To go about (a country or place) in order to find, or to ascertain the presence or absence of, some person or thing; to explore in quest of some object”. Again, the user looks for something specific, the existence of which in the system searched in know or expected.
The most comprehensive of all the verbs listed above seems to be “to explore”, which can encompass both an overview-related approach and a more targeted one to specific information. For this reason, “data exploration” will be hereafter used to describe the complete process of approaching a data set and extracting the information relevant to the user. Among the other terms listed above, the most relevant one for the focus of this thesis on the stage of obtaining an overview is “to browse”. Examples of uses of “browsing” in the literature that are relevant to the work presented in the thesis are included in the next chapter. Before ending this section on terminology, it is worth also looking up the term “overview” in the OED, as a starting point to define it for this thesis:
5
•
Overview. After its original, obsolete meaning of “inspection, overseeing, supervision”, its 20th century meaning is the one relevant here: “A general survey; a comprehensive review of facts or ideas; a concise statement or outline of a subject. Also: a broad or overall view of a subject”.
By association, it can be applied to any collection of information as referring to a review or summary of the main features contained within it. The challenge is to define which of these features belong to this general survey and at what point the features are too detailed to be considered part of an overview. This thesis does not provide a general answer to this question, but it does offer insights into the nature of overview and detail in exploring tabular numerical data sets in Chapter 4.
1.4 Thesis Structure Chapter 2, Literature Review, reviews the literature on browsing for overview information. An overview of accessibility technologies for blind and visually impaired users is presented, followed by a discussion of previous research on non-visual techniques for the exploration of numerical data. Chapter 3, Requirements Capture, outlines the user-centred approach taken in the design of an interface to enable blind and visually impaired users to access numerical data non-visually. Feedback from focus groups, interviews and classroom observations is reported. Based on this, a set of requirements for consideration in the design of the solution is presented. Chapter 4, High-Density Sonification and its Implementation in TableVis, starts by discussing the scope of the data sets considered in this thesis. High-Density Sonification is then defined, both in its general form and in its implementation in TableVis. The design process for TableVis is justified, and the results of a pilot study for the evaluation of the interface are presented. Chapter 5, Quantitative and Qualitative Evaluations of TableVis and High-Density Sonification, compares performance in data exploration tasks carried out using High-Density Sonification and speech synthesis. Qualitative data collected from the pilot study are presented, providing an analysis of participants’ exploratory strategies and procedures. Chapter 6, The Effect of Table Size in the use of TableVis, presents an experimental study in which the main aim was to measure the effect of table size on user performance and subjective workload. The chapter concludes with a discussion of the experimental results, which provides evidence of the low impact of table size on these two metrics. Chapter 7, EMA Tactons describes data exploration scenarios in which users’ working memory reaches saturation. EMA Tactons are designed as external memory aids that the user can add as annotations to the data
6
to relieve cognitive demands. An iterative design and experimental evaluation process is described, which highlights some of the challenges of designing multimodal interaction techniques. Chapter 8, Understanding Perceptual and Cognitive Aspects of High-Density Sonification, reports an in-depth experimental study investigating the reliability with which relative arithmetic means can be estimated by accessing a collection of numbers in a single auditory event with High-Density Sonification. A series of experiments is reported, with which the reliability of this technique is quantified and discussed in terms of data configurations. Chapter 9, Discussion & Conclusions, summarises the work presented in this thesis, and relates the findings back to the research questions outlined in Chapter 1. It also sets out the findings in terms of a set of guidelines. The limitations of this research are identified, and suggestions for future work based on the issues raised by the thesis are proposed.
7
Chapter 2 Literature Review The previous chapter introduced the main research focus of this thesis, namely the investigation of non-visual techniques to obtain overview information of tabular numerical data. In order to design, implement and evaluate such techniques, it is important to understand the state of the art in this field of research and to know what accessibility solutions are already available as well as the support they offer for exploring numerical data. This chapter aims to provide answers to the first thesis research question, defined in Chapter 1: “How can overview information from tabular numerical data sets be obtained non-visually?”. The chapter therefore begins by discussing the importance of obtaining an overview as part of a general data browsing strategy. The main current accessibility tools available for blind and visually impaired computer users are then reviewed, and the chapter concludes with a review and discussion of previous research on representing numerical data nonvisually.
2.1 Browsing for Explorations
Overview
Information
in
Data
2.1.1 The importance of obtaining an overview A fundamental premise in this thesis is that obtaining an overview is an essential early stage in the exploration of any collection of information. This may not have to be done explicitly if the user is already familiar with the information being explored and therefore already in possession of the necessary overview information, but as a general case the user has to be able to obtain such overview information quickly and easily, as it is not practically possible to undertake detailed analysis without setting the scene first. The literature review in this section supports this idea, as it is widely proposed, that obtaining an overview should be the first step in any data exploration. Probably the most influential of such statements in HCI was proposed by Shneiderman in his Visual Information Seeking Mantra [138], where this process is expressed as: “overview first, zoom and filter, then details on demand”, where the function of each steps is summarised as: •
Overview (gain an overview of the entire collection);
•
Zoom (zoom in on items of interest);
•
Filter (filter out uninteresting items);
•
Details-on-demand (select an item or group and get details when needed).
Shneiderman’s influential statement was preceded in nearly three decades by Bertin [14] who, working in the field of visual representation of information using graphs, stated that general graph-reading operations were characterised by their level or scope, beginning with Overall (looking for overall structure), Intermediate (identifying trends); and finally Elementary (looking for specific, perhaps quantitative, information). Related to
8
this, and also preceding Shneiderman, is the concept of exploratory data analysis of scientific results developed by Tukey [153], who argued that before confirming features of a data set through statistical analysis, it is first essential to produce data overviews (particularly through visualizations such as graphs) which can simply and easily display general trends and highlight anomalies or unexpected results. Although Shneiderman formulated his mantra for visual information, this principle has since been extended to other modalities, including hearing, where it is asserted that any data exploration should always start by retrieving overview information. Zhao et al. [173] proposed an Auditory Information-Seeking Principle (AISP): “gist, navigate, filter, and details-on-demand”, suggesting that if information-seeking in the auditory mode follows the same pattern as in visual information-seeking, then the collaboration between visual users and auditory users might become easier. In more detail, Zhao defines each one of the stages in auditory informationseeking as follows: Gist: Quick grasp of the overall data trends and patterns from a short auditory message; Navigate: Fly through the data collection and closely examine portions of interest; Filter: Seek data items satisfying certain criteria; Details-on-demand: Obtain details of groups or an individual item for comparison. In the overview stage in AISP (which Zhao called “gist”), some characteristics of the approach chosen in this thesis are mentioned: an overview should be obtained quickly; in the case of an auditory overview, the auditory message should be short; finally, the overall information about a data set should inform about overall trends and patterns in the data. Continuing in the auditory domain, Pérez-Quiñones et al. [119] proposed another adapted version of Shneiderman’s Visual Information Seeking Mantra, for the particular context of exploring web pages using speech: Situate (help the user identify his or her location within the information space); Navigate (refers to the user’s movement within the information space or control of the interface); Query (enable the user to issue specific information requests); Details-on-demand (refers to user’s task where s/he requests more details on specific items). The “situate” stage is an important concept for this thesis, where the user needs to obtain an overview of an unknown collection of information, which depends upon being able to place data features within the context of the whole information space. For the exploration of large spatial data sets using data sonification, Saue [132] makes a simpler two-stage distinction between orientation (finding interesting regions) and analysis (investigation of these regions). In the exploration stage, Saue distinguishes four levels of detail the user focuses on: Global (the whole data set); Intermediate (one part of the data set); Local (a few data points); Point (a single data point). In all the above models of data exploration processes, the authors propose an initial overview of the data is required, before gradually focusing on the areas that are identified as of interest. This thesis adheres to this consensus by adopting this principle as a foundational guideline to provide non-visual access to tabular data. The requirements capture process that is reported in Chapter 3 provides further confirmation of the importance of this principle in explorations of numerical data sets by visually impaired users. Based on the premise that being able to obtain overview information is a prerequisite to being able to complete a data exploration efficiently, a lack of the appropriate tools and techniques to obtain an overview can be seen as a barrier to information accessibility. This barrier is probably less of a problem for small data sets, or for data collections
9
with which a user is already familiar; in the first case because the selection of relevant data has already taken place, and in the second because the user is already in possession of the overview information. However, once the data sets are of a larger size and higher complexity, and particularly when the user is not familiar with the data, not being able to obtain an overview can be a real barrier to complete the exploration. In the literature, the concept of browsing is closely related to the initial stage of data exploration to obtain overview information. The process of browsing a data set has received the attention of researchers, who have theorised about its purpose and structure. Relevant conclusions from reviewing this part of the literature are collected in the next sub-section.
2.1.2 Browsing data sets In the literature, browsing is identified as a process which takes place in the early stages of the exploration and provides overview information about the data set. Browsing takes place when a user needs to obtain an overview because she does not know what the data set contains. Thus, an initial overview will highlight the main features of the data and help to distinguish any anomalies or “outliers”, allowing the user to make decisions about the data, and about how to proceed with a more detailed analysis. According to Cove & Walsh [36], browsing “is related to searching where the initial search criteria are only partly defined (…). It is a purposeful activity occasioned by a felt information need or interest. In addition, because recognition is easier than recall (or not knowing), a further way of describing browsing is to say it is the art of not knowing what one wants until one finds it” (p.31). By this definition, browsing can be considered as a fairly common activity which humans use to explore the array of information available in the physical world, and it makes sense for browsing to be supported for man-made sets of information, as Marchionini [96] suggests: “Browsing is a natural and effective approach to many types of information-seeking problems. It is natural because it coordinates human physical, emotive, and cognitive resources in the same way that humans monitor the physical world and search for physical objects. It can be effective because the environment and particularly human-created environments are generally organized and highly redundant – especially information environments that are designed according to organizational principles” (p.100). However, Marchionini also notes, browsing for information retrieval can be subject to high attention demands and possible information overloads, depending on the nature of the task and the user’s individual differences. In an attempt to understand and provide structure to the process of browsing a data set, Kwasnik [90] proposed that browsing is a complex process that involves several functional components. These functional components may occur in any order and number of iterations during the browsing process. This means that browsing is not a passive activity. As Kwasnik says, the user “is in charge of the direction, pace, and depth of the search”. •
Orientation. Answers the question “where am I?”, and implies knowledge of the structure of the data set;
•
Comparison. Occurs throughout the entire browsing process. Values in the data set are compared to each other;
10
•
Place marking. Consists of defining “mental landmarks” with potentially interesting pieces of information for possible later re-consideration;
•
Identification. Confirmation or rejection of the mental landmarks identified during place marking, i.e. “Am I still interested in this?”
•
Transition. Movement from one value to another, in anticipation of a goal. It can also be movement away after identification and rejection, or after success or exhaustion of information;
•
Resolution of anomalies. People tend to give structure to the data as they browse, even if they do not need to, ignoring odd values that would spoil the structure that the user was expecting to find. It can be seen as a consequence of the wish to find the target.
This set of components will be revisited throughout this thesis, reflecting on the important fact that, as Kwasnik says, these components do not take place sequentially, but can appear in any order and any number of times throughout the iterative processes and sub-processes found during data exploration for overview information.
2.2 Review of current accessibility tools for exploration by blind and visually impaired users
data
A wide variety of accessibility tools has been developed to enable blind and visually impaired people to access information. This section reviews the accessibility tools and methods currently available and others in development with the intention of discerning the positive and negative attributes of each with respect to accessing numerical data, and in particular their suitability to provide overview information.
2.2.1 Screen readers, speech synthesis and refreshable Braille displays Screen readers are currently the most widely-used accessibility tools for blind and visually-impaired computer users. Offering output in both Braille and speech, screen readers gather the content of the computer screen from the computer’s operating system, converting this into computer-synthesised speech and/or Braille characters on a refreshable Braille display. The screen reader not only renders the text content of the visual display but also describes elements of the graphical user interface itself, such as scroll bars and windows. Screen reader (SR) applications are available for Microsoft Windows, Apple Mackintosh and Linux systems, however Freedom Scientific’s JAWS for Windows [135], GW Micro’s Windows-Eyes [62] and Dolphin’s SuperNova [40] are three of the most widely-used versions for English speakers worldwide. As reported by Stockman [147], most SR users demonstrate a preference for speech output, utilising either speech-only mode or Braille + speech as the output of the application, rather than Braille alone. Stockman suggests this can be attributed both to the expense of acquiring the hardware components necessary for Braille output and the lack of fluency in reading Braille amongst many blind and visually impaired users. Indeed, Braille literacy was reported to be as low as 10% among the blind and visually impaired population of the United States in the 1980s [2], declining to 9.45% in 1994 [133]. Braille reading rates average 104 words per minute for experienced adult users [52], a rate much slower in comparison to speech output (which enables rates of up to 400-600 words per minute [157]) and to average reading speeds of sighted readers (280 wpm for high school students) [150].
11
Screen readers are affordable, widely available, can be used with many documents that can be displayed on a computer screen and, particularly when in speech mode, provide fast access to the content of a document. However, while screen readers providing speech or Braille output offer good support for accessing text contained in web pages and word-processing documents, they are less effective in enabling users to access numerical data such as those contained in spreadsheets and other data sets [127] [55]. One of the main limitations of these existing tools is that they are mentally demanding and ill-suited for carrying out the functional components of browsing, as defined above. The screen reader only provides a sequential read-out of the data contained in the spreadsheet. In order to obtain an overview of an entire numerical data set, the user has to access each of the values in the set sequentially, compare each new value with all the previous ones, remembering, at least approximately, both value and position for all the data points. Even using small data sets, the user’s short term memory becomes saturated before the browsing task can be completed, since the number of units of information a person can maintain in their short-term memory at any one time is limited to between 5 and 9 [103]. As Ramloll et al. [123] observe for the case of tabular numerical data sets, when accessing them using speech synthesis the user’s navigational moves produce an overload of speech feedback and an overall picture of the data structure cannot be obtained. A similar conclusion could be expected when accessing numerical data sets using Braille displays [123]. Because of this, as Stockman [147] observes, “independent examination of spreadsheet data remains cumbersome and cognitively demanding for most speech-based SR users”, thus blind and visually impaired users often require sighted assistance when dealing with numerical data sets. There are many other accessibility tools based on speech technology, as reviewed by Freitas & Kouroupetroglou [55]. These range from simple speech output devices for everyday needs, such as talking thermometers, clocks and calculators, to handheld electronic text reading devices (also known as digital talking book players) which convert electronic text files to speech, where the files are stored on removable flash memory cards or downloaded from personal computers or the Internet). The most advanced versions of these devices, such as the Dolphin Easyreader [39] include the ability for the user to bookmark and annotate points of interest within the text, which can then be “jumped” to on demand. Automatic reading devices for accessibility to printed material are also available in both desktop and handheld versions. These are normally “standalone” devices which do not need to be connected to a computer. They scan printed documents to capture an image of the text which is then processed by an optical character recognition application and rendered into synthesized speech. They are designed for scanning normal continuous text and as such do not handle data tables well.
2.2.2 Screen Magnifiers Screen magnification software interfaces with a computer's graphical output to present enlarged screen content. Users require some functional vision in order to be able to utilize this accessibility tool. Large data sets (such as large spreadsheets) are difficult to navigate, so the user is unable to obtain an overview and can get “lost” in the data [127]. A similar problem is encountered with the small display screens on mobile telephones and other mobile devices [19]. Much of the difficulty is due to the lack of context for the user to locate the information under focus, which makes it difficult to implement the functional components of browsing presented in the previous section.
12
2.2.3 Braille print-outs, raised paper and embossing film Data tables can be printed out using Braille transcription software (such as MegaDots [45], Duxbury Braille Translator [44] or Braille Maker for Windows [3]) which converts text documents, spreadsheets and other common computer documents into Braille code, and a Braille embosser or printer which prints the Braille onto special paper. Tactile versions of graphs can also be rendered in Braille as raised paper diagrams. Braille printouts are portable, and they allow two-handed exploration of the document, whereby users can “place-mark” points of interest while retaining a sense of the overall “shape” of the document – also an important “affordance” of paper for sighted readers noted by Sellen & Harper [136]. However, Braille print-outs are less appropriate for large data sets, as it is often not possible to fit all the data onto one sheet of paper. For instance, large graphs or data tables may need to be printed over multiple pages or split into smaller sections. This complicates the user’s two-handed exploration of the data sets and creates problems for obtaining an overview of the data and keeping detail information in context. Another important disadvantage is that such print-outs are inherently non-dynamic, and are thus less appropriate for users needing to work with numerous or dynamicallycreated data sets. A further drawback is that, while Braille print-outs themselves are relatively cheap, the cost of purchasing the Braille embosser hardware can be prohibitive for individuals. The production of tables, charts and graphs can also be difficult for those unfamiliar with the transcription software, such that the RNIB advise inexperienced Braille transcribers to seek professional assistance when reproducing graphical or complex information [128]. This need to rely on professional transcription and print services, or to gain access to an embosser separate to one’s home or place of work, is impractical for those dealing with numerical data sets on a regular basis. Microcapsule paper (also known as “Minolta paper”, or “swell paper”) and plastic embossing film (also known as German film) are commonly used to produce tactile graphics, and to enable blind and visually impaired students to produce diagrams and maps as part of the school curriculum. Plastic embossing film is used by placing it on a rubber mat and drawing on it with a ballpoint pen or special embossing tools (known as spur wheels) to create a raised line, which can be read by touch. Graphs can also be produced using embossed graph paper (showing gridlines) with a cork geometry base (into which pins can be pushed) and tactile geometry tools (See Figure 1). This can be quite a laborious process which often requires sighted assistance, and graphs produced in this manner cannot easily be stored for later use. In addition, the pins and tools needed for this method are sharp and can cause injury. Microcapsule paper has microcapsules of alcohol embedded in the paper which burst when exposed to heat and make the surface of the paper swell up. Graphs can be printed or photocopied onto the paper, which is then passed through a “fuser” which activates the marked area with heat and thus produces the raised image. The actual graphing of the information produced using microcapsule paper is not modified from the visual form, and as such a bar graph or a line graph will have the same form as presented on a computer screen or on any print media, where the relative size of the bars represent relative numerical values, and the variations in the slope of a line graph represent variations in the trends of the magnitude represented. Some adaptation of the visual version of a graph for printing on swell paper can take place. For instance, colour coding on bar graphs is converted into
13
different textures that fingers can discriminate, and text in the title, labels on the axes, scaling, legends etc. are converted into Braille.
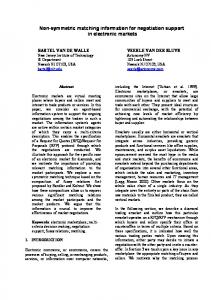
Figure 1. Bar chart constructed with embossed graph paper, pins and rubber bands. From [99].
One advantage of tactile graphs is that they can be explored with both hands – a natural way of exploring the physical environment and a very rich source of information. As a result, an overview of the information in print can be obtained. Once more, one of the biggest drawbacks of this method is that it is inherently non-dynamic. In supporting Shneiderman’s information seeking mantra, explicit zooming and filtering to explore the graph requires the production of new print-outs, which is quite impractical. Details-on-demand are difficult to obtain, as detail information is written in Braille, which takes up a lot of space on the paper. Often, Braille keycharacters (rather than full-text labels) are written on the axis of the graphs, and these key-characters must then be looked up in a list with the full Braille text. Figure 2 shows an example of a bar chart printed on raised paper, with Braille text.
14
Figure 2. Example of a bar chart printed on raised paper. Under the graph, a list of the labels of the bars can be seen, each label related to the corresponding bar by a key-character that the user can look up. From [101].
2.2.4 Haptic technologies Accessibility devices using haptic technologies include tactile devices, which appeal to the cutaneous senses of the skin, utilizing pressure, vibration or temperature to stimulate the skin, and force-feedback technologies which stimulate the kinaesthetic sense by presenting computer-controlled forces to create an illusion of contact with a rigid surface, perceived through the muscles, tendons and joints. Based on the widespread use of raised paper tactile images, Parkes developed NOMAD [115] and Tactile Audio Graphics kit [116] to enable blind and visually impaired users to explore traditional tactile diagrams and maps augmented with audio information, with the aim of improving graphicacy 1 and mobility. The Royal National College for the Blind’s “Talking Tactile Tablet” (T3) is a similar tool, comprising a touch-sensitive device resembling a graphics tablet, which provides instant audio feedback from tactile images [92]. The device connects to the user’s computer, and is activated by the user touching a tactile diagram overlay which is placed on the surface of the tablet. When a user presses on various parts of the tactile diagram they hear appropriate descriptive audio feedback. These methods combine the affordances of raised paper with speech synthesis to enable the exploration of static content contained on customised CD-ROMs (atlases, encyclopaedias, and topics relating to the school curriculum). None of these tools currently offer access to dynamically generated content, as they must be programmed to relate to pre-determined data sets which are commercially supplied. Extending the metaphor of raised paper, but addressing the issue of rendering dynamic content, some researchers are developing tactile graphics tablets which utilise electro-rheological or magneto-rheological displays, whereby a thin layer of fluid or gel reactive to electricity or magnetism is incorporated into a graphics tablet-like base. When exposed to small electrical or magnetic fields on the surface of the tablet, for instance 1
Capacity required to generate and interpret information in the form of graphics.
15
corresponding to the lines of a diagram, the fluid changes into a solid state, producing a refreshable tactile graphic display which can be used in conjunction with a user’s personal computer [56]. Such technologies are still in their infancy, however, and are not commercially available. A more widespread haptic technology are pin array displays. Pin arrays are accessibility devices in which an array of small pins stimulates the user’s fingertip. They are most commonly used for presenting Braille text in dynamic Braille displays, a line of 40 or 80 cells each with 6 or 8 pins which move up and down to represent the dots of a Braille cell. Pin arrays are capable of presenting fine cues for surface textures, edges and lines for graphical information. These have been adapted to enable users to navigate through a computer screen, and thus explore larger tactile images, by mounting the pin array on a mouse or graphics tablet. The user explores the image displayed on the computer by navigating with the mouse or moving their hand across the tablet, and the pin array dynamically presents the information to the user’s fingertip. Only a small fraction of the whole image is presented on the pin array display at any one time, the size of which depends on the number of pins in the array. Examples of commercially available pin arrays include Freedom Scientific’s Focus Braille Displays [134] and VirTouch’s VTPlayer mouse [159] (see Figure 3).
Figure 3. Close up of a pin array from VirTouch’s VTPlayer mouse [159]. Force-feedback systems are another form of haptic technology adapted for use by blind and visually impaired users. Although originally developed for computer-aided design and industrial applications, these also offer applications for blind and visually impaired users by exploiting the kinaesthetic senses. SensAble Technology’s PHANTOM Haptic Device is one of the more widely available desktop force feedback devices [137]. The device is operated by moving a pen-stylus in a 3D workspace. The stylus is affixed to a mechanical arm powered by electrical motors which generate forces to simulate the user’s interaction with virtual objects. The device can simulate kinaesthetic but not cutaneous sensations, and the single point of contact of the stylus means that there is a significantly reduced “bandwidth” of sensation in comparison to the body’s own wide array of haptic receptors [172]. A related problem is that the stylus can “slip off” the object being explored and it can be difficult for blind and visually impaired users to locate the object in the 3D space. Researchers have sought to improve this through “virtual fixing”, utilising orthogonal forces to guide the user’s stylus back to the object, somewhat like a magnet [12, 57]. Research has also resulted in useful guidelines about how to present information haptically to minimise slip-off problems. For instance, if the user is expected to follow a linear trajectory on a virtual surface with a PHANTOM device it is easier to follow the line if this is “engraved” in the virtual surface than if it is “embossed” [172]. Currently the PHANTOM and similar devices are expensive for
16
individuals to purchase (although some devices cost less than a Braille display), and this, combined with the limited interaction method means force-feedback is not widely used as an accessibility tool. Such devices are also non-portable, and susceptible to mechanical failure, potentially requiring expensive maintenance. Another form of tactile display currently being researched is vibrotactile representation. Brewster and Brown [22] proposed Tactons, or tactile icons, which are structured, abstract tactile messages used to communicate complex concepts to users non-visually. Tactons exploit the basic parameters of cutaneous perception, such as waveform and rhythmic patterns, to encode information. Brown et al. [26] found users could recognize different Tactons with an accuracy rate of 71%. Brewster & King [20] found simple Tactons could be successfully used to encode information for a vibrotactile progress bar for blind and visually impaired computer users.
2.2.5 Auditory Displays using non-speech sounds Auditory displays utilising non-speech sounds form the basis for another accessibility tool that is currently not widely implemented. The screen reader JAWS for Windows v.5 (2003), includes a facility for non-speech sound which can be customised to provide feedback to users about the interface itself, such as indicating upper or lower case text, paragraph formatting, and the focus of the browser window [147]. A broad range of sonification techniques for non-visual access to numerical data are being researched, which will be discussed in Section 2.4. However, few of these have been implemented in commercial interfaces. Frauenberger et al. [54] note this gap between research and practice. Surveying views on the use of audio in the user interface amongst 86 HCI interface designers, they discovered that only speech synthesis was considered as an audio interface, and non-speech sounds were generally viewed as potentially annoying for users and not considered a “serious alternative” to the visual channel. Opposing this generalised view, the next section includes a discussion of the research being conducted in the field of the auditory display and the various non-speech-sound-based techniques developed to access information. It also reviews research on accessibility techniques utilising haptic modalities.
2.3 Current Research on Non-Visual Presentation of Numerical Information Researchers in HCI and related disciplines have approached the problem of accessing numerical data by means other than visual representations, generating research questions and knowledge that are part of an actively ongoing process. Often motivated by the need to provide accessibility solutions for the visually impaired population, many of these techniques make use of accessibility tools and technologies reviewed in the previous section. Attention is turned in this section to reviewing the most relevant contributions from ongoing research, in order to learn about their strengths and limitations, and the support that they offer to obtain an overview of numerical data.
17
2.3.1 Haptic Access to Numerical Information Data Representations Using Force-Feedback Research has mostly approached the problem of representing data in haptic modalities by using equivalence representations of the data, i.e. by accessing data visualisations rather than specifically developed haptic representations. Haptic graphs generated using force-feedback haptic devices offer a way of presenting visual graphs to the kinaesthetic sense dynamically, that is, the computer which generates the haptic representation can update the view presented to the user. Furthermore, the user can modify the haptic graph by applying forces to it, and changes in the underlying data can be recorded by the computer in real time. The most notable device used for this is SensAble Technology’s PHANTOM device, described in Section 2.2.4. Graphs are generated dynamically from numerical data contained, for example, in a spreadsheet. Then, the haptic graphs are accessed in a virtual 3D space in which all the features of a visual graph can be felt. Context is maintained through proprioception within the working space, aided by virtual walls and frames which delimit the work space and lead the stylus towards the haptic graphs by providing physical constraints to the movement of the hand. Some of the most extensive work in this area has been carried out by Yu & Brewster, whose research has covered several types of graphs, including line graphs and bar graphs, explored using PHANTOM forcefeedback devices. Their early studies found that retaining a sense of context when exploring line graphs with the PHANTOM was difficult for users and it was hard to find the maximum and minimum values on the graph [172]. A later iteration of the interface was developed and evaluated where virtual line graphs were explored as “grooves” to enable the user to retain the pointer on the line [171]. Columns in bar graphs were also represented as vertical grooves. By exploring graphs with the PHANTOM, users were able to detect trends in the data and make comparisons between different variables more accurately than by exploring the same graphs using raised paper. Haptic feedback was found to be useful for assisting users to navigate the data representation. However, the time taken to extract information was significantly longer and the perceived workload was significantly higher than with a raised paper version. This was attributed to the single point of contact interface provided by the PHANTOM, which led to a reduction in perceptual “bandwidth” (in comparison to two-handed exploration of raised paper) and thus a less time-efficient way of exploring the data. They found that introducing speech and non-speech audio to provide abstract and detailed information on the data series was an effective way to improve performance. In a similar vein, Fritz et al. [57] developed a “Haptic Graphing” technique using the PHANTOM device to allow blind and visually impaired users to explore the plot of two- and three-dimensional functions, and discrete data points in space. Context was provided through the use of a haptic grid, with thin “walls” generating very small forces, intended to enable the user to feel the grid without confusing this with the data structure itself. Synthesised speech provided coordinates on demand. Unfortunately no evaluation of this interface has been reported. Van Scoy et al. [155] developed a similar technique to enable users to feel the graph produced by a mathematical equation, by following the curve of the function displayed as a “groove” in a virtual haptic surface using a PHANTOM stylus. In a further iteration of the design, musical notes were played to provide further information about the curve of the graph, with pitch indicating the relative numeric value of the position at which the stylus was pointing [156]. No formal evaluation of this interface has been reported either.
18
McGookin & Brewster [98] developed GraphBuilder to support the creation, manipulation and collaborative access to bar graphs by blind and visually impaired users, also enabling remote collaboration. The system utilised the PHANTOM device to enable users to browse and modify bar graphs, supplemented by speech and non-speech sound feedback. When a bar is selected, moving the stylus up or down modifies the height of the bar, and pitch-mapped musical notes are played to indicate the number of units the bar has increased or decreased. Providing audio feedback to the haptic interface was found to be beneficial in enabling users to keep track of the interaction and review the accuracy of the completed task. On the basis of this evaluation, McGookin & Brewster proposed a guideline for designing haptic interfaces for the visually impaired, that all “touchable objects” in a haptic interface should provide audio feedback. In a separate study [100], they investigated concurrent presentation of two line graphs in haptic and auditory modalities, but found that participants were distracted by the different modalities and were thus unable to compare graphs presented in this way. However, auditory feedback did assist the users in retaining context, while use of the force-feedback device gave users a sense of control over the sonification of the data. As will be argued later in the thesis, a 2-dimensional (2D) data table can be understood as a collection of as many data series as rows or columns the table contains. Each data series (each row or column in the table) can be represented as a graph. Visually, 3-dimensional (3D) graphs (also known as stereograms, resembling mountainous landscapes) are often produced to represent all the data in a table. Wall & Brewster [167] constructed a haptic table-browsing interface that converted the data in the table into a virtual 3D surface, which could then be explored (non-visually) using a PHANTOM force-feedback device as well as sonification of values in the cells. They provided external memory aids called “beacons” to enable users to mark values of interest. These showed potential usefulness, although evaluations and further work are needed in this direction. This interface permitted participants to freely explore the whole 3D surface, without assistance in constraining the exploration to a single data series in the data set.
Data Representations on Tactile displays A similar approach of retrieving the visual data representation (accessing visual graphs) has been taken by research work that has incorporated tactile displays, specifically pin-array displays. Tactile displays can have similar limitations of narrow focus when the size of the display is small, as in the case of pin arrays found on devices like the VT-Player mouse. The tactile display acts as a small window through which small fractions of a graph can be accessed. Thus, the trajectory of the hand that follows the length of a visual graph to show it on a tactile display can perceive information about the characteristics of that graph via proprioception. The information presented in the display at any one time is, however, difficult to interpret. The fraction of information displayed on the graph is too small to provide any contextual information in itself, and it is therefore difficult to provide overview information. Wall & Brewster [168] investigated improving access to graphs using small tactile displays by combining the display of information with the exploration of the workspace on an absolute pointing device (a graphics tablet). Thus, the dominant hand controlled the navigation by selecting a specific area of the graph to be displayed, and this movement of the hand provided proprioceptive information that helped keep the navigation in context. At the same time, the non-dominant hand could feel the information on a narrow area around the point under focus. Detailed information (such as absolute values
19
corresponding to the fraction of graph under focus) was available on demand at any time in the form of speech. However, in terms of facilitating means of obtaining a quick overview the limitations were similar to those posed by explorations with force-feedback devices.
2.3.2 Auditory Displays to Present Numerical Information In the auditory modality, sonification techniques have been used successfully to present numerical information non-visually. Put simply, sonification is “the transformation of data relations into perceived relations in an acoustic signal for the purposes of facilitating communication or interpretation” [87]. Sound offers a large number of attributes which can be perceived by humans, including pitch, loudness, timbre, time (duration of notes and rhythm) and direction (location in 3D space) [110]. By utilising different combinations of these attributes to encode or represent information, it is possible to develop multi-dimensional auditory displays, capable of representing large or complex numerical data sets. For example, Bly [16] showed that sixdimensional information could be encoded in non-speech sounds, while Ramloll & Brewster [122] and Brown et al. [25] found that it was possible to browse multiple data series in parallel when these were presented in 3D space around the listener. The multidimensionality of the auditory modality has also led to the development of research into sonification of other kinds of data including dynamic real-time financial data [74], images [53] and even mapping the movements of fish in a public aquarium [163]. The following types of sonification have been distinguished in the literature: •
Audification: the direct translation of data into a form audible by humans, commonly applied to geophysical or astrophysical waveform data [41, 86].
•
Parameter Mapping: features of a data set are mapped to pitch, timbre or other acoustic attributes [66], as in auditory graphs, discussed below.
•
Auditory icons: Originally developed by Gaver [58], auditory icons are “everyday sounds meant to convey information about events in the computer by analogy with everyday events” (p.3), and are often used to relay information about the computer’s operating system to users.
•
Earcons: First proposed by Blattner [15], Earcons are symbolic sounds composed of short, rhythmic sequences of pitches with variable timbre, loudness etc. which can be used to communicate complex information about computer objects, operations or interactions.
•
Model-based sonification (MBS): Proposed by Hermann and colleagues [67, 70], MBS draws on realworld interaction with objects, where applying forces or manipulating them creates a sound which conveys information about the properties of the object to the listener. In this way, complex data sets could be transformed into a virtual object, where “data more or less directly becomes the sounding instrument, which is examined, excited, or played by the listener” (p.190) [67].
In line with the Auditory Information Seeking Principle (AISP) proposed by Zhao et al. [173], some recent sonification research has focused on the need to obtain an overview of complex data sets. A number of authors have argued for the importance of this approach in research on auditory display. Harrar & Stockman [63] have commented that the “presenting overviews is a very under used concept when it comes to auditory displays and even more so when applied to auditory graphs” (p.299), and suggest that more work is needed on the optimum
20
way of sonifying graphs so that users can obtain a useful overview. Stevens [144] notes that screen reading technology is useful for extracting fine detail but insufficient for obtaining an overview, and proposes the development of an “auditory glance” to enable a rapid overview of a data set. Brown [23] concentrated on the problem of obtaining an auditory “glance” of abstract graphs such as molecular structures and flow charts. Obtaining overview information from other types of data collections with complex structures and relations, like computer program code, has also been approached via sonification, attempting to make use of the high pitch and temporal resolution of human audition to identify patterns in the code [11, 49, 158]. Nickerson & Stockman [113] also researched new approaches to obtaining overview information from collections of items, by exploring the objects on a computer desktop presented in a 3D sound environment. Edwards et al. stressed the importance of the user being in control when browsing data through non-visual interfaces, in order to avoid information overload [46]. Stevens [144] also emphasises the importance of control of information flow in accessibility interfaces, proposing that this should be incorporated into the design principles for such interfaces in order to ensure blind and visually impaired users can engage in active data exploration (rather than passive listening). Hunt & Hermann [70] have extended this to emphasise the importance of interaction, to reflect properties of real-world interaction between humans and the objects in their environments. Interactive sonification has been defined as “the use of sound within a tightly closed humancomputer interface where the auditory signal provides information about the data under analysis, or about the interaction itself, which is useful for refining the activity” [66] (p.20). One line of sonification research has investigated ways of using musical sounds to provide auditory representations of data visualisations and pictorial diagrams. Alty & Rigas [125] investigated the use of music to communicate diagrams to blind users. They continued this line of research with AUDIOGRAPH, and found that context was crucial for exploring complex diagrams with non-speech sounds [6]. Kennel [78] developed a similar “diagram reading” application, to allow audio-tactile exploration of graphs and diagrams, where diagrams are displayed on a touch-sensitive glass panel connected to a computer and are explored by the fingertips. Pressing on part of the diagram elicits an “auditory symbol”, or alternatively a speech description, to indicate the kind of graphic element encountered. Kennel found that, after training, users were able to read and accurately describe a simple diagram within three minutes. Cohen et al. [33] developed the PLUMB system to enable blind students to actively explore diagrams using continuous tones with varied pitch and loudness to guide the user around the vertices and edges of the diagram, and synthesised speech feedback to describe elements of the diagram. As yet, only limited work has been undertaken to identify how other forms of diagram such as pie and bar charts can be sonified [53]. A key focus of research utilising parameter mapping techniques is the development of auditory graphs. Since Mansur proposed his Sound Graphs as a method to sonify line graphs [95], data sonification has been used extensively and successfully to perceptualise series of numbers non-visually, as an alternative to the construction of data visualisations such as line graphs and bar charts. To construct auditory graphs, discrete data points are mapped to properties of sound, and rendering them sequentially conveys a clear sense of the shape of a graph, conveying relative rather than absolute values, just as with visual graphs. While a number of different
21
sound parameters can be utilised to represent data values (as will be discussed in more depth in Section 0), experience and research have shown that pitch is the most accurate parameter of sound to be used for the mapping of numerical data, due to its high resolution [50]. Flowers et al. [51] found a high correlation between participants’ ability to make judgments on data which was presented via auditory and visual graphs. Edwards et al. [46] developed “Soundgraph” to facilitate access to and creation of simple line graphs for blind and visually impaired users, where pitch is mapped to the height of the curve in a line graph. The user is able to move backwards and forwards along the curve to locate points of interest, details of which can be obtained through a speech read-out of the x and y coordinates. The program also permitted users to create their own graphs by entering a function, drawing the graph, or importing data from a spreadsheet or other data source. Brown et al. [25] and Ramloll & Brewster [122] worked on the problem of exploring two and three data series respectively, finding in both cases that concurrent presentation of two audio graphs is an efficient way of finding intersection points. Several authors have collected much of the current knowledge on auditory graphs in the form of guidelines or graph creation toolkits. Thus, Brown et al. [28] and Flowers [50] released sets of guidelines, highlighting which techniques work and which ones do not. Additionally, Walker & Cothran [162] developed “Sonification Sandbox”, a sonification toolkit enabling users to generate auditory graphs using sound-parameter mapping, permitting the implementation of a proven successful technique as well as flexibility to experiment with new ones. A design principle that enjoys general consensus is that designing auditory graphs should exploit human high temporal and pitch discrimination resolutions. Thus, for single data series (or singlevariable y=f(x) mathematical functions) that would be presented visually as a line graph or bar chart on a Cartesian reference frame, it has become the norm to map values on the x axis to time and the corresponding values on the y axis to pitch of sound. As discussed above, a number of authors have focused on the access of two or three data series concurrently. Data tables constitute a generalisation of this problem, since a data table can be seen as a collection of graphs (see also the discussion in Section 2.3.1). To obtain overview information from larger collections of data series (2D data tables), Ramloll et al. [123] observed that using only non-speech sounds was preferred over using a combination of speech and non-speech sounds, which produced higher mental workload (when the extra level of information provided by the speech was not strictly necessary). However, even utilising only non-speech sounds, extending the single-graph sonification metaphor to collections of graphs resulted in complex and demanding exploration tasks. In an attempt to reduce the perceived complexity in exploring collections of data series (of 2D numerical data tables), Kildal & Brewster [80] investigated accelerating the rendering of the data points in each data series to rapid successions of sounds. Instead of traversing the data points in each auditory graph and retrieving fine detail, the traversing of each graph that made up the complete set occurred automatically at a fast speed, sonifying a data point every ~60ms. Experimental evaluations showed that much of the detail about the inflections in the melody line of the auditory graphs was not perceived by the users when they were rendered rapidly, and only the overall trend, general shape of the data series and the presence and approximate location of outliers were perceived clearly. In other words, with fast rendering of audio graphs, fine detail was filtered out, while overview information became apparent. Since fast rendering resulted in playing the whole series of data points in a graph in a short time (the graphs with 10 data points used in that study where played in 0.6 seconds), each rapid auditory graph was perceived as a single (yet complex) auditory
22
event conveying a relatively simple amount of information. With this simplification of the information perceived, the study showed that it was possible for the participants to access sequentially all the rows in a table (each row being sonified as a rapid auditory graph) and compare the information retrieved from all of them, providing an overview of the whole data table. The same process of sonifying a table as a collection of rapid auditory graphs can be applied to the rows or to the columns in the table. The effect rendering speed has on filtering out detail and revealing overview information will be taken as one of the bases for the solution proposed and investigated in this thesis. Given the fact that tables are the underlying paradigm for generic software applications as popular as spreadsheets and databases, it is not surprising that there is specific research going on about how to access these applications more easily in a non-visual way. In this direction, Stockman and colleagues [147, 148] are developing sonification tools to enhance one of the most popular screen readers, JAWS, in order to improve accessibility for visually impaired users. Their approach utilises various mechanisms to support interactive sonification of spreadsheet data, including automatic sonification of rows and columns and manual sonification utilising a sonification cursor, which when activated would sonify the values in the cells as the user moved the cursor across the spreadsheet using the keyboard. Maximum and minimum numeric values were automatically calibrated to the available frequency range for sonification, but users could set boundaries around selected areas in the spreadsheet, in which case the system recalibrates the frequency range to the maximum and minimum values within that area, creating an “auditory lens”. Users could also mark areas of interest within the spreadsheet by using “bookmarks” for up to 4 cell ranges. Most users found both automatic sonification and manual sonification fairly straightforward to understand and utilise for exploration. Manual sonification was found to be particularly useful for exploring numerical data, where the intention was to detect general characteristics of the data, outliers or patterns, rather than precise values. The bookmarks mechanism was found to be useful in this instance, as it allowed the user to mark a point of interest without specifying cell coordinates, for easy retrieval for further analysis. Other work on sonification of tabular data includes research conducted by Smith et al. [140] in the area of automated information processing, who used various parameters of sound to augment iconographic visualisations of large data sets distributed on a surface in quasi-tabular form, and help with the identification of patterns. In another example of somewhat irregular tabular structures, Zhao et al. [21, 94] investigated nonvisual accessibility to geo-referenced data (data presented on a geographic map of the United States, divided into 51 states), assimilating the map with a quasi-tabular structure. The fact that the map was not a regular table was a source of confusion for the participants in the evaluations. Zhao reported that the best strategy with that interface was to be already very familiar with the geography shown in the map (the names of the states and where they are supposed to be) and to find some key states using the speech synthesiser, to create a mental image of the map. This conclusion suggests that the method utilised in this study cannot be generalised to other cases, as knowing the specific layout of the particular map being explored seems to be a prerequisite.
23
2.4 Conclusions This chapter has presented a review of the literature of the main fields that are relevant to the research work presented in this thesis, with the aim of providing answers to RQ-1, which asks “How can overview information from tabular numerical data sets be obtained non-visually?”. This review began with a discussion about the importance of obtaining an overview as part of a general data exploration strategy, and how the action of browsing has been studied as central to obtaining overview information from a collection of information. Following this, the main current accessibility tools available for blind and visually impaired computer users were considered, highlighting the main benefits and limitations in each case. In the final section of this chapter, current ongoing research techniques to access numerical information non-visually were reviewed, paying special attention to their support of the process to obtain overview information. This review revealed a consensus in both the data exploration and accessibility research literature about the need to obtain an overview as the first step to analyse or simply explore any set of information. The process of browsing information, linked to extracting an overview was considered, and the discussions on its importance and structure made by various authors were included. Among these, the functional components of browsing were reported in more detail, for the guiding importance that they have in some of the coming chapters in this thesis. When reviewing both current accessibility tools and technologies available for visually impaired users as well as new accessibility techniques for numerical information that are under development, the need to provide both context and overview information was a concern which appeared repeatedly. Some of the technologies and techniques had a priori more limitations in enabling users to access overview information in a quick and easy way. One conclusion that emerged was that the properties of the auditory system can be utilised to provide overview information from collections of data rendered in sound. The high temporal resolution and fine pitch discrimination capabilities that the auditory system offers have been used successfully for this purpose and could provide the key to obtaining at least part of the synoptic properties of human vision, at the time of obtaining a summarising “glance” of a collection of information. This is further supported by the fact that many researchers working on haptic techniques for data representation have also found it useful to implement some form of data sonification, to assist users in obtaining an overview. Building on the knowledge and awareness of the current research work presented in this chapter, the next chapter captures the main requirements for non-visual overviews of numerical data sets from the end users themselves, which in turn forms the basis for the design and implementation of TableVis and the High-Density Sonification method developed by this thesis.
24
Chapter 3 Requirements Capture 3.1 Introduction While there are several scenarios in which sighted users could potentially benefit from non-visual access to tabular data sets (for example, in scientific research, industrial applications, and many data-mining tasks where vision is limited or where an overview can more easily be conveyed through use of an auditory display), the current thesis concentrates primarily on responding to the needs of the blind and visually-impaired community. As discussed in Chapter 1, blind and visually impaired users often encounter barriers to accessibility of numerical data, which can lead to them being hindered in, or even prevented from, progressing in mathematical and scientific disciplines, whether at school, in higher education or during their professional careers. Chapter 2 reviewed a range of approaches to non-visual access to numerical data, and found that many currently available accessibility technologies were not ideal for accessing overviews of numerical data. In order to apply a user-centred approach to the design of techniques that can tackle this need, representatives of the end-user population and the main stakeholders were actively involved in the process of requirements capture for this thesis. The information obtained through this process thus provides further answers to the first research question posed by this thesis: “How can overview information from tabular numerical data sets be obtained non-visually?” (RQ-1). This chapter reports the feedback gathered from this requirements capture, and presents the resultant requirements which need to be taken into account in the process of decision-making for the design on a prototype solution. The design process itself, together with the results of initial evaluations, is described in Chapter 4. The main aims of the requirements capture process were to establish: •
whether members of the community of blind and visually impaired computer users need to, or wish to, access tabular numerical data in their everyday activities, particularly in their education;
•
tools and methods currently used to access such data, and strategies employed by users;
•
user opinions on current accessibility technologies, including benefits and difficulties;
•
key requirements for accessibility to numerical data sets and user opinions on how to improve tools to access such data.
In order to answer these questions, it was essential for the research to be carried out with the assistance of and advice from blind and visually impaired users, as well as those who are involved in their education. For this purpose, a network of contacts with institutions for the blind and visually impaired was developed, where ideas could be discussed and feedback received, and which enabled the testing and evaluation of prototypes with key stakeholders for an iterative process of improved designs. This chapter reports the feedback obtained from stakeholders through focus groups, interviews and classroom observations held with blind and visually impaired students. Further requirements identified from the literature
25
and through informal discussion with stakeholders are then discussed. The chapter concludes with a summary of the main requirements identified, which informed the design of TableVis (reported in Chapter 4).
3.2 Stakeholders Two groups of people were identified to be the main stakeholders in this research work: •
Blind and visually-impaired computer users. Users with many different levels of computing skills were involved in the requirements capture process, from individuals that used basic web-browsing and word-processing techniques to students of disciplines in which the computer played a central role, and professionals in computing-related fields.
•
Educators of children and young people with visual impairments. Through classroom observations and dialogue with teachers, views and experiences of educators of blind and visually impaired people were obtained.
The process of requirements capture was conducted in collaboration with three British institutions for people with visual impairments: the Royal Blind School of Edinburgh, the Scottish branch of the Royal National Institute for Blind People (RNIB) in Edinburgh, and the Royal National College for the Blind (RNC) in Hereford. Several techniques were employed to find out about users’ and professionals’ opinions and needs: •
Focus groups and interviews were conducted with blind and visually impaired students to discuss issues about using data visualisations in general, and data tables in particular, and to gather information about the kinds of accessibility technologies used;
•
Three hours of lessons with blind and visually impaired students were observed: two classes with a single student, reviewing graph understanding and mathematical subjects; and one group tutorial on algebra.
In addition, a number of informal discussions and presentations were conducted with professionals from the RNIB and RNC.
3.3 Focus Groups and Interviews Focus groups and interviews were conducted with students from the Royal National College for the Blind in Hereford. These involved eight blind participants, two in individual interviews (Participants 1 and 2), and six in focus groups (Participants 3-8). They were aged 18 to early 30s, but were mainly in their late teens and early twenties. Three were male and five were female. Two of the participants had jobs and the other six were students, four of whom were studying music technology. Although all the participants were totally blind, some of them had had partial vision in their earlier years. The focus groups were prepared beforehand following guidelines from Morgan [108], Krueger & Casey [88] and Kuniavsky [89]. They were designed to explore the following aspects of using graphs and tables:
26
•
Experiences of accessing graphs and tables in everyday life: Participants’ experiences of using graphs and tables; in which subjects they encountered them at school or college; whether they encounter them outside educational contexts, in their everyday lives; their appreciation of the usefulness of graphs and tables, and whether these help or hinder their understanding of the topics that use them to present information, and why; problems encountered and participants’ feelings about this.
•
Tools used to access graphs and tables, and benefits or drawbacks of these: A description of the tools participants use to access graphs and tables; how they use those tools; the strategies they follow and whether they are dependent on the tasks; which tools they consider to be best or worst, and why; identification of any tools that they have not used but they have heard of, or that they can conceive would be useful.
The following information was found from the focus groups, regarding ways and means of accessing graphs and tables in their everyday lives
3.3.1 Where and when graphs and tables are encountered Graphs and tables are mainly used at school, in subjects such as maths, science and geography, although they are also encountered in further and higher education subjects such as psychology and music technology, and in professional settings. Tables were reported to be mainly encountered in web pages, where information is commonly structured using tabular structures, for page formatting. They were also encountered in word processing documents and spreadsheets. One participant still occasionally used tables in her job to structure information, but remarked that she was glad this was only an occasional task. Some students accessed information made available to them in Excel spreadsheets, and most of the group had used Excel at some point. Graphs had been encountered at school as part of the national curriculum, however none of the users utilised graphs to access information in their jobs, current studies or leisure time.
3.3.2 How graphs and tables are normally accessed Graphs and tables were most commonly accessed through screen readers, which read out table coordinates and cell values sequentially. None of the participants had explored large tables using this method. Braille print-outs and embossing film were also used for exploring, transcribing and constructing tables and, more commonly graphs, in order to meet the requirements of the national curriculum.
3.3.3 General views and experiences of using graphs and tables The group concurred that visually-impaired people generally do not enjoy working with graphs and tables, and blind or visually impaired students will often avoid dealing with information visualisations where possible, even in exam situations. The group consensus was that this aversion to graphs and tables was mainly due to a lack of accessibility. However, participants remarked that blind and visually impaired people do have an understanding about what graphs and tables are for, and can work out the tasks that were set for them with graphs and tables, albeit with difficulties: “…if there was a way […] that [tables and graphs] really could be
27
accessible, then perhaps in the future more visually-impaired people wouldn’t be so frightened of them.” (Participant 4)
3.3.4 Perceived usefulness of graphs and tables The group agreed that if graphs and tables were easier for blind and visually impaired people to access, they would possibly use them more frequently and perceive them to be more useful. Those who utilised spreadsheets in further education or in a professional setting tended to perceive tables and graphs as more useful than those who had last used data visualisations at school: “If graphs were accessible though, I do think blind and visually-impaired people would use them just as much as sighted people.” (Participant 6) One participant suggested that accessing the data in tabular form made sense, but not accessing visual representations: “…Excel, that’s all right as long as there are no charts and graphs and things involved. I found it very useful when I used it in the past.” (Participant 8)
3.3.5 Problems encountered and barriers to accessibility A key frustration for all the participants was the difficulty of obtaining an overview when presented with a new table or new graph. The group agreed that getting a sense of the boundaries and layout, as well as the overall content of the graph or table, was a necessary first step to a more detailed exploration. A contributing factor was the linearity of presentation when exploring a table or graph using a screen reader.
“When somebody fully sighted is looking at a screen, they can see it as a whole instantly, but somebody visually impaired has got to navigate actually bit by bit all around the screen, which is why it’s so hard to get a complete picture on the screen.” (Participant 4) “The best way to learn anything is to get a look at the whole picture first.” (Participant 1)
“When you go into Excel, if you don’t know what the table’s about, you must explore it and orient yourself around the table. Because if you don’t do that, you won’t get the full picture of it, you won’t get all the information from that table that you need, all the information that the people who gave it to you intended you to have.” (Participant 8)
“I find in databases in Excel I have to sort of try and visualise the screen. Knowing what kind of area you are working it helps to give you some idea of how the screen is laid out.” (Participant 7) Another significant problem for all the participants was the need for sighted help in accessing and working with numerical data, particularly in graph exploration and construction. Participants remarked that graphs and charts are not accessible with screen readers such as JAWS, and that creating a graph from an Excel table is often not possible without assistance. The steps can be learned, but it is not possible to check if the result is correct. Participants commented that it is important to be able to review what has just been done in order to make sure that there are no mistakes: “With a Brailler, you can see exactly what you’ve written straight away… You can
28
check to see if you have any mistakes.” (Participant 1). Sighted help was also sometimes necessary when constructing or exploring graphs using raised paper or embossing film: “…we had visual support assistance in our maths lesson …they would see me doing the graph and because our graphs had to reflect something that we had been taught to reflect, they would check that we were doing it OK.” (Participant 8). While most participants had successfully used raised paper graphs augmented with elastic bands as part of the school curriculum, they commented that this solution had some limitations as the bands could only be used for straight lines, and were prone to coming out of position. An added drawback was that the graphs could not be stored for later use, unlike electronic versions rendered in Excel. Participants also indicated that retaining a sense of context when exploring graphs is important: “A graph that isn’t very well done is a graph without any squares that you can’t work out where anything is on it.” (Participant 1)
3.3.6 Tools used to access graphs and tables: benefits and drawbacks The two most common tools used to access graphs and tables were screen readers (which read out sequential values from the computer screen) and tactile outputs such as Braille or embossing film (also utilised in the construction or transcription of graphs and tables). Preferences between these two categories varied across the group, and seemed partly to depend upon whether participants had been educated in a special or mainstream school, as different educational settings sometimes differ in the tools offered to blind and visually-impaired students. In the case of this group, one participant who had attended mainstream school was more comfortable with a screen reader, while another who had attended a specialist school had received more training in Braille and thus was more comfortable with a Braille transcription of tables and graphs. None of the users mentioned using non-speech sonification or force-feedback haptic devices as accessibility tools.
Screen readers A regular user of Excel said that accessing it with a screen reader is not necessarily easy as this means table values are read out sequentially, and a lot of keyboard tabbing is required to move the cursor across the table. Others in the group pointed out that obtaining an overview of a numerical data table with a screen reader can be very time-consuming, and that it is extremely difficult to remember the numbers read out so as to look for a particular value or type of data within the table.
“I use tables in Excel. That’s on a computer with JAWS, a screen reader. I don’t necessarily find that very easy because you have to navigate all the columns. There’s a lot of tabbing involved and cursors up and down.” (Participant 3)
“[With a screen reader] you just have to go over it and over it and over it, as many times as you can, to try to get yourself an overall picture of it [the data table]. That might take a while.” (Participant 4)
29
On the possibility of retrieving a particular value from a table accessed with a screen reader: “…that’s assuming you’re going to be able to take in the table in your head, and remember it.” (Participant 7)
Braille and other tactile methods Several participants showed a preference for Braille tables, as long as these were “simple”. It was suggested that displaying data tables in Braille allows the user to get a holistic view of the table, “almost equivalent to somebody seeing it on a screen” (Participant 4). With larger or more complex data sets, Braille is not always practical or available, and it is often difficult to get the whole table embossed onto a single sheet: “Sometimes I’ve found that when embossing a table, some of it will be on one line and some on the next, because the table’s too big for the embosser to cope with. And something like that can be very hard, and confusing.” (Participant 4) The group as a whole agreed that graphs and tables are often difficult to read in Braille and other tactile visualisations (including swell paper and embossing film), and thus making sense of them can be very time consuming and frustrating. In exams blind and visually impaired students tended to avoid questions requiring use of these tactile visualisations, because, while they were capable of answering them, the answers required a very long time that was better invested answering other questions. One advantage of Braille, however, is that when creating graphs from data sets, it enables the user to review what has just been done in order to ensure there are no mistakes.
3.3.7 Strategies employed when using accessibility tools Users described how they used two hands to navigate Braille tables such as bus and train timetables: “I have used train timetables and things in Braille, where you would have a column and you would follow your hand. Your right hand would take the lead and your left hand would follow it.” (Participant 3) This was felt to be a useful strategy as it enables the user to keep track of the position of data in the table. When exploring data tables using a screen reader, some participants said they used the strategy of repeated listening in an attempt to obtain an overview. This was felt to be inadequate as with the sequential read-out it was very difficult to get an overview of the data, and also difficult to retain a sense of context or remember points of interest.
3.3.8 Summary The feedback from blind and visually impaired participants in the focus groups and interviews conducted at the RNC emphasised the difficulty of obtaining overviews of data tables and graphs. Participants also talked about the need to retain a sense of context during explorations, often supported by two-handed exploration of raised paper graphs and tables. Participants commented that retaining context was difficult when using screen readers to access data tables (due to sequential read-out of information) and tactile methods such as raised paper to access graphs (due to factors such as interference from grid lines and poor layout of the representation). This feedback accords with the review of current accessibility tools used to access numerical data discussed in Section 2.2 above. Further key points highlighted by participants included their experiences of needing sighted
30
assistance when exploring or constructing data representations. This, together with the perceived complexity of the data due to the lack of overview and loss of context, contributed to the aversion many participants felt for graphs and data tables. Despite this, participants felt that tables and graphs were useful and that they would make more and better use of them if appropriate accessibility techniques were made available. This feedback helped to define a set of key requirements, which are presented in Section 3.6.
3.4 Classroom Observations In addition to the focus groups and interviews described above, a visit was made to The Royal Blind School of Edinburgh, to observe a mathematics class and gather feedback from school pupils and teachers on accessibility requirements in support of the school curriculum. Two students and one teacher participated in this requirements capture. The first student, who was blind since birth, was studying foundation-level mathematics, while the second student who was partially sighted, and utilised large print and a magnifier, was studying Higher Grade mathematics.
3.4.1 Requirements of the school curriculum The mathematics curriculum for blind and visually impaired pupils is identical to the curriculum in mainstream schools. The course texts are the same (Mathematics in Action), although the teacher said she sometimes modified the examples based on her judgment. She commented that she felt that each student was different, and that the curriculum and teaching methods used for each student had to be modified in a separate way. The examinations used are set by the Scottish Qualifications Authority and are modified, though the modifications are sometimes contentious, and may impede the student. For example, the task “Draw by eye a best fit trend line” is modified to “Draw a best fit trend line, or explain how to do so”. The sorts of questions asked by the mathematical texts and the examination board are precise. Although the teacher did ask the student to describe the general trend of the graph, most questions were far more specific, for example, “What were the sales of coffee for January?”.
3.4.2 Ways of accessing numerical data and difficulties encountered Browsing graphical data was mainly achieved by using raised paper diagrams of charts and graphs. Bar graphs were printed on raised paper, with Braille used to denote scales and legends. In order to fit all the information onto the graph on one sheet of paper, a key for the X axis was used. This was sometimes confusing for the students as they needed to cross-refer to the key, located below the graph itself. Line graphs were also produced on raised paper, and browsing these was difficult since the embossed grid lines frequently interfered with the interpretation of the graph line. As a result, the graph line had to be enhanced using rubber bands, which were used to highlight the line, kept in place with drawing pins. One of the students commented that this improved access to the graph but it was not an ideal solution as there were some practical difficulties with stretching the rubber bands and keeping them in place. At foundation level mathematics, pupils do not have to create graphs but do have to demonstrate understanding of the coordinate system in a graph by inserting pins into given
31
coordinates and then working out the coordinates of another point to determine the shape of a graph or a geometric diagram. This also incorporates the use of negative coordinates and negative coordinate systems. The teacher commented that in such situations a map pin was used to denote the origin of the space, as shown in [98]. In order to access and modify these data visualisations the students required sighted help. The teacher occasionally had to move the students’ fingers to assist them in exploring graphs, resulting in a more cooperative exploration process than would normally be expected for sighted pupils. The teacher commented that she needed to be able to control, direct and observe the students to ensure they are picking up the material, and due to the individual differences between students she also had to adopt a more improvised teaching strategy. It was observed that the students always worked from the origin of the graph line for exploration, using two hands. To find the appropriate points on a graph the students used one hand to move along the Y axis and then the other finger to move from there along to the X-axis. When trying to find a given point in a coordinate space, the student followed the X axis with one finger and then the Y axis with the other to the given coordinates. The fingers were then moved together to find the intersection.
3.4.3 Summary A key observation on both the browsing and construction of graphs using raised paper is that students do not obtain a useful overview of the data. Instead, the data representation often appears complex to the student and the use of multiple graphical elements (grid lines, separate keys and so on) is often confusing. The use of pins and rubber bands to enhance the graph line, while an improvement on raised paper alone, is not an ideal solution. In order to retain a sense of context when exploring the graphs, the students used two hands and found it helpful to work from the origin of the axes to follow each data line or bar. A further important point is that the use of these methods does not support blind and visually impaired students’ independence, as the students often have to rely upon the teacher’s assistance in exploring data representations. These observations further confirm the requirements obtained from the focus group discussions and interviews conducted at the RNC in Hereford, that blind and visually impaired users need to be able to explore data independently, obtain an overview of data, and retain a sense of context, with support for two-handed exploration where possible. This information contributes to the key requirements defined in Section 3.6.
3.5 Additional Requirements In addition to the requirements captured directly from end-users through the focus groups, interviews and observations described in Sections 3.3 and 3.4, further requirements for tools for blind and partially sighted users have been identified from the literature, and through informal discussions with blind and visually impaired people, and professionals from RNIB and RNC.
32
3.5.1 Ability to collaborate with sighted colleagues A key factor in enabling blind and visually impaired people to pursue studies and careers in disciplines which make use of numerical data sets (such as business and accountancy, science and engineering, and social sciences) is that they should be able to collaborate with sighted colleagues. This is also an important element of the normal school experience, where many tasks are focused on group work. The classroom observations reported in Section 3.4 showed that blind and visually impaired students often require intervention from the teacher to guide them in the browsing of numerical data representations. While these observations were conducted in a specialist school, it can be inferred that blind and visually impaired students being educated in a mainstream setting would encounter significant difficulties in collaborating with sighted classmates in the browsing or construction of graphs. Such lack of equality in access to curriculum materials and involvement in group tasks has been shown to result in social exclusion and frustration for blind and visually impaired pupils [77] [31]. Similar barriers to collaboration can be expected in the case of visually-presented tabular numerical data. Here, data are spatially laid out, thus collaboration focusing on such data sets is likely to refer to space-related terminology, such as “up-down”, “left-right”, “centre”, “top-left corner”, and so on. The spatial layout of tables as represented in spreadsheets and other documents is not always obvious for blind and visually impaired people, as discovered in the focus groups, where the discussion between participants revealed some confusion as to the layout of rows and columns within tables, due to the sequential read-out provided by screen readers. Thus, another key requirement is that the spatial arrangement of information should be preserved in data representations, in order to facilitate a common language as a basis for collaboration with sighted peers.
3.5.2 Controlling the exploration and accessing details on demand As discussed in Section 2.3, a number of authors working in the field of non-visual data accessibility tools have stressed the importance of the user being in control when browsing data, in order to avoid information overload [46]. Related to this is the need for any non-visual data exploration technique to enable the user to access details on demand, in line with Shneiderman’s information seeking mantra: “overview first, zoom and filter, then details on demand” [138]. Since many interactions with datasets require both a view of the overall trends and patterns within the data, but also may require pinpointing exact values, accessibility techniques need to support the user in focusing on points of interest and retrieving exact values within data sets.
3.5.3 Ability to deal with real-world data In order to achieve equality in their choice of career and study options, blind and visually impaired people need to be able to access different types of data (such as sales statistics for business, population demographics for social science, experimental results for physical sciences, and so on). Thus, accessibility techniques should be flexible enough to present real world data. It should be possible to accommodate a variety of data sets, data meanings and features in the data within the same interface and access them with the same techniques, so that there is no need to use heavily specialised, data and task-dependent solutions. This is in line with recent work
33
by Walker & Nees [166], who contend that real-world data should be used in the study of data sonification to help ensure that the techniques developed can be used outside the laboratory.
3.5.4 Simplicity and affordability Related to the above point about specialised or data-dependent solutions is the need for techniques to be as simple and easy to use as possible. The focus groups and classroom observations showed that even apparently simple accessibility tools such as raised paper can lead to confusion and complexity in their representation of numerical data sets, particularly when data visualisations are transferred directly into an equivalent haptic representation (as in the case of raised paper line graphs), or when values are read out sequentially and without a sense of context (as in the case of screen readers). Novel accessibility techniques should aim to avoid confusion and overload of the working memory. Furthermore, it was noted in Section 2.2 that accessibility hardware such as refreshable Braille displays, Braille embossers, and force-feedback devices can be expensive or not widely available. If possible, techniques should utilise technology which is affordable and widely available, so that users can easily acquire or set up a similar system.
3.6 Conclusions and Summary of Requirements This chapter has reported the requirements capture carried out as part of the user-centred approach to the design and implementation of TableVis, providing further information in answer to RQ-1, “How can overview information from tabular numerical data sets be obtained non-visually?”. The requirements capture involved a series of focus groups, interviews and classroom observations carried out with blind and visually impaired students based in Hereford and in Edinburgh. The focus groups and interviews were conducted to gather feedback on blind and visually impaired people’s views and experiences of accessing numerical data sets, while the classroom observations were conducted in order to gather information on students’ real-world experiences, and to obtain views of education professionals. While many of the blind and visually impaired participants said they did not find it easy to access numerical data using current accessibility tools, and as a result sometimes avoided tasks involving graphs and tables, most said that they believed graphs and tables to be useful and, if better accessibility techniques were available, they thought that blind and visually impaired people would work with numerical data and data representations more frequently. In addition to highlighting scenarios in which graphs and tables are commonly encountered, the focus groups and classroom observations also provided feedback on the benefits and drawbacks of current accessibility tools, and some general requirements for non-visual access to numerical data sets. Having analysed the feedback obtained from the requirements capture as described above, it was possible to assemble a set of requirements for the design of techniques for non-visual access to numerical data. These can be summarised as follows:
34
I. The user needs to be able to obtain a quick overview of the data. Several participants noted the usefulness of being able to obtain an instant global view of a data set (as with visualisations available for sighted people) and commented that they believed this was the best way to commence exploration of the data. This feedback also accords with Shneiderman’s information seeking mantra, which stresses the importance of “overview first” before proceeding to a more detailed exploration, as discussed in Section 2.1 [138]. II. The user needs to have control over the data exploration process and to retrieve details on demand. This will help to ensure the user is not overloaded with information, and also that they can zoom and filter areas of interest within the data and retrieve detailed information, as key stages in the information seeking process defined above. III. The interface should enable the user to retain a sense of context to avoid “getting lost” in the data. A frequent problem for blind and visually impaired users, particularly those using screen readers, was that it was difficult to retain a sense of context when navigating electronically through a large data set. In the classroom observations, the students preferred exploring graphs by tracing the data series from the point of origin, thus retaining a sense of context within graph exploration. The focus group participants suggested that where possible, the extent of tables and their boundaries should be made obvious. IV. The interface should not overload the user’s working memory. Some participants commented that when exploring tabular numerical data using a screen reader the volume of data can easily become overwhelming. In order to identify trends or points of interest within the table users had to listen repeatedly to the sequential read-out of values, and this was considered both time consuming and mentally demanding. V. Two-handed exploration may be preferable for tactile interaction. Focus group participants commented that they explored Braille tables such as bus timetables with two hands, which enabled them to retain a sense of context when exploring simple tables. Classroom observations also showed that students tend to explore tactile visualisations using two hands. It would make sense to retain this facility if designing an interface which utilises tactile interaction. VI. Data need to fit on one “page” or work space, and the spatial layout of the data should be preserved. A frequent problem with Braille print-outs of graphs and tables is that the table may not fit onto one sheet of paper. In order to enable the user to retain control of the document and to avoid confusion, it is better to ensure that one workspace can encompass the entire data set. In addition, in order to ensure a common language for collaboration with sighted colleagues, the spatial layout of the data should be retained. VII. Users need to be able to access real world data. The solution must be flexible enough to be applied to different kinds of numerical data sets of varying levels of complexity. An implicit requirement is that tables can be explored according to the logical structures that they represent, namely by rows and by columns. VIII. The solution should be as simple to use and affordable as possible. It should be easy for the user to acquire, set up and use a similar system without having to purchase expensive task-dependent devices. IX. The entire data exploration should be possible without sighted help. The need for sighted assistance in exploring data representations is a source of frustration and a barrier to equality for blind and visually
35
impaired people. The design of novel techniques for non-visual access to numerical data should ensure truly independent access for blind and visually impaired users. These requirements were used to inform the development of the non-visual exploration techniques proposed in this thesis. The next chapter will report the design, implementation and pilot evaluation of these techniques.
36
Chapter 4 High-Density Sonification (HDS) and its Implementation in TableVis 4.1 Introduction The first three chapters have laid the groundwork for the main contributions in this thesis, driven by the thesis research questions formulated in Section 1.2: “How can overview information from tabular numerical data sets be obtained non-visually?” (RQ-1) and “What level of performance can be achieved with the non-visual techniques proposed in this thesis?” (RQ-2). In a quick recapitulation, Chapter 1 discussed the motivation and the relevance of these questions in the context of accessibility to complex numerical information non-visually, with particular focus on the stage of gathering overview information. Chapter 3 surveyed topics from the literature that are relevant to the investigation of this research: the role of an overview in data exploration, current accessibility technologies and their support for gathering overview information, and research on non-visual access to numerical information and support for overviews. Chapter 3 reported the process of user-centred capture of requirements conducted as part of this thesis and defined a set of requirements to inform the design of the solution investigated in this thesis. The information from these initial chapters led to a consideration of the approaches, existing exploratory techniques and sensory modalities that could be best employed towards answering the first research question: how to obtain overview information from tabular numerical information non-visually. The outcome was the proposal of an interface to explore tabular numerical data sets non-visually, called TableVis. The main technique implemented in this interface is a novel data sonification technique called High-Density Sonification (HDS), which is described and justified in Section 4.3. Section 4.4 then describes how HDS was implemented in TableVis, in combination with other input and output techniques, such as speech synthesis and a tangible user interface. Finally, a pilot evaluation of the interface is reported at the end of the chapter. Before all this, the chapter starts by defining the scope of the data sets (data structures and types of data) considered in this thesis. While this thesis has from the beginning stressed its focus on tabular numerical data sets, this is a broad definition. Thus, in the next section the focus of this thesis on data tables is further discussed, defining the scope of data sets that will be considered in the rest of the thesis.
4.2 Data Sets Considered in this Thesis Much of the discussion so far has focused on numerical data sets, without further specifying their structure or characteristics, although they are key to this thesis. This focus on tables was already mentioned in Chapter 1, and the thesis research questions formulated in Section 1.2. This section seeks to provide further justification about the importance of studying tabular data structures, and to define which tabular structures will be considered in the scope of this thesis.
37
4.2.1 Why numerical data tables? The reason for studying tables relates to the aim for studying non-visual representations of numerical data sets in general, rather than accessing specific visualisations constructed from those data. In that sense, while data tables can be considered a form of data visualisation (because they reveal certain relations among the data when laid out on paper or on screen), tables are logical structures on which data can be arranged. In fact, as Card et al. [30] argue, tables (plus the metadata that describes and gives sense to the values contained in them) are a first step to rationalise any set of raw data before creating a visualisation of it, as represented in Figure 4.
Figure 4. Reference model for the creations of visualisations from raw data, as proposed by Card et al. [30]. Data tables are the result of the first transformations applied to the raw data in a process called normalisation. Data tables are formed from raw data before any mapping to sensory parameters takes place, and are therefore independent of the sensory channel that will access them. In this model, data tables are created from raw data as the result of a data normalisation process, but they are independent of the sensory channel with which the data will ultimately be accessed. As seen in Figure 4, it is only after the tabular structures are formed that data are mapped to visual parameters. This independence of the sensory channel permits the mapping of data to parameters of any sensory channel, or even to several channels. This idea is stressed by Card et al. [30] after they present their model: “…while we are emphasizing visualization, the general case is for perceptualization. It is just as possible to design systems for information sonification or tactilization of data as for multiple perceptualisations” (p.7).
4.2.2 Which numerical data tables? While Card et al. [30] describe a detailed process to normalise raw data into tables, there are actually many structures that can be called tabular. Lopresti & Nagy [94] provide a non-exhaustive, yet comprehensive, taxonomy of 2D tables containing a variety of types of data (textual, numerical, graphic), as well as operations and transformation that can be done with a table, and they propose a table-related terminology in a paper that, itself, is written as a big and complex table. Yesilada et al. [170] also report a survey of 2D tables, finding 35 different groups of tabular structures based on data type, levels of table nesting, visibility and design of cell boundaries, and labelling. They also provide a classification of table reading and browsing styles, as well as presentation and content styles supported by tables. Their work concentrates on providing improved access to tables using screen readers, by using a large combination of keystrokes.
38
As derived from these two references, many data structures can be referred to as data tables. In the scope of this thesis, however, only certain kinds of tables are considered. The data structures considered in this thesis are matrices, or what in computing science are referred to as 2D arrays. Such data structures consist of collections of one-dimensional arrays, which are data series with the same number of elements. Thus, any one element in a multidimensional array can be accessed using pairs of integers, or indices that provide the coordinates or address of an element in the 2D array. A characteristic of these structures is their regularity: they are a lattice with m x n number of cells, where m is the number of columns and n is the number of rows. Despite regularity in the structure being adopted as a requirement for a table to be studied in this thesis, the limitations introduced by this decision are not many. In fact, a spreadsheet is an example of one such table. The results of the process of normalisation of raw data into tabular structures described by Card et al. [30] (from which to construct data perceptualisations) are also examples of the tables considered in this thesis. Regarding the type of numerical information stored in the tables that will be considered in the scope of this thesis, no limitations are introduced a priori regarding the range of values, sign or number of decimals. In summary, any collection of numerical data that can be arranged in a 2D array or in a matrix (be it a collection of data series, samples from a mathematical function of the type z=f(x,y) or other experimentally recorded sets of data from a system that fit logically into a 2D table, to mention some obvious cases), is considered in the scope of this thesis. The only exception would be data tables where one or more of the cells are empty. Such cases are left for future work. The techniques investigated in this thesis are intended to cater for data with any meaning which fit into a 2D-table. As discussed in section 4.4, there is ongoing research regarding how the customisation of sonification techniques to data with specific types of meaning affects the success of data explorations. This will also be taken into account at the time of extracting conclusions from this thesis.
4.3 High-Density Sonification (HDS) In Section 2.3.2, it was shown that a large body of work exists around the use of auditory graphs, where relative values in a graph are presented by mapping them to some parameter or parameters of sound. To recall some aspects from that review, auditory graphs can successfully present detailed information about a graph, and to some extent about two graphs presented simultaneously [24], providing relative values of the data. For larger collections of graphs (the data points of which would constitute a tabular structure), the amount of information conveyed to the user in this way (the number, relative location and relevance of such features, plus the time it can take to traverse all the graphs) can soon grow to levels that mentally overload the user. In a study with rapid auditory graphs [80] (where each graph was sonified in its entirety automatically, at a fast pace of ~60ms per value), Kildal & Brewster found that the higher speed with which data were rendered made it more difficult to notice all the inflexions in a data series, although this provided the benefit of revealing overall characteristics (general trends and patterns) more clearly and with less effort. This simplified representation of the data, combined with the short time that it took to render one graph, made it possible to present several graphs in a sequence and extract knowledge from the whole set. In that study, users tended to perceive each rapid auditory graph as a single (although complex) auditory event, which could easily be compared against the auditory event originating from another rapid auditory graph, so that users could extract conclusions about the overall
39
comparison of graphs. In other words, increasing the speed of rendering auditory graphs was a method to hide detail and let overview information surface, generating manageable levels of mental workload. That study was conducted using tables with 10 rows and 10 columns. Unpublished qualitative pilot evaluations by the same authors [79] suggested that with larger table sizes this data representation could again become excessively complex. To summarise, rapid auditory graphs showed that higher speeds of rendering the information affected the level of detail revealed, facilitating users to obtain overview information of larger data sets than with others forms of presentation of auditory graphs. This technique, however, was still only useful for relatively small and/or simple data sets. Harrar & Stockman [63] have also looked at the effect that modifying speed of presentation of single auditory graphs has on obtaining overview information from them. In their study, three presentation speeds were compared for graphs with 12 data points: “Slow” (14 seconds), “Medium” (7 seconds) and “Fast” (3 seconds). They determined that the medium presentation speed supported the most accurate graph comprehension, for graphs rendered in discrete sounds. The fastest speed tested (around 250ms per sonified data point) was slower than the 60ms per data point tried by Kildal & Brewster [80]. Combining the results from both studies, it seems that speeds of rendering auditory graphs of half to one second per sound are best to obtain clarity about the overview of a single auditory graph (a one-dimensional array of numbers). Increasing the speed makes it more difficult to obtain clear descriptions of a graph. However, at very high speeds (around 60ms per sound) the information that can be extracted from a single graph is so condensed that the resulting audio rendering becomes a representation of the graph a as whole, and can be compared against similar representations of other graphs, thus providing a technique for the exploration of collections of graphs (two dimensional arrays of numbers). This thesis studies the highest end of rendering speeds and their suitability to explore such two-dimensional arrays or tabular numerical data sets. Taking into account this effect of high data rendering speeds on filtering out detail and revealing very general overview information, a logical progression to obtain overview information from larger data sets was to further increase this data rendering speed. A consequence of increasing the speed beyond the 60ms per sound tested by Kildal and Brewster [80] was that, eventually, the duration of the gap between the sounds representing the data points on a graph was so short that the auditory event generated with the rendering of a complete data series was perceived as a chord. This change in the nature of the auditory representation (from a series of sounds to a chord) would result in the loss of information about the order of the values in the data series. Additionally, the complexity in the combined frequency spectrum of the resulting chord would be expected to lead to the masking of some of the frequencies [106]. This leads to the question of whether numerical information conveyed in this manner could be usefully analysed by a listener. This new form of sonifying series of numbers perceptually simultaneously rather than sequentially is the basis for one of the main contributions of this thesis. With the name High-Density Sonification (HDS), this sonification technique is formally defined in the next section. Following a general definition, its actual implementation in TableVis is discussed. Then, a pilot evaluation of this implementation is reported. The implications of HDS in its implementation for TableVis and the capabilities that it offers as a technique for discovery of knowledge from tabular data sets are investigated in much of the research work reported in the remaining chapters of this thesis.
40
4.3.1 General Definition of High-Density Sonification (HDS) In its most general form HDS is defined independently of its actual implementation:
High-Density Sonification (HDS) is the simultaneous (or perceptually simultaneous) sonification of all or some of the data points in a data set, following the same parametric sonification strategy for all the data points. The resulting single auditory event is a representation of that data set (or sub-set), which can be compared against the representations of other data sets (or sub-sets) that are generated using the same data-to-sound mapping strategy. This definition of HDS encompasses all the possible instances of the technique by specifying its defining characteristics without describing the actual form of its implementation. Hence, this definition leaves freedom for designers to decide on the best implementation for each case, and for researchers to investigate aspects of usability and user performance, as well as perceptual and cognitive properties of different implementations. It is important to highlight that a key characteristic of HDS is to sonify data points from a data set simultaneously or perceptually simultaneously. These data points can be all the data points in the data set (in which case the complete data set would be represented in a single auditory event) or just a subset; the definition does not, however, specify the structure of the data set or the way in which subsets are formed. Another statement in the definition is that the same parametric sonification strategy is applied to each data point in the subset, but it does not provide any further description about which aspects of the data are mapped to which parameters of sound, nor how this should be done. Finally, the definition states that auditory events generated using the same parametric sonification strategy over different data subsets can be compared against each other. The aspects that are not determined in this definition are left for design decisions to be made in each implementation. The next section discusses the implementation of HDS proposed for TableVis.
4.4 Implementation of HDS in TableVis The general definition of HDS given above encompasses all the possible instances of this technique by specifying only the defining aspects of it, which can take a variety of forms in different implementations. This section discusses the implementation of HDS made for TableVis, in the context of its integration in an interface to interactively explore tabular numerical information non-visually.
4.4.1 Grouping Data to Render with HDS The definition of HDS does not limit its use to any particular data structure, type or configuration. Data tables are not mentioned in the definition, which means that it can be used with other data structures as well. Similarly, the definition does not stipulate which data points in a data set are simultaneously sonified. In practice, the set of data that is sonified with HDS into a single auditory event will depend on the meaning of the data being explored and the aims of the exploration. A common scenario could be that the user wants to sonify
41
data subsets in which the data points have certain common characteristics, and compare them against other subsets that share the same characteristics but vary with respect to one or more parameters, the effect of which the user is trying to assess. In the case of 2D tabular numerical data, an obvious criterion for generating data subsets which can be meaningfully sonified with HDS (although not the only one) is to combine data cells that share the same value in one of the coordinate axes. By doing this in a 2D-table, data can be grouped by rows and by columns. For each one of these ways of grouping cells, the whole data table can be represented with the auditory events generated using HDS. Thus, all the sonified rows contain a representation of all the cells in the table. Likewise, all the sonified columns also represent all the cells, but with a different set of sound events. These two different sets of auditory events, each conveying the whole data set but generated by grouping the cells differently, can be seen as two complementary views of the same data set. It is somewhat like looking at the same object from different angles: each view reveals certain characteristics of it, and putting both views together can offer an overview description of the whole. For a 2D-table, grouping and sonifying the cells with the same value on one of the axes is called the canonical HDS of the table, and the patterns for grouping cells are graphically represented on the top half of Figure 5: grouping cells by rows and by columns, obtained by grouping together all the cells with the same coordinate value on the vertical and on the horizontal axis respectively. The definition of the canonical HDS can be extended to tables with more dimensions. For instance, with a 3D-table constructed around an XYZ orthogonal frame of reference, the canonical HDS is obtained by grouping cells that share the value in one of the axes, each one of those subsets being a 2D-table. Thus a collection of 2D-tables can be created along one axis, which together contains all the cells in the 3D-table. Each 2D-table is represented as a single auditory event, providing an array of sounds that represent the whole data set. Repeating the same process for each axis provides three complementary views of the same whole data set. The bottom half of Figure 5 illustrates graphically the way in which subsets of data are generated for canonical HDS in 3D-tables. The canonical HDS for tabular data structures with any number of dimensions can be formally defined as follows: Considering a data table with n orthogonal dimensions, its canonical HDS consists of n complementary views. Each view is generated along one of the axes, rendering in a single auditory event all the cells that share the same value on that axis. As a result, all the auditory events in the same view originate from data subsets with the same size and shape. Also within a view, all the cells from the data set belong to one and only one auditory event (i.e., all the cells are represented in the set of auditory events of each view, and each cell is represented only once in each view).
42
Y
Y
Z
X
Z
X
Z NZ
NZ
NZ
NY
NY
NY
NX
NX
X
X
Y
Y
Y
NX X
Figure 5. Data subset patterns for canonical HDS of 2D-tables (above) and 3D-tables (below). The canonical sonification of 2D-tables generates two complementary views of the data set, whereas for 3D-tables it generates three complementary views.
43
It should be highlighted once more that the canonical HDS of a tabular data set is by no means the only possible form of HDS. To give only a few examples, data points that share values in two or more axes (instead of just in one) could be grouped together, resulting in smaller data subsets than with the canonical HDS. Data spanning over certain ranges on one or more axes, or data subsets that are not arranged in parallel to any of the axes could be other examples. Grouping data points in concentric round shapes (e.g. concentric spheres in 3D-tables, or concentric circles in 2D-tables) that expand around a certain point of interest could be a particularly useful form of grouping data for HDS that is different from the canonical. Ultimately, the preferred pattern in each case will depend upon aspects such as the meaning of the data, previous knowledge about the features in the data and the aims of the exploration. In the scope of this thesis, which focuses on 2D tabular data structures, the implementation of HDS in TableVis was chosen to be in the canonical form, due to it being a well defined form with properties that are suited to 2Dtables and which can be easily extended to tables with larger numbers of dimensions.
4.4.2 Parametric Sonification To fully define the implementation of HDS in TableVis, the mapping of numerical information to sound needed to be decided upon, since it is not determined in the general definition of HDS. Pitch was selected to be the single parameter of sound used in HDS to map numerical information, in the implementation for TableVis. This decision is grounded on previous research on auditory graphs, as discussed in the literature review (Section 2.3.2) and in the description of the process that led to the definition of HDS, described earlier in this chapter (Section 4.3). One of the main reasons for selecting this parameter of sound is that it provides higher resolution than others parameters such as loudness, spatial location or timbre [50]. An additional advantage of using this auditory display dimension is that it is quite robust against influences from the listening environment [164]. Some researchers assert that the meaning of the data should be taken into account at the time of deciding about the parameter of sound for the mapping of the data, and that this should be done based on metaphors. Thus, Walker and Kramer [160] studied experimentally which of four parameters of sound (loudness, pitch, tempo or onset) was best suited to map data informing about temperature, pressure, size and rate. They found that some of these combinations were more meaningful than others, although not always conforming to the predictions of the sonification designers. Extending the argument of choosing mappings based on metaphors, Neuhoff [111] proposed the use of ecological sound sources and events that evoke mental models (such as the speed of steps), as opposed to low level acoustic parameters (like pitch and loudness). As discussed in Section 4.2.2, these considerations are taken into account for the general discussion of the results in the thesis, although different choices of parametric sonification are not discussed in this thesis. Instead, user performance achieved with pitch as the parameter to access numerical information, as well as its implications at perceptual and cognitive level, is studied in detail in this thesis. By using pitch to convey quantity, only relative values can normally be conveyed to a user. Users in possession of absolute pitch could potentially be able to derive the absolute values of the numbers that were mapped to pitch, provided that information about the range of values being represented was known. However, the prevalence of absolute pitch in the general population is very low, estimated at 1 in 10,000 [7]. Thus, in general
44
it is not feasible to represent absolute values in pitch. Mapping data to pitch has however proved to be very effective at representing relative values, as the work on auditory graphs referenced in the literature review demonstrates (Section 2.3.2). Most people have no difficulty in distinguishing which of two sounds are higher in pitch, and can readily interpret this difference as the two numeric values relative to each other. As Moore [107] reports, several studies on pitch discrimination of pure tones show that listeners can detect differences in frequencies (Hz) of less than 0.5%, throughout the frequency range. Only a small minority of people have a deficit in processing such fine-grained pitch differences – a condition known as amusia, thought to affect up to 4% of the general population [139]. A parametric mapping is not fully defined until polarity and scaling are also chosen. Walker [161] asserts that, as for the sound parameter chosen to represent the data, both polarity and scaling should also be chosen taking the meaning of the data into account. Polarity indicates how the sound parameters vary with the change of data, i.e. whether an increase in the sound parameter should indicate an increase or decrease in the data dimension [63]. Positive mapping polarity would take place when the sound parameter changed in the same way as the data dimension, and negative mapping polarity would happen when the opposite was true [161]. Ongoing research has provided some evidence that the preferred polarity for a population of listeners may not be the same for different types of data mapped to the same parameter of sound [164]. Walker & Lane [165] studied preferred data-to-auditory-display mappings, polarities, and psychophysical scaling functions relating data values, for blind and visually impaired listeners. The results of this study indicated that for the majority of data-to-display mappings there were strong similarities and general agreement between populations with regard to the magnitudes of the slopes of the scaling functions and the polarities. In the case of mapping values to frequency, as utilised in this thesis, a difference in preference between populations was found for data that represented number of dollars (positive polarity for sighted and negative for blind users). For the implementation of TableVis, a positive mapping polarity was chosen, i.e. mapping values to pitch of sound in such a way that higher frequencies represented higher numerical values and vice versa. The reasons for choosing positive over negative mapping polarity were, firstly, that this is the option implemented in most of the previous work on auditory graphs HDS derives from, and which proved an efficient way of representing abstract series of numbers [24, 28, 80, 95]. In addition, for data with specific meanings (temperature, pressure, money, etc), Walker & Lane [165] found that, with the exception of mapping dollars to frequency mentioned above, both sighted and blind groups of participants in their study preferred positive mapping polarity. Further support comes from research conducted in the 1960s by Roffler and others regarding the localisation of tonal stimuli in the vertical plane. According to Roffler & Butler [130], listeners reported sounds with higher pitch as originating at higher positions on the vertical plane than sounds with lower pitch. In the same study, they found that this phenomenon was also observed in congenitally blind persons, and in young children who were likely to be unaware of the use of the words “high” and “low” in describing differently pitched sounds. A recent study by Rusconi et al. confirmed this perceptual phenomenon [131]. The other aspect to consider in the design of a parametric sonification refers to the scaling function. Scaling refers to how much change in a data dimension is represented by a given change in the display dimension [166]. In the case of using pitch of sound to map values, as in this implementation, if a doubling of frequency results in
45
a perceived doubling of data dimension represented, then the slope of the graph, or scaling function, is 1.0. If a doubling of frequency yields less than a doubling in the data dimension, then the slope of the line is less than 1.0 [165]. It is, therefore, a subjective scale used for relative magnitude estimation [145]. In TableVis, choosing a single parameter and polarity for every data set meant that the scaling factor was already determined, regardless of the type of data in the table. However, since the data exploration tasks investigated in this thesis (intended to extract overview information), required making comparisons of relative values but not magnitude estimation, the scaling function in each exploration was not considered. This is, however, an interesting and important aspect to investigate as future work, to facilitate comprehension of the data at higher levels of detail. Other design decisions for the implementation of HDS in TableVis refer to the resolution that the display offered. This was determined by the ratio of the frequency range utilised in the display to the range of numerical values in the data set. As the interface was intended to access any 2D tabular data set so as to obtain overview information from it, regardless of the data stored in it, the implementation was designed to maximise this resolution in every case by always mapping the range of numerical values in the set to the full extent of the pitch space utilised (approximately between 62Hz -2600Hz, as discussed below). The implementation of the auditory display was programmed in C++, controlling directly the MIDI synthesiser of the soundcard in a computer. A piano MIDI instrument was used in this implementation to produce the actual sound. The rich range of harmonic frequencies of this instrument can provide high toneness (i.e. clarity of pitch perception) [71]. The fast attack characteristic of the piano notes provides accuracy on the onset, which is well suited for fast and brief rendering of the notes. The general algorithm that was used to map values to pitch was the following:
⎛ x − S min M = ⎜⎜ ⎝ S max − S min
⎞ ⎟⎟ ⋅ (M max − M min ) + M min ⎠
Equation 1 where x:
Numerical value that is mapped to pitch of sound;
M:
MIDI number (pitch) to generate the sound representing the numerical value;
Smin: Lowest numerical value in the data set; Smax: Highest numerical value in the data set; Mmin: MIDI number corresponding to the lowest end of the pitch space utilised in the display; Mmax: MIDI number corresponding to the highest end of the pitch space utilised in the display; With this formula, the range of numerical values in the data table (from Smin to Smax) was mapped to the pitch space ranging between MIDI numbers Mmin and Mmax. One advantage of this mapping strategy was that it would permit an easy identification of outliers since the outlier value would be rendered with a very different pitch
46
than the rest of the values in the data set. This would ensure that the majority of values in the data set would be rendered in a narrow band of frequencies, providing low resolution. This is exactly what happens with visual graphing of data: in the presence of outliers, these appear as spikes emerging from an otherwise rather flat curve, also providing low display resolution. This can often be the first approach to obtaining an overview of the data. Once the user removes the outliers, the new range of values is rescaled to make use of the complete range of pitches, providing maximum resolution in that display. While MIDI uses integer numbers to generate sounds in a 12-tone equally-tempered (12-TET) scale (i.e. the chromatic scale used in modern western music), the algorithm presented above (Equation 1) returns real numbers, with decimal point digits. In other words, it provides an exact mapping to a continuum pitch space rather than to the discrete 12-TET scale. Using MIDI pitch bending, TableVis was implemented to render sounds in the exact pitch, as returned by the algorithm. Additionally, a rounding option was implemented, with which the values obtained from the algorithm were rounded downwards to the nearest note in the 12-TET scale. Except in the study reported in Chapter 8, the research studies reported in this thesis were conducted using the 12-TET scale pitches only. This decision was made on the basis that sonifications would result in musical sound events that were more familiar-sounding for the majority of participants. While the dissonances produced within the 12-TET scale are commonplace in contemporary music (including film music and other non-avant-garde sources), chords generated with a continuum pitch space are much rarer and could potentially lead to difficulty in listening. The study reported in Chapter 8 that utilises the full frequency range to map sounds suggests, however, that accurate knowledge can be extracted from data with exact mappings too, and opens a direction of future research. Following the design guidelines developed by Brown et al. [28] for the audio presentation of graphs and tables, the pitch space used to display the information was defined to be between MIDI values 35 and 100 (approximately 62Hz – 2600Hz). For effectiveness in the auditory display, Walker & Kramer [164] recommend using the range 200-5000Hz for sonification with pure tones. For complex sounds like the piano instrument used in this thesis, toneness is highest when its fundamental lies around 300Hz, and remains high in the range 80800Hz [71]. The range selected for the implementation in TableVis is well centred with this range, and makes no use of high and low frequency sounds well outside this range, where toneness becomes lower.
4.5 Interaction in TableVis The previous section was devoted to the definition of HDS and the description and justification of the design decisions in the process of implementing HDS for TableVis. This interface was intended to enable users to interactively explore tabular numerical data sets so as to obtain overview information from them, whilst providing a bridge to exploration techniques for accessing information at higher levels of detail. This section describes and justifies the design of the interaction by which users control the explorations.
47
4.5.1 Interaction Design Premises Several of the user requirements summarised at the end of Chapter 3 and some guidelines derived from the literature review in Chapter 2 provide key concepts for the design described in this section. One conclusion extracted from the literature review was that it is important to provide means of generating data sonifications interactively [70] and that providing control over the interaction helps avoid information overload [46]. This was also a requirement that was derived from the focus groups reported in Chapter 3. Linking these aspects in the context of information browsing, Marchionini [96] states: “…information must be assessed and examined during browsing. The information seeker’s challenge is to make rapid judgements of relevance, and the designer’s challenge is to provide flexible display facilities for examination and assessment.” He adds: “…browsing may be more of a direct manipulation strategy than the formal methods are because it involves cognitive, perceptual, and motor systems concurrently and continually” (p.101). Referring to interaction techniques implemented in auditory interfaces, Fernström et al. [48] suggest that user interaction can be viewed not as discrete events (e.g. clicking a button) which generate processes without further user control, but as “a continuous flow, such as a pen stroke, where we continuously move a pencil on a surface, relying on our learned gesture through proprioception, as well as haptic, visual, and auditory feedback” (p.37). This view, they suggest, is increasingly important due to the availability of input devices such as pens and cameras which can detect complex human actions. This continual involvement of cognitive, perceptual and motor systems forms the basis for the interaction method for TableVis, and the means by which users control the exploration process. Another requirement collected form the target end users was that the interface should make it possible for the user to retain a sense of context to avoid “getting lost” in the data. In the visual domain, Bederson & Hollan [10] put this formally by saying: “One challenge in navigating through any large data space is maintaining a sense of relationship between what you are looking at and where it is with respect to the rest of the data (i.e. balancing local detail and global context)” (p.20). In a similar line, Walker [166] argues strongly for the presentation of context information in the design of auditory graphs, asserting that additional contextual marks shown in visual graphs, like scale divisions on the coordinate axes, should also be provided with the presentation of auditory graphs. Also relating to the need to preserve context during the exploration, an additional requirement collected from the focus groups stated that the data being accessed should fit on one page or work space. Blind and visually impaired participants in the focus groups also reported that using two hands helps retain context information in data explorations. It was thus determined that a good way of presenting the context of the whole data set was one that could be explored tactually while not interfering with the auditory representation of the information subset in focus. This was achieved with the use of a physical, tangible device on which to present the data. A WACOM graphics tablet [35] was chosen for this, as described in the next subsection. Once the tabular information was made available on the surface of the tablet, users could access data by directly pointing at them and retrieving them in sound.
48
4.5.2 Support for Focus+Context A graphics tablet is a tangible input device consisting of a flat rectangular surface on which the user can control the position of the mouse pointer by moving a wireless electronic pen over the surface. Unlike an ordinary computer mouse, which is a relative positioning pointing device (i.e. the position of the mouse on the desk does not determine the coordinates of the pointer on the visual display), a graphics tablet can be configured to function as an absolute positioning pointing device. In other words, there is a one-to-one-relationship between the coordinates of the pointer on the computer screen and the rectangular working area of the graphics tablet. As a consequence, by pointing at the same physical position on the active area of the tablet, the computer always receives the same pair of coordinates for the pointer. In TableVis, the tablet was augmented by adding a physical, tangible frame around the active area, delimiting it and making the borders easily identifiable using both hands, as shown in Figure 6. As reported in Chapter 3, classroom observations showed that when visually impaired students explored tactile graphs, one of the hands (the non-dominant hand) provided reference to known locations in the exploration area (e.g. the origin of coordinate axes, in the case of a Cartesian graph), while the other (dominant) hand accessed information on the graph. The use of a tangibly-enhanced graphics tablet was intended to enable the users to take a similar approach to data exploration. The interface was further augmented by the addition of a small tangible dot on the middle of each side of the frame, providing additional navigation cues. Using these tangible references, and simply by relying on their senses of proprioception (the sense of the position of the limbs) and kinesthesis (the sense of the movement of the limbs) [59], users could tell how far apart one hand was from the other, and judge approximately where on the tablet the pen had been placed. Similarly, they could also change the position of the pen by jumping directly to specific areas, such as the centre of the rectangle or any of the corners.
Figure 6. Graphics tablet augmented with a tangible frame delimiting the working area. Red tangible dots can be seen indicating the midpoint of every side of the rectangle. In the image, a user feels the tangible frame with the left hand while moving the electronic pen over the working area with the right hand.
49
Making use of this non-visual navigation setup, the data table to be explored (whichever its number of rows and columns) could be scaled and presented on the working area of the tablet, in such a way that the data table completely filled the working area of the tablet, as represented in Figure 7. Presenting the information in this way preserved the spatial relations of a printed or visually displayed table, in order to facilitate the use of a common language between blind and sighted people collaborating using the same data.
Figure 7. The data table to be explored is presented on the active area of the tablet, scaled to fill it completely. Having described the basic setup for data explorations with TableVis, it should be highlighted that the following three invariants are essential for a user to be able to maintain context during data browsing: I. The complete data set is always on display. The complete data set fills the active area of the tablet and that the physical, tangible borders of this active area correspond to the boundaries of the data set; II. Information remains stationary in space. Each cell in the table always occupies the same physical location on the tablet. III. The active area on the tablet has a fixed size. The user knows the dimensions of the active area of the tablet. A user can make use of these three invariants to maintain contextual information throughout the exploration, and to be able to point directly at different areas on the data set, without having to access information sequentially. Because the complete data set is presented on the tablet, there is no need to scroll, and since the location of the cells remains static, once an area of interest has been identified on the data set, the user can be confident that the data will always be located at the same physical position. By feeling the physical frames around the working area of the tablet, with the use of the senses of proprioception and kinesthesis, a user can move the pen quickly and relocate it directly on specific areas of the data set. To summarise, as users access specific pieces of data on the tablet using the electronic pen (area of the data in focus), they can keep track of its position in relation to the
50
physical boundaries of the tablet (that is, in relation to the boundaries of the data set), maintaining contextual information at every moment.
4.5.3 Generating Data Sonifications Interactively The exploration environment designed for TableVis as described above was intended to enable users to explore tabular data interactively and to obtain overview information using HDS. In the case of the 2D-tables studied in this thesis, using the canonical implementation of HDS offers two complementary views of the data set: one exploring the data by rows and the other one exploring by columns (as discussed in Section 4.4.1). The implementation of TableVis allowed the user to retrieve these two complementary views by implementing two navigation modes between which the user could switch at any time. These navigation modes are referred to as the rows and columns modes. In each of these modes, the complete row or column being pointed at with the pen was rendered in HDS. These two modes facilitated quick overviews of the complete data set by retrieving both complementary views of the data: drawing a line across the whole table (horizontally in columns mode or vertically in rows mode), a sonification of all the data in the table was interactively generated, as the pointer moved over different rows or columns. The sonification of a row or column was rendered in a single sound event as soon as the user entered the area on the tablet corresponding to that row or column. The user could choose to repeat the sonification of any particular row or column by tapping on the same position on the tablet that generated that chord. The movement and trajectories of the pen were decided by the user, who could move back and forth or lift the pen and place it down on a different area, in which case the rows or columns in between would not be sonified. By retrieving complete “slices” of data in this way, with each one rendered as a chord, a user could easily compare them against each other (a detailed study about the actual information that can be obtained from such comparisons will be reported in Chapter 8). Switching between rows and columns modes was achieved by pressing one of the buttons on the electronic pen of the graphics tablet, which is normally operated with the index finger (most models include two buttons on the pen, placed next to one another. An additional exploration mode, the cells mode, was also implemented in TableVis. In this sonification mode, only the cell pointed at with the pen was sonified through parametric mapping to pitch, utilising the same parametric sonification as described in Section 0. As the pen moved over the tablet, every time it entered a new cell, the piano sound corresponding to that cell was played. By tapping with the pen on the same position, the sonification was repeated. This mode was intended for “freehand” browsing of the exploration area, without any constraints of direction or speed. The user had full control over where to go and at what pace to sonify individual cells. Some obvious limitations of this exploration mode, as compared to the rows and columns modes, were that the user could not traverse all the cells in the table systematically, and even traversing a single row or column in a straight line seemed a difficult task. Still, in the initial pilot evaluation of the interface prototype (reported in Section 4.6) the cells mode was also made available to the users, so as to record their first impressions about it. In such case, changing the exploration mode with the button on the pen, instead of alternating between the rows and columns modes, followed the pattern “cells-rows-cells-columns-cells-rows…”. In every case, once the sonification mode was changed, a synthesised voice confirmed the new selection, speaking the word “cells”, “rows” or “columns”, depending on the mode that was selected.
51
4.5.4 Accessing Higher Levels of Detail The research questions in this thesis are focused on obtaining overview information. However, as discussed in Chapter 2, obtaining an overview is often an initial stage in the complete exploration process of a data set, summarised by Shneiderman [138] as “overview first, zoom and filter, then details on demand”. It was therefore a requirement that the techniques proposed to obtain overview information could bridge with other existing techniques that could be utilised to extract more detailed information. Two interaction techniques were provided in the interface to achieve this, which are described in this section: control over the speed of rendering sonified data and access to information in full detail using synthesised speech. The discussion in Section 4.3 justified the proposal of HDS as a technique to obtain overview information that derived from established auditory graph designs, where data rendering speed had been increased. It was observed that rendering such graphs at high speeds (at which it was difficult to obtain detailed descriptions of the graphs) facilitated the extraction of a very general overview from them, which was easy to compare with the overview information obtained in similar ways from other graphs. This approach was taken to the extreme of rendering a series of numbers at a speed so high that all sounds were perceived to be simultaneous. It was a design decision not to implement HDS as actual chords and to render the events as very fast successions. In this way, the only difference between the generation of HDS and that of auditory graphs would be the speed of rendering sounds, although perceptually and cognitively the result was very different. Speed for rendering sounds is a parameter that can take any value from a continuum. As such, informal tests showed that being able to control speed of rendering in real time within that continuum could provide a useful way of controlling the trade-off between ease of extracting very general overview information from the whole data set and finer detail in the features from specific areas of the data set. This thesis does not study in depth the transition of levels of detail using this technique. However, this functionality was made available in the initial evaluations. In the first prototype implementation of the interface, the scrolling wheel of a mouse was used as the control for varying the speed of rendering sounds, which by default was always set at maximum to render as HDS. Turning the wheel in the direction away from the user increased the sonification speed by shortening the duration of each sound. Turning the wheel towards the user had the opposite effect. The mouse was placed on one side of the tablet (on the side of the non-dominant hand of the user). It was disabled as a pointing device, and thus could not control the position of the pointer; only the wheel was in use. More elegant solutions were implemented following the initial pilot evaluation, as described at the end of this chapter. The other technique provided to access detailed information was speech synthesis, as an implementation of the “details-on-demand” in Shneiderman’s mantra. As discussed in Section 0, mapping data values to pitch is not useful for accessing absolute values. While exploring a data set, a user may at any time want to know the absolute value of a particular cell in the table or the exact readings corresponding to a cell, row or column, on the scales of the coordinate axes. To overcome this limitation of non-speech sound, on-demand speech was provided in the TableVis prototype. Details in speech were obtained by pressing one of the buttons on the pen (the other button was allocated to change the sonification mode, as explained above). When the rows mode was selected, the label corresponding to that row was read out in speech; the same was true for the columns mode. In the cells mode, both row and column labels were read out, followed by the numeric value in the selected cell.
52
The user was thus able to obtain fully detailed information about coordinates and numeric value for a particular position on demand during the data exploration. Pressing the front button on the pen activated a message giving the following information, depending on the sonification mode: •
Rows mode. Label of the current row;
•
Columns mode. Label of the current column;
•
Cells mode. Labels of the current row and column, plus value in the cell;
For example, in the cells mode, in a table with information about average monthly rainfall in different years, the speech information would be something like: “March, 1995. Value: 327”. If with the same data set the user was exploring in the columns mode to compare the monthly average rainfall over a range of years and found a particularly rainy month, requesting details for that column would result in the speech synthesiser saying “March”, for an example. The labels of rows and columns are part of the metadata of the data set. So is the general description of the data set. A function was added to the prototype to request a description of the meaning of the data in the data set, to be read by the speech synthesiser on request. This is probably the most basic overview information about a data set, which gives a meaning to the data. Although this function is essential, it was not utilised in any of the evaluations and studies in this thesis, because the meaning of the data was made available to the participants by the experimenter, in the introduction to each study. Therefore, a design decision about the best way of making this information available on demand was not made. Still, it is an important aspect to consider in future developments. Speech output is compatible with non-speech sound in multimodal interfaces, and the combination of both (each providing a different kind of information) can be preferred by users of assistive technologies, as research suggests [109]. In TableVis, both sonified relative numerical values and spoken metadata and absolute values can take place simultaneously if the user decides to keep browsing data while listening to the information in speech. To ensure maximum responsiveness in the interaction, if a user requests speech details in a cell before the speech details for another cell are finished, the previous speech message will be truncated before the new one begins. The following section reports an evaluation of the prototype implemented as described in this chapter. From the outcome of that evaluation, improvements to the design were added.
4.5.5 Design limitations HDS in its implementation in TableVis described in this chapter, has been presented as a technique that can cater for any kind of data set within the broad subset considered in this thesis. However, when making design decisions to construct this particular implementation, some limitations were unavoidably introduced as to how a user can approach the exploration of a data set. One main limitation is the availability of only two directions of exploration that were made available: explorations by rows and by columns. While in theory this cannonical
53
implementation of HDS can offer enough complementary views of the data set to be able to extract the main features in it, it is clear that other modes of exploration might facilitate the exploration of specific data sets. Some of the possible alternative direction of exploration have been mentioned earlier in this chapter, like "expanding wave" explorations centred on a particularpoint of the data, or explorations in directions that are not orthogonal with any of the coordinate axes. The implementation of the cells mode can also limit the explorations strategies that a user would like to conduct. It was taken as a premise the fact that a freehand approach to exploring the data set cell-by cell can be useful to get a gist about the data, but not as a method for non-visual systematic exploration. Still, it is cenceivable that alternative implementations of this exploratory mode could provide with tools that might prove useful in many instances. One such implementation would invilve accessing clusters of data around a particular cell simultaneously. With one such implementation, a user would be able to sample the data more efficiently, covering a broader proportion of the data point in only a few strokes, depending on the size of the region covered around the position pointed at. It is clear that many other variants of these implementations could be deviced, which would be likely to prove useful in particular instances. One further consideration is necessary to be made in this discussion about the limitations introduced by the particular implementation design decision presented in this theses. While the form in which data are made available to the user for exploration are presented as neutral and capable of accommodating many exploratory strategies (sometimes subject to the availability of a variety of exploration tools, as discussed in prevously in this section), in reality this form of presentation does impose some decisions aleady made on behalf of the user. For example, when deciding to present information evenly distributed over the active area of the tangible interface, a decision is implicitely made regarding the scale employed on the coordinate axes. For this implementation of TableVis, the scale is chosen to be a uniform one. Some users might want to use other types of scales that are meaningful for the exploration of particular data sets. An example from visual graphs would be the use of logarithmic scales. Such other scales cannot be used with TavleVis with the implementation presented here. Future work should be conducted to investigate ways of overcoming these design limitations.
4.6 Prototype Evaluation of TableVis The prototype of TableVis was evaluated at the Royal National College for the Blind (RNC) in Hereford (UK). This qualitative evaluation was designed as a think-aloud session, in which the prototype was described to each participant and tasks were set for them to try out each aspect of the functionality available. Then, some additional tasks were set for the participants to explore data sets while think aloud was encouraged. Throughout the evaluation session, information about various aspects of the prototype was collected, specifically: the participant’s preferences, views on usability, usefulness, areas for improvement and browsing strategies.
54
4.6.1 Participants Five participants, two females and three males, with ages ranging from 16 to 35, took part in the evaluation. All of the participants were students attending the RNC. Four of the participants were totally blind (three of them congenitally), and the fifth was partially sighted. Each evaluation took approximately one hour.
4.6.2 Data sets Five data sets were prepared based on real or realistic data, a decision grounded on both the requirements capture discussed in Section 3.5.3 and suggestions for good practice in the study of data sonification derived from the literature [166]. The participants were asked to browse these data sets and carry out some tasks set by the experimenter. The data sets and browsing tasks are summarised in Table 1
Data Set
1
2
3
4
5
Topic
UK population statistics
Average monthly rainfall in Kenya (mm/m2)
Usage of 50 Laboratory Computers in a week
China population statistics
Average monthly rainfall in Wales (mm /m2)
Table Size (rows x columns)
Type of Data
Tasks
16 x 15
Real data about the population in the UK between 1991 and 2005 divided in 16 age groups covering population ranging from 0 to 79 years old. (Source of the data: the U.S. Census Bureau [29])
Which age group has the most people? What is the evolution of the oldest age group? What is the evolution of births?
12 x 11
Realistic data about the average monthly rainfall (mm/m2) in Kenya, between the years 1990-2000 (based on typical rainfall data in Nairobi [9])
Can you see any overall trends? Is rainfall the same all year round? Is there any rainy season? How many? When? Has there been any occasional storm? When?
24 x 7
Realistic data about the usage of 50 computers in a hypothetical computer laboratory in one week
Can you see any overall trends? When is the busiest time of the week? Do people stay working late? What happens at night? What happens in the weekend?
16 x 16
Real data about the population of China between 1990 and 2005 divided into 16 age groups ranging from 0 to 79 years old. (Source of the data: the U.S. Census Bureau [29])
Which age group has the most people? What about old people? What about births?
12 x 11
Realistic data about the average monthly rainfall (mm / m2) in Wales, between the years 1970 and 1980 (based on typical rainfall data in Cardiff [8])
Can you see any overall trends? Is rainfall the same all year round? Is there any rainy season? How many? When? Has there been any occasional storm? When?
Table 1. Summary of the data sets utilised to evaluate qualitatively the first prototype of TableVis
4.6.3 Procedure Training for each participant was carried out using data set 1. The type of data (in this case population statistics for the UK) was described to the participant. The whole table was played in both rows and columns modes, all the functionality was described and the participant then tried out the interface. The user was then asked to
55
explore the data in the different modes, to obtain an overview of the entire data set (exploring by cells, rows and columns). Finally the user was asked to provide answers to questions which would demonstrate an understanding of the data (see Table 1). Following the training session, further data sets (2-5 in Table 1) were presented to each participant. In each case the type of data set was firstly described to the participant, who was then asked to explore the data using the functionality provided, and to complete some tasks to establish the capacity for TableVis to provide an overview of general trends as well as more detailed information on demand. Following completion of each task, the participants were asked to comment on their approach to obtaining the information and on the user experience. Depending on the level of skill that the participants acquired using the TableVis prototype during the evaluation session, and also depending on the number and extent of the comments that they wished to make after each task, a varying number of the tables was shown to different participants. All the participants completed 3 or 4 data sets out of the total of 5 available. The experimenter prioritised obtaining participants’ comments over completion of all the tasks within the one hour session. Since a controlled experiment was not carried out, the format of each evaluation session was kept flexible. Comments from users were continuously recorded. The qualitative feedback collected in this study is summarised and discussed in the following section.
4.6.4 Qualitative feedback One of the participants had some difficulty in distinguishing the terms “row” and “column” (the same issue was reported in the focus groups, where some participants mixed up the concepts, as discussed in Section 3.5.1). Although the experimenter had to clarify these terms several times during the evaluation, the participant’s performance carrying out exploratory tasks was as good as the other participants’. The parameter mapping technique implemented in TableVis appeared to work well for all the participants, who found it easy to understand and use: “Telling the value listening to the sound is quite easy” (Participant 2); “It’s easy to tell from the sound” (Participant 1). This was felt to be useful for comparing relative values and detecting general trends within the data: “Even if you’re not absolutely spot on by figure, you should have a really good rough idea” (Participant 4). Indeed, a number of the participants commented that that TableVis was good for obtaining a quick overview: “It could be useful for quick overview information – that’s what I like about it. It could also be useful for getting detailed information without reading the numbers and stuff” (Participant 5); “Often you need that kind of tool if you’re doing analysis and stuff. It gives you a quick overview” (Participant 3). This was felt to be an improvement over the sequential read-out of values using a screen reader: “Often you just want an overview. It’s very time consuming having things read out with speech” (Participant 5). The ability to obtain details on demand in speech was also found to be useful: “It’s very useful because as well as being able to click and have whatever particular information you want, you know, you can also just get a general overview by the sounds” (Participant 2).
56
Control over the exploration was of key importance to most of the participants. The pen was felt to offer a high degree of control over the exploration. Control over the exploration also enabled the participants to retain a sense of context within the data set: “I think you need to do it yourself because, you know, you can take control of it. If you’re listening to it, sometimes you’re listening to something and you don’t quite hear it all at the same time” (Participant 2); “I keep track of where I am” (Participant 1); “It’s very good. Without that you’d never find your way around it [the data set]” (Participant 3). One of the difficulties encountered by participants was keeping in a straight line when navigating with the pen in cells mode. One participant commented that they found it difficult to know when they had entered a new column. However, when asked whether that navigation mode should be removed from the interface, another participant commented that “It’s better to have plenty of options and choose the ones you want” (Participant 4). It was also observed that the use of the mouse wheel to control sonification speed was not an ideal setup because users expected the mouse to be used for navigation. While most of the participants said they liked using the tablet interface, it was observed that some participants had difficulty using the buttons on the pen (the front button for speech details and the back button to change mode). Participants sometimes pressed the wrong button, changing exploration mode accidentally which led to some confusion. Despite this, participants commented that they liked using the pen as it offered control over the exploration. When asked about the potential for more widespread use of TableVis, participants said they felt that a finished product could prove useful for blind and visually impaired users, and some commented that they would be keen to try out future developments of the interface.
4.6.5 Discussion The feedback described above shows that users valued having control over the exploration, both in obtaining overviews and accessing details on demand, supported by the functionality for switching between modes and altering the speed of sonification. As discussed in Section 2.3, this need for control in multimodal techniques for data exploration has also been stressed in the literature [46] [144] [70]. The feedback also indicates that users found it easy to obtain quick overviews of the data, and that active exploration of the data sets using the tablet and pen helped users to retain a sense of context and enabled them to return to areas of interest for further analysis (the zooming and filtering stages of Shneiderman’s Information Seeking Mantra [138]). A few practical issues were highlighted by the pilot evaluation regarding the hardware setup. Firstly, having two buttons on the pen with two different functions led to confusion for some users, who often accidentally selected the wrong function. Secondly, using the mouse wheel to alter sonification was sometimes confusing, as users expected the mouse to act as a navigation device (although once this difficulty was overcome, the functionality provided by the wheel was shown to be useful). It was decided that these issues would be addressed in a further design iteration, while still retaining support for the key requirements defined in Chapter 3.
57
In order to address the problem with the pen buttons, where some users found it difficult to differentiate one from the other, it was decided that both pen buttons should provide the same functionality, of details on demand. This left two other functions to be implemented: navigation mode and speed of sonification. To change navigation mode it was felt that a click or push-button metaphor made sense, while speed of sonification required more continuous control (which was the motivation for using the mouse wheel, as a “scrolling” tool). However, as derived from the requirements capture, it was necessary to keep the interaction method as simple as possible. An input device incorporating a rotary knob and push-button function (Griffin Technology’s PowerMate [61]) was chosen as this could accommodate both controls within an easy to use interface (shown in Figure 8).
Figure 8. Input device (Griffin Technology’s PowerMate) with rotary knob and push-button functions, used in TableVis to control the speed of the sonification and change the sonification mode. Speed of sonification was controlled by turning the knob clockwise to increase speed or anticlockwise to reduce. This choice was modelled on a “hi-fi” volume dial metaphor, which informal tests showed to be a familiar and easily understandable interaction method. In order to change exploration mode, the user simply pressed the knob as a push button. The device was placed on the side of the non-dominant hand for easy access during the interaction. These changes were judged to have solved the difficulties with the hardware setup as found from user feedback.
4.7 Conclusions This chapter began by defining what is understood by data tables within the scope of this thesis. It then introduced and justified the concept of High-Density Sonification (HDS), a novel parametric sonification technique to enable obtaining quick overviews of collections of data series, such as the tabular numerical data sets studied in this thesis. The implementation of HDS in TableVis, an interface to explore tabular numerical data sets non-visually, was then described and justified. A pilot evaluation of the interface was then reported,
58
which showed that HDS as implemented in TableVis could be used to obtain overview information from tabular numerical data sets. It also validated the usability of the interface, while highlighting some issues which were then addressed by a further design iteration. As such, this chapter has proposed a technique to tackle the exploration need stated in the first research question: “How can overview information from tabular numerical data sets be obtained non-visually?” The chapter has provided a general definition of HDS, which can be implemented in a variety of auditory displays. This offers considerable scope for the technique to be adopted and evaluated by other designers. In TableVis, canonical HDS is implemented, which for 2D tables results in the grouping and sonifying of cells with the same value on one of the axes. The next chapter reports a study in which the implemented prototype of TableVis was fully evaluated, both quantitatively and qualitatively, with blind and visually impaired participants.
59
Chapter 5 TableVis and HDS: Quantitative and Qualitative Evaluations 5.1 Introduction Chapter 4 described the design and implementation of the TableVis prototype, and reported the first evaluation of High-Density Sonification using TableVis in comparison to keyboard navigation, demonstrating that TableVis outperformed the keyboard in terms of reducing mental demand, effort, frustration and annoyance, and improved perceived performance level. This chapter reports a study in which the implemented prototype of TableVis was fully evaluated, both quantitatively and qualitatively, with participants from the main target population of blind and visually impaired users. This study was designed to contribute towards answering both research questions defined for this thesis in Chapter 1: “How can overview information from tabular numerical data sets be obtained non-visually?” (RQ-1) and “What level of performance can be achieved with the techniques proposed in this thesis?” (RQ-2). As a contribution towards Research Question 2, a quantitative evaluation of the prototype was carried out where performance (effectiveness and efficiency) with TableVis and HDS was compared against performance obtained with the current dominant accessibility technology (a screen reader utilising synthesised speech). Participants’ subjective workloads were also compared between the two conditions. A qualitative study was also conducted with the aim of contributing information in answer to Research Question 1. This study aimed to determine which exploratory strategies and procedures were utilised by analysing the exploration traces recorded from the eight blind and visually impaired participants during the experiment, as well as the feedback provided by all the blind and visually impaired participants who evaluated the interface with HDS. For the purposes of this study, an exploratory strategy is defined as the action plan that a user devises to carry out the exploration of a data set in search for information. Exploratory procedures are the ways in which this strategy or action plan is implemented (the ways in which actual interaction with the system takes place). This qualitative analysis of exploratory strategies and procedures led to a better understanding of the challenges and cognitive processes involved in the exploration of tabular data for overview information.
5.2 Experimental Study The results from the pilot evaluation of TableVis reported in the previous chapter showed the benefit of using direct pointing (with a graphics tablet and the navigation modes implemented in TableVis) for exploration of tabular numerical data. The way in which data from the tables were conveyed (either as synthesised speech or as non-speech sounds generated using HDS) was the only parameter that changed between the two versions of TableVis that were used for the experiment reported in this chapter.
60
5.2.1 Design of the experiment A two-condition, within-subjects, repeated-measures experiment was conducted to quantify the differences in effectiveness, efficiency and subjective workload when using each form of information presentation in overview exploration tasks: •
Condition-I: non-speech sound condition. Explore numerical data tables for overview information using TableVis, retrieving information in sound generated with HDS;
•
Condition-II: speech condition. Explore numerical data tables for overview information using TableVis, retrieving information in synthesised speech;
Condition-I (HDS) included all the functionality of the TableVis prototype described in the previous chapter, with the exception of the cells mode. This mode was not made available in order to conduct the evaluation only in the rows and columns modes, i.e. those most suited to explore for overview information. The default sonification speed was set to the maximum, so that rows and columns were perceived as chords, but the participants could modify this setting, if desired, at any time during the experiment. In Condition-II (speech), the functionality available in the interface was the same as in the non-speech sound condition, except that the value in each cell was conveyed in speech instead of being mapped to pitch of sound. In the rows mode, the cells in the selected row were read from left to right (top to bottom in the columns mode) at a speech rate that was set by each participant before the experiment, to match the speech rate they normally used with screen reader applications. In this way, the interface in this condition offered a compromise between speed and intelligibility that was optimised for each participant. To further optimise the use of the interface in the speech condition, users could turn the rotary knob during the experiment to select the number of digits of precision with which values were spoken. Thus, any number of most significant digits (MSD 2 ) could be used, bearing in mind that the smaller the number of significant digits, the less accurate the information was, and less time was required to render data in speech. The aim for providing this functionality was that the participants could retrieve data with the minimum necessary accuracy to obtain overview information. The number of significant digits that are required to obtain overview information at a particular level of detail varies depending on the data in the table. In the example shown in Figure 9 (left), retrieving the first MSD is enough to observe that values grow both rightwards and downwards. In Figure 9 (right), on the contrary, the first MSD alone would show a table with the same value – three million – in all the cells. However, presenting also the second MSD would reveal that the values in this example follow a similar trend as in the example on the left.
2
The MSD in a number is the leftmost, non-zero digit in that number. It is the digit with the greatest value in the number. For example, in the number 4,326,436.394, the most significant digit is the 4 at the left end.
61
3,425,263
4,579,389
5,320,147
3,125,263
3,279,389
3,320,147
6,568.453
7,679,128
9,474,596
3,468.453
3,579,128
3,674,596
9,141,853
10,002,730
11,256,026
3,741,853
3,802,730
3,956,026
Figure 9. Left: Example of a data table in which the information in the first MSD is enough to identify the trend that the values in the table follow. Right: Example of a data table in which the first two MSDs are required to extract information about the trends that the values in the table follow. A training session was provided at the beginning for each participant, to make sure that all the concepts involved were understood and to enable the participants to familiarise themselves with the interface and functionality used in the experiment. In the case of the non-speech sound condition, after the training session participants understood the relation existing between numerical values in the cells and pitch of sound used to represent those values. They also understood that accessing a full row or column using HDS was to hear all the sounds corresponding to all the values in that row or column, played as a chord. Thus, the row or column with the highest values in it would be the row or column that produced the chord that they perceived with the overall highest pitch. They were instructed to trust their first impression about the perceived overall pitch of a chord. The underlying hypothesis was that in a set of rows or columns rendered with HDS, the row or column with the highest Perceived Overall Pitch (POP) would also result in the highest arithmetic mean. Throughout the thesis, evidence supporting the correctness of this hypothesis is collected. In Chapter 8, an extensive study is reported in which the validity of this arithmetic mean estimation technique is analysed and quantified. In order to keep each experimental session within one hour duration, a maximum of 2 minutes was allowed to explore each table and answer the overview exploration question (informal pilot testing suggested that this time was appropriate to perform the tasks). Each overview exploration task started with one of two possible types of question: •
Question type I. Which time of the day / day of the week gets more / less visits?
•
Question type II. In which quadrant 3 of the table are values highest / lowest?
The first question type required exploring the table in one direction only, giving a precise answer (a particular row or column). The correct answer for this type of question was judged based on the arithmetic means of the rows and the column. With the second question type, the table had to be explored in both directions (horizontal and vertical), and only one of four areas had to be identified. In the case of this type of question, the correct answer was the quadrant containing the absolute highest or lowest value in a cell, depending on the question.
3
Top-left, bottom-left, top-right or bottom-right.
62
For each condition, workload was measured using a modified NASA-TLX test [64]. NASA TLX scales allow for participants to rate on a set of unmarked scales the subjective workload that they experienced during an experiment. A table of the attributes used to define workload in the modified TLX scales used in this evaluation is shown in Table 2. Following Brewster [21], the NASA-TLX scales were modified for the studies in this thesis with the addition of two attributes: annoyance experienced and overall preference. Badly designed auditory displays have often been associated with annoyance, as a recent study by Frauenberger et al. also reported [54]. Therefore, it was judged important to measure participants’ annoyance regarding the auditory displays developed in this thesis. The overall preference attribute was also incorporated as a metric to provide a relative overall subjective rating of the conditions compared in the studies.
Attribute
End points
Description How much mental, visual and auditory activity was
Mental Demand
Low/High
required? (e.g. thinking, deciding, calculating, looking, listening, scanning, searching)
Physical Demand
Low/High
How much physical activity was required? (e.g. pushing, pulling, turning, controlling) How much time pressure did you feel because of the rate
Time Pressure
Low/High
at which things occurred? (e.g. slow, leisurely, rapid, frantic)
Effort Expended
Performance Level Achieved
Frustration Experienced Annoyance Experienced Overall Preference
Low/High
How hard did you work (mentally and physically) to accomplish your level of performance? How successful do you think you were in doing the task
Poor/Good
set by the experimenter? How satisfied were you with your performance? How much frustration did you experience?
Low/High
(e.g. were you relaxed, content, stressed, irritated, discouraged)
Low/High Low/High
How annoying did you find the browsing technique? Rate your preference for the two browsing techniques. Which one made the task the easiest?
Table 2. Table showing the attributes and descriptions of modified NASA TLX workload questionnaires used in the experiment. Modified from Hart and Staveland [64]. The interactions of all the participants during the experiment were recorded, including all the traces of the movement of the pen on the tablet and all the actions performed, such as changes in exploratory mode and requests for detailed information in speech. Everything was time stamped, so that a timeline of the explorations could be reconstructed, including the speed of movement of the pen at every point. Additionally, after both experimental conditions had been completed, participants were given the opportunity to provide feedback on
63
their experience, in an informal discussion. The qualitative evaluation of these data will be discussed in detail in Section 5.3.
5.2.2 Hypotheses The following hypotheses were formulated for the quantitative experiment: i.
The time required to complete the exploration tasks will be significantly lower (i.e. efficiency will be significantly higher) with HDS than with synthesised speech;
ii.
The accuracy, measured in percentage of correct answers (i.e., the effectiveness) will be significantly higher with HDS than with synthesised speech;
iii.
The subjective overall workload (calculated from modified NASA-TLX) will be significantly lower with HDS than with synthesised speech.
5.2.3 Data sets Fictitious yet realistic data representing the number of visitors to an internationally popular website were produced for the experiment (see Appendix D). All the data sets had the same metadata: 7 columns (days of the week) and 24 rows (hours of the day). This metadata could accommodate results that were equally likely around the clock (the website could be at its busiest any time of the day or of the night, and any day of the week). A total of 24 tables (12 in each condition) were presented, with 6 questions of each type in each condition. The data sets in each condition were presented in random order to the participants.
5.2.4 Participants Sixteen participants took part in the experiment: 8 totally blind participants (5 of them congenitally blind) and the remaining 8 visually impaired. They were recruited among the students and members of staff from The Royal National College for the Blind (Hereford), and students from the Uddingston Grammar School (Glasgow). 10 were male and 6 were female, with ages ranging between 16 and 55 years old. All the participants that took part in this study used screen readers to access information in computers, except two partially sighted students who used screen magnifying software and another two who used large fonts and special colour schemes. The group recruited was heterogeneous regarding their type of visual impairment, skills and previous knowledge of relevant basic concepts. As a consequence, training sessions had different durations in order to bring all the participants to a similar level of understanding of the tool and tasks. In the cases in which a substantial amount of the experiment time had been spent in providing training and only one condition could fit into the experiment, only the non-speech sound condition was conducted. From a total of 16 participants recruited for this study, only 6 participants completed both conditions (4 of them totally blind, 2 congenitally). Another 6 completed only the non-speech sound condition (of these, 2 were totally blind, one of them congenitally), and the remaining 4 participants could not complete any of the conditions (due to hearing impairments or a lack of familiarity with basic concepts about tabular data structures). Among the 6 participants who completed both conditions, 3 of them started with Condition I and the other 3 with Condition II.
64
5.2.5 Results The differences in efficiency and effectiveness measured in this experiment are shown in Figure 10 and Figure 11 respectively. In both figures, the results for the non-speech sound condition are the average of the scores obtained by 12 participants, while the results for the speech condition are the average of the results of only 6 of those participants. Since the populations in both conditions were not the same, two-sample (between groups) Ttests were performed. To test the third hypothesis regarding subjective workload, however, only the participants who used both conditions completed the modified NASA-TLX questionnaire, thus it was possible in this case to conduct two-sample (within groups) T-tests. The results of the T-test showed that the average time to complete the task in the speech condition (M=39.1 sec., SD=13) was significantly longer than when HDS was used (M=70.5 sec., SD=29.4), (T6=-2.496, p=0.047