materials Article
Characterization of a Polyacrylamide Solution Used for Remediation of Petroleum Contaminated Soils Jongwon Jung 1 , Jungyeon Jang 1 and Jaehun Ahn 2, * Received: 8 October 2015; Accepted: 21 December 2015; Published: 2 January 2016 Academic Editor: Maryam Tabrizian 1 2
*
Department of Civil and Environmental Engineering, Louisiana State University, Baton Rouge, LA 70803, USA;
[email protected] (J.J.);
[email protected] (J.J.) School of Urban, Architecture, and Civil Engineering, Pusan National University, Busan 609-735, Korea Correspondence:
[email protected]; Tel.: +82-51-510-7627
Abstract: Biopolymers are viewed as effective and eco-friendly agents in soil modification. This study focuses on the wettability analysis of polyacrylamide (PAM) solutions for soil remediation. The contact angle, surface tension, and viscosity of PAM solutions were experimentally evaluated in air- and decane-biopolymer solution systems. Furthermore, a micromodel was used to investigate the pore-scale displacement phenomena during the injection of the PAM solution in decane and or air saturated pores. The contact angle of the PAM solution linearly increases with increasing concentration in air but not in decane. The surface tension between the PAM solution and air decreases at increasing concentration. The viscosity of the PAM solution is highly dependent on the concentration of the solution, shear rate, and temperature. Low flow rate and low concentration result in a low displacement ratio level, which is defined as the volume ratio between the injected and the defended fluids in the pores. The displacement ratio is higher for PAM solutions than distilled water; however, a higher concentration does not necessarily guarantees a higher displacement ratio. Soil remediation could be conducted cost-efficiently at high flow rates but with moderate concentration levels. Keywords: biopolymer; polyacrylamide; contact angle; surface tension; micromodel; viscosity; soil remediation
1. Introduction Recent developments in the use of organic agents for soil improvement have elicited promising results. Organic agents, including polymers, biopolymers, and surfactants, have shown to improve the shear strength, stiffness, soil remediation, and erosion resistance behaviors of geomaterials [1–8]. Among them, biopolymers such as polyacrylamide (PAM) and Xanthan gum have shown great promise for enhanced oil recovery (EOR) because they lead to an increase in the viscosity of water, decrease in the mobility of water, and contact with a larger volume of the reservoir [9–11]. Given the water flooding performance of biopolymer solutions through porous media in EOR, they have been considered as cost-efficient materials for oil contaminant soil remediation [12]. However, previous works on biopolymers were limited to the evaluation of the shear strength, stiffness, and erosion resistance properties of soils saturated with biopolymer solutions. Little is known about the flow characteristics of biopolymer solutions through a porous medium. Therefore, in this study, we selected PAM—one of the most widely used biopolymers—and explored its physical properties such as contact angle, surface tension, and viscosity at different concentrations. Furthermore, we conducted micromodel tests to understand the flow behavior of a PAM solution in porous media.
Materials 2016, 9, 16; doi:10.3390/ma9010016
www.mdpi.com/journal/materials
Materials 2016, 9, 16
2 of 13
2. Literature Review 2.1. Remediation of Petroleum Contaminated Soil Soil contamination in urban and rural environments can be caused at industrial sites such as mining heaps, dumps, filled natural depressions, and quarries [13]. Important characterization and remediation techniques have been developed to deal with the contamination of soils and sediments [14,15]. Soil remediation technologies such as excavation, soil vapor extraction, bioremediation, surfactants enhanced remediation, and steam injection have been used for many years [16–18]. The excavation of contaminated soil is a simple solution. However, this method has become less popular owing to its high cost and the lack of available landfill sites [15]. Instead, soil flushing methods such as soil vapor extraction, surfactant-enhanced remediation, and steam injection have been more popular in recent years [19]. Among these, surfactant-enhanced remediation affords an enhanced rate of remediation by exploiting the low surface tension of the surfactants [15]. Oil-contaminated sites have been remediated by in-situ flushing using biosurfactants, that is, surface-active substances synthesized by living cells [20,21]. Biopolymers synthesized from plants can also be used instead of biosurfactants as an eco-friendly soil remediation method [22]. Biopolymer flushing was originally developed for petroleum-enhanced oil recovery, and subsequently, it has been used for the remediation of petroleum waste at contaminated sites [23–29]. The basic principle of biopolymer flushing is that the addition of a biopolymer to the flushing water leads to increased viscosity and capillary number, decreased mobility, and contact with a larger volume of the reservoir [30]. The capillary number of a fluid is related to the fluid velocity, fluid viscosity, and surface tension. Mobility is a relative measure of how easily a fluid moves through porous media. Apparent mobility is defined as the ratio of the effective permeability to the fluid viscosity [31]. The physical properties of biopolymers, such as viscosity, surface tension, and contact angle, are important to determine when using biopolymer solutions is feasible for the remediation of petroleum contaminated soils. 2.2. Multiphase Fluid Flow In multiphase fluid flow, the displacement ratio in a porous medium, defined as the ratio of the volume of the injected fluid to that of the defended fluid, is governed by two dimensionless numbers, viscosity number (Nm ) and capillary number (Nc ), that are defined as follows [32,33]: µinv µdef
(1)
µinv vinv σ¨ cosθ
(2)
Nm “ Nc “
where µinv and µdef are the viscosities of the injected and defended fluids, respectively; vinv is the velocity of the injected fluid; σ is the surface tension between the injected and the defended fluids; and θ is the contact angle on the surface of the medium. These two dimensionless numbers govern the displacement characteristics of the fluids represented by three dominant patterns, capillary fingering, viscous fingering, and stable displacement, as shown in Figure 1 [34–36]. When the values of log (Nm ) and log (Nc ) are positive during fluid injection into a saturated porous medium, stable displacement can be expected. Otherwise, either viscous or capillary fingering may occur, resulting in a low displacement ratio; thus, the volume of petroleum eliminated from the contaminated soil will decrease. In the experimental program presented in this paper, PAM solution was used as the injected fluid and air or decane was used as the defended fluid. Decane (alkane hydrocarbon, anhydrous, ě99%, C10 H22 ) [37–42], a major constituent of petroleum, represents the petroleum contaminant in soils [43–45].
Materials 2016, 9, 16 Materials 2016, 9, 16 Materials 2016, 9, 16
3 of 13
Figure 1. Displacement pattern with respect to N m and Nc: (a) viscous fingering; (b) stable displacement; Figure 1. Displacement pattern with respect to Nm and Ncc: (a) viscous fingering; (b) stable displacement; : (a) viscous fingering; (b) stable displacement; Figure 1. Displacement pattern with respect to N m and N and (c) capillary fingering [32,46]. and (c) capillary fingering [32,46]. and (c) capillary fingering [32,46].
3. Experimental Program 3. Experimental Program 3. Experimental Program Figure 2 and Table 1, respectively, show the chemical structure and composition of PAM, Figure composition ofof PAM, a Figure 22 and and Table Table 1,1, respectively, respectively, show show the the chemical chemical structure structure and and composition PAM, a polymer produced using acrylamide. The properties of PAM solutions, such as contact angle, surface polymer produced using acrylamide. The properties of PAM solutions, such as contact angle, surface a polymer produced using acrylamide. The properties of PAM solutions, such as contact angle, surface tension, viscosity, and flow characteristic (micromodel test), were tested at six concentrations—0, 2, tension, viscosity, and flow characteristic (micromodel test), were tested at six concentrations—0, 2, tension, viscosity, and flow characteristic (micromodel test), were tested at six concentrations—0, 2, 5, 10, 15, and 20 g/L—prepared by mixing PAM with deionized water, except the viscosity at 0‐g/L 5, 10, 15, and 20 g/L—prepared by mixing PAM with deionized water, except the viscosity at 0-g/L 5, 10, 15, and 20 g/L—prepared by mixing PAM with deionized water, except the viscosity at 0‐g/L concentration. The viscosity of deionized water is readily available in literatures. concentration. The viscosity of deionized water is readily available in literatures. concentration. The viscosity of deionized water is readily available in literatures.
Figure 2. The basic chemical structure of polyacrylamide (PAM) [47]. Figure 2. The basic chemical structure of polyacrylamide (PAM) [47]. Figure 2. The basic chemical structure of polyacrylamide (PAM) [47]. Table 1. The chemical composition of polyacrylamide (PAM). Table 1. The chemical composition of polyacrylamide (PAM). Table 1. The chemical composition of polyacrylamide (PAM).
Label Label PAM Label PAM PAM
Name Chemical Composition Name Chemical Composition Polyacrylamide (C3H5NO)n Name Chemical Composition Polyacrylamide (C3H5NO)n Polyacrylamide
(C3 H5 NO)n
3.1. Contact Angle 3.1. Contact Angle 3.1. Contact Angle The sessile drop technique was used to measure the contact angle of PAM solutions on the silica The sessile drop technique was used to measure the contact angle of PAM solutions on the silica surface in air or in decane. Smooth fused pure silica plates (VWR Vista Vision—Cover Glasses, Thein sessile technique was fused used to measure contact angle ofVision—Cover PAM solutionsGlasses, on the surface air or drop in decane. Smooth pure silica the plates (VWR Vista amorphous SiO2) were used as the substrates to represent silica sands. Before each contact angle silica surface in air or in decane. Smooth fused pure silica plates (VWR Vista Vision—Cover Glasses, amorphous SiO2) were used as the substrates to represent silica sands. Before each contact angle measurement, the silica plate was cleaned using ethanol (Malickrodt Baker, ACS reagent grade) and amorphous SiO2 ) were used as the substrates to represent silica sands. Before each contact angle measurement, the silica plate was cleaned using ethanol (Malickrodt Baker, ACS reagent grade) and handled with clean gloves. A new silica plate was used for each measurement to avoid possible measurement, the silica plateA was cleaned using was ethanol (Malickrodt Baker, ACS reagent grade) and handled with clean gloves. new silica plate used for each measurement to avoid possible complications introduced from the reaction history with decane and PAM solutions. A droplet of PAM handled with clean gloves. A new silica plate was used for each measurement to avoid possible complications introduced from the reaction history with decane and PAM solutions. A droplet of PAM solution was foamed on the silica surface under atmospheric conditions, and the contact angle was complications introduced from the reaction historyatmospheric with decaneconditions, and PAM solutions. A droplet of PAM solution was foamed on the silica surface under and the contact angle was measured. Furthermore, the PAM solution was introduced into the decane‐filled chamber and released measured. Furthermore, the PAM solution was introduced into the decane‐filled chamber and released onto the silica plate in the chamber. The evolution of the biopolymer droplet was monitored using onto the silica plate in the chamber. The evolution of the biopolymer droplet was monitored using 3/13 3/13
Materials 2016, 9, 16
4 of 13
solution was foamed on the silica surface under atmospheric conditions, and the contact angle was measured. Furthermore, the PAM solution was introduced into the decane-filled chamber and released Materials 2016, 9, 16 onto the silica plate in the chamber. The evolution of the biopolymer droplet was monitored using high-resolution time-lapse photography (Nikon D90, resolution: 12.3 megapixels). Each experimental high‐resolution time‐lapse photography (Nikon D90, resolution: 12.3 megapixels). Each experimental case was conducted at least five times, at a constant room temperature (24 ˝ C). The captured images of case was conducted at least five times, at a constant room temperature (24 °C). The captured images the droplets were analyzed using ImageJ, and the contact angles were measured (Figure 3). of the droplets were analyzed using ImageJ, and the contact angles were measured (Figure 3).
Figure 3. 3. Contact (c,d) in in decane decane as as determined determined using using Figure Contact angle angle on on a a silica silica surface surface (a,b) (a,b) in in air air and and (c,d) high‐resolution time‐lapse photography and Image J. high-resolution time-lapse photography and Image J.
3.2. Surface Tension 3.2. Surface Tension The surface tension of PAM solutions was measured using the Du Nouy ring method. In this The surface tension of PAM solutions was measured using the Du Nouy ring method. In this method, a platinum ring of 6‐cm diameter is submerged into one phase (liquid) and then raised to method, a platinum ring of 6-cm diameter is submerged into one phase (liquid) and then raised to another phase to form a fluid meniscus. This meniscus subsequently tears from the ring. The another phase to form a fluid meniscus. This meniscus subsequently tears from the ring. The maximum maximum force required to support the ring is measured; this force is the surface tension between force required to support the ring is measured; this force is the surface tension between the two liquids. the two liquids. In this study, a force tensiometer (Sigma 703D, Biolin Scientific, Stockholm, Sweden) In this study, a force tensiometer (Sigma 703D, Biolin Scientific, Stockholm, Sweden) was used for was used for these measurements. these measurements. 3.3. Viscosity 3.3. Viscosity The viscosity viscosity PAM solutions was measured using a Brookfield DV‐III The ofof thethe PAM solutions was measured using a Brookfield ViscometerViscometer DV-III (Brookfield, (Brookfield, Middleboro, USA). In the tests, a spindle in the at test fluid rotates at a Middleboro, MA, USA). InMA, the tests, a spindle immersed in theimmersed test fluid rotates a constant rate, and constant rate, and the viscosity is measured from the torque required to rotate the spindle. The the viscosity is measured from the torque required to rotate the spindle. The viscosity of a material viscosity of a material can be sensitive to the temperature and loading rate; the experiments were can be sensitive to the temperature and loading rate; the experiments were conducted with controlled −1) under various 1 ) under conducted with 6.8, controlled shear rates (3.4, various 6.8, 17, temperatures 34, and 68 s(25, temperatures shear rates (3.4, 17, 34, and 68 s´ 50, 70, and 90 ˝ C). (25, 50, 70, and 90 °C). 3.4. Flow Characteristics (Micromodel Test) 3.4. Flow Characteristics (Micromodel Test) 3.4.1. Experimental Setup 3.4.1. Experimental Setup Figure 4a shows a schematic of the experimental configuration. The silica micromodel was placed horizontally onshows a customized jack stage. Aexperimental syringe (2.5 mL with a 1/16 The inch silica fitting) controlled by a Figure 4a a schematic of the configuration. micromodel was precision syringe pump (Kats Scientific, NE-1010, Kats Enterprises, Denton, TX, USA) was connected placed horizontally on a customized jack stage. A syringe (2.5 mL with a 1/16 inch fitting) controlled to micromodel for injecting PAM solution.NE‐1010, To monitor theEnterprises, flow processes in theTX, micromodel, a by the a precision syringe pump the (Kats Scientific, Kats Denton, USA) was high-resolution camera (Nikon D7000, resolution: 16.2 megapixels, Nikon, Tokyo, Japan) was used connected to the micromodel for injecting the PAM solution. To monitor the flow processes in the with computer-controlled image and video capture functions. micromodel, a high‐resolution camera (Nikon D7000, resolution: 16.2 megapixels, Nikon, Tokyo, Japan) was used with computer‐controlled image and video capture functions.
Materials 2016, 9, 16 Materials 2016, 9, 16
5 of 13
(a)
(b) Computer
Waste
Camera
Microfluidic Models
PAM
10 mm
Decane
20 mm
Syringe pump
Flow direction
Figure 4. Micromodel test: (a) schematic design of the setup and (b) micromodel used to represent a Figure 4. Micromodel test: (a) schematic design of the setup and (b) micromodel used to represent a two‐dimensional porous network. two-dimensional porous network.
The micromodel fabricated by Micronit Microfluidics BV is made out of fused silica. Customized The micromodel fabricated by Micronit Microfluidics BV is made out of fused silica. Customized pore networks are etched on two symmetrically patterned silica plates, which are then fused together pore networks are etched on two symmetrically patterned silica plates, which are then fused together to form a two‐dimensional porous network. The dimension of the patterned area is 20 mm × 10 mm, to form a two-dimensional porous network. The dimension of the patterned area is 20 mm ˆ 10 mm, and it contains 576 discoid silica grains (1186 pore bodies with 590‐μm diameter). The pore throat is and it contains 576 discoid silica grains (1186 pore bodies with 590-µm diameter). The pore throat is 20‐μm deep and ~30‐μm wide. Figure 4b shows the top view of the micromodel within a chip holder 20-µm deep and ~30-µm wide. Figure 4b shows the top view of the micromodel within a chip holder for protection and tubing connection. for protection and tubing connection. 3.4.2. Experimental Procedure 3.4.2. Experimental Procedure The micromodel was first cleaned by injecting 5 mL of absolute ethanol (Mallinckodt Baker, ACS The micromodel was first cleaned by injecting 5 mL of absolute ethanol (Mallinckodt Baker, reagent grad), and then by 30 mL of deionized water. After cleaning, the micromodel was oven‐dried ACS reagent grad), and then by 30 mL of deionized water. After cleaning, the micromodel was at 120 °C for 48 h. The experimental system was assembled as shown in Figure 4a. Two set of tests oven-dried at 120 ˝ C for 48 h. The experimental system was assembled as shown in Figure 4a. Two were conducted using the using micromodel. The first The set first was set the PAM solution injection into into the set of tests were conducted the micromodel. was the PAM solution injection air‐saturated micromodel under atmospheric conditions. PAM solution was injected into the the air-saturated micromodel under atmospheric conditions. PAM solution was injected into the micromodel at constant flow rates of 0.3, 1.0, and 50.0 μL/min. The injection was continued until the micromodel at constant flow rates of 0.3, 1.0, and 50.0 µL/min. The injection was continued until the PAM solution percolated the micromodel, and then additional one hundred pore volume (PV) units PAM solution percolated the micromodel, and then additional one hundred pore volume (PV) units of of PAM solution, which was sufficient to realize steady displacement, were eventually injected into PAM solution, which was sufficient to realize steady displacement, were eventually injected into the the micromodel. The second PAM injection solution into injection into the decane‐saturated micromodel. The second set wasset thewas PAMthe solution the decane-saturated micromodel. micromodel. A small tubing chamber was placed between the micromodel and the syringe pump A small tubing chamber was placed between the micromodel and the syringe pump that was filled that was filled with PAM solution and decane. Decane was always placed at an upper layer in this with PAM solution and decane. Decane was always placed at an upper layer in this chamber owing chamber owing to its lower density compared to the PAM solution, and was therefore, decane to its lower density compared to the PAM solution, and therefore, decane pumped first was and pumped first and the micromodel was initially saturated with decane. Then, the PAM solution was the micromodel was initially saturated with decane. Then, the PAM solution was injected into the injected into atthe micromodel at of constant rates of 0.3, The 1.0, injection and 50.0 continued μL/min. until The injection micromodel constant flow rates 0.3, 1.0,flow and 50.0 µL/min. no more continued no more was drained from the micromodel. Furthermore, additional decane wasuntil drained from decane the micromodel. Furthermore, additional one hundred PAM solutionone PV hundred PAM solution PV units were eventually injected into the micromodel after the PAM solution units were eventually injected into the micromodel after the PAM solution had percolated through the had percolated through the micromodel. The room temperature was constant at 24 °C. The images micromodel. The room temperature was constant at 24 ˝ C. The images and videos captured during and videos captured during these injection processes were analyzed using ImageJ to compute the these injection processes were analyzed using ImageJ to compute the biopolymer saturation, or PAM biopolymer saturation, or PAM solution‐decane displacement ratio, in the micromodel. solution-decane displacement ratio, in the micromodel. 4. Results 4. Results The experimental results for the contact angle, surface tension, viscosity, and flow characteristics The experimental results for the contact angle, surface tension, viscosity, and flow characteristics (micromodels) are are presented presented and and discussed discussed in in this this section. section. In addition, the implication of the test test (micromodels) In addition, the implication of the results to soil remediation is addressed. results to soil remediation is addressed.
5/13
Materials 2016, 9, 16 Materials 2016, 9, 16
6 of 13
Materials 2016, 9, 16
4.1. Contact Angle 4.1. Contact Angle 4.1. Contact Angle
Figure 5 shows sample snapshots of droplets of PAM solutions and water on the silica plate in Figure 5 shows sample snapshots of droplets of PAM solutions and water on the silica plate in air. It can be seen that the contact angles increase as the concentration of the PAM solutions increases. air. ItMaterials 2016, 9, 16 canFigure 5 shows sample snapshots of droplets of PAM solutions and water on the silica plate in be seen that the contact angles increase as the concentration of the PAM solutions increases. air. It can be seen that the contact angles increase as the concentration of the PAM solutions increases. In fact, fact, air, contact angle exhibits a linear relationship with the concentration of the PAM In inin air, thethe contact angle exhibits a linear relationship with the concentration of the PAM solution, 4.1. Contact Angle In fact, in air, the contact angle exhibits a linear relationship with the concentration of the PAM solution, in Figure 6a. In decane, the however, contact angles the PAM solutions are as shown as in shown Figure 6a. In decane, however, contactthe angles of the PAMof solutions are lower than solution, as shown in Figure 6a. In decane, however, the contact angles of the PAM solutions are Figure 5 shows sample snapshots of droplets of PAM solutions and water on the silica plate in lower than those of water, and the values are relatively constant within the concentration range of those of water, and the values are relatively constant within the concentration range of 2–20 g/L lower than those of water, and the values are relatively constant within the concentration range of air. It can be seen that the contact angles increase as the concentration of the PAM solutions increases. ˝ 2–20 g/L (Figure 6b). In both air and decane, the contact angles were less than 90°. (Figure 6b). In both air and decane, the contact angles were less than 90 . 2–20 g/L (Figure 6b). In both air and decane, the contact angles were less than 90°. In fact, in air, the contact angle exhibits a linear relationship with the concentration of the PAM solution, as shown in Figure 6a. In decane, however, the contact angles of the PAM solutions are lower than those of water, and the values are relatively constant within the concentration range of 2–20 g/L (Figure 6b). In both air and decane, the contact angles were less than 90°.
Figure 5. Contact angles at various PAM concentrations on the silica surface in air.
Figure 5. Contact angles at various PAM concentrations on the silica surface in air. Figure 5. Contact angles at various PAM concentrations on the silica surface in air.
Figure 5. Contact angles at various PAM concentrations on the silica surface in air.
Figure 6. Contact angles of PAM solutions on the silica surface: (a) in air and (b) in decane.
4.2. Surface Tension Figure 6. Contact angles of PAM solutions on the silica surface: (a) in air and (b) in decane. Figure 6. Contact angles of PAM solutions on the silica surface: (a) in air and (b) in decane. Figure 7 shows the results of the surface tension of the PAM solutions in air. It can be seen that Figure 6. Contact angles of PAM solutions on the silica surface: (a) in air and (b) in decane. 4.2. Surface Tension the PAM solutions have lower surface tension than deionized water, and the value of the surface 4.2. Surface Tension 4.2. Surface Tension tension decreases with increasing concentration. The decreasing trend of surface tension is steep up Figure 7 shows the results of the surface tension of the PAM solutions in air. It can be seen that Figure 7 shows the results of the surface tension of the PAM solutions in air. It can be seen that the to ~5 g/L, after which it decreases more slowly. Figure 7 shows the results of the surface tension of the PAM solutions in air. It can be seen that the PAM solutions surface tension than deionized the value of the surface PAMthe solutions havehave lowerlower surface tension than deionized water, water, and theand value of the surface tension PAM solutions have lower surface tension than deionized water, and the value of the surface tension decreases with increasing concentration. The decreasing trend of surface tension is steep up decreases with increasing concentration. The decreasing trend of surface tension is steep up to ~5 g/L, tension decreases with increasing concentration. The decreasing trend of surface tension is steep up to ~5 g/L, after which it decreases more slowly. after to ~5 g/L, after which it decreases more slowly. which it decreases more slowly.
Figure 7. Surface tension of PAM solutions in air.
6/13 Figure 7. Surface tension of PAM solutions in air. Figure 7. Surface tension of PAM solutions in air. Figure 7. Surface tension of PAM solutions in air.
6/13
6/13
Materials 2016, 9, 16 Materials 2016, 9, 16
7 of 13
4.3. Viscosity 4.3. Viscosity Figure Figure 88 shows shows the the results results of of the the viscosities viscosities of of the the PAM PAM solutions solutions with with respect respect to to their their ´−1 1 . The viscosity tends to increase as the concentrations at constant shear rates of 3.4, 6.8, 17, 34 and 68 s concentrations at constant shear rates of 3.4, 6.8, 17, 34 and 68 s . The viscosity tends to increase as the concentration increases, and it has a higher value at a lower temperature and at a higher shear rate. The concentration increases, and it has a higher value at a lower temperature and at a higher shear rate. The viscosity consistently increases with increasing concentration at high shear rates of 17–68 s´−11. However, . However, viscosity consistently increases with increasing concentration at high shear rates of 17–68 s ´−11 , the increasing trend seems less prominent for concentrations higher at lower shear rates of 3.4–6.8 s at lower shear rates of 3.4–6.8 s , the increasing trend seems less prominent for concentrations higher than 10–15 g/L. than 10–15 g/L. Figure 8a,e is regenerated and plotted with respect to temperature in Figure 9a,b, and it becomes Figure 8a,e is regenerated and plotted with respect to temperature in Figure 9a,b, and it becomes clear that the viscosity is inversely proportional to temperature. As the temperature increases, the time clear that the viscosity is inversely proportional to temperature. As the temperature increases, the of interaction between neighboring molecules of a liquid decreases because of the increased time of interaction between neighboring molecules of a liquid decreases because of the velocities increased of individual molecules. The intermolecular force decreases, therefore causing the viscosity of the velocities of individual molecules. The intermolecular force decreases, therefore causing the viscosity PAM solution to decrease. of the PAM solution to decrease. To investigate the effect of the shear rate explicitly, the viscosities are plotted in Figure 10 with To investigate the effect of the shear rate explicitly, the viscosities are plotted in Figure 10 with respect to the shear rates for the lowest and highest temperatures, 25 and 90 ˝ C. It is noted that the respect to the shear rates for the lowest and highest temperatures, 25 and 90 °C. It is noted that the viscosity is dependent on the shear rate, indicating that the biopolymer solution is a non-Newtonian viscosity is dependent on the shear rate, indicating that the biopolymer solution is a non‐Newtonian 1 , after which it fluid. The viscosity decreases with increasing shear rate up to approximately 20 s´−1 fluid. The viscosity decreases with increasing shear rate up to approximately 20 s , after which it becomes nearly constant at larger shear rates. becomes nearly constant at larger shear rates.
Figure 8. Cont. Figure 8. Cont.
7/13
Materials 2016, 9, 16 Materials 2016, 9, 16
8 of 13
Materials 2016, 9, 16 Materials 2016, 9, 16
−1 of (a) 3.4 s´1−1; ; (b) 6.8 s Figure 8. Viscosity with respect to concentration of the solution at shear rates of (a) 3.4 s Figure 8. Viscosity with respect to concentration of the solution at shear rates (b) 6.8 s´1; ;
−1; (b) 6.8 s−1; Figure 8. Viscosity with respect to concentration of the solution at shear rates of (a) 3.4 s −1 −1; and (e) 68 s−1. ´1 −1; (b) 6.8 s−1; (c) 17 s Figure 8. Viscosity with respect to concentration of the solution at shear rates of (a) 3.4 s (c) 17 s´1; (d) 34 s ; ; (d) 34 s (d) 34 s´1 ; and (e) 68 −1s. . −1 −1; and (e) 68 s (c) 17 s (c) 17 s−1; (d) 34 s−1; and (e) 68 s−1.
Figure 9. Viscosity with respect to temperature at shear rates of (a) 3.4 s Figure 9. Viscosity with respect to temperature at shear rates of (a) 3.4 s and (b) 68 s and (b) 68 s.. . . Figure 9. Viscosity with respect to temperature at shear rates of (a) 3.4 s and (b) 68 s Figure 9. Viscosity with respect to temperature at shear rates of (a) 3.4 s and (b) 68 s −1 ´1 −1 −1
−1 ´1 −1 −1
Figure 10. Viscosity with respect to shear rate at temperatures of (a) 25 °C and (b) 90 °C. Figure 10. Viscosity with respect to shear rate at temperatures of (a) 25 °C and (b) 90 °C. Figure 10. Viscosity with respect to shear rate at temperatures of (a) 25 ˝ C and (b) 90 ˝ C. Figure 10. Viscosity with respect to shear rate at temperatures of (a) 25 °C and (b) 90 °C.
The viscosity of the PAM solution is highly dependent on the concentration of the solution, The viscosity of the PAM solution is highly dependent on the concentration of the solution, shear rate, and temperature, as are both N and N cdependent . Therefore, it is important to properly determine The viscosity of of the the PAM solution is mmhighly on concentration the concentration the solution, The viscosity PAM solution is highly dependent on the of theof solution, shear shear rate, and temperature, as are both N and N c. Therefore, it is important to properly determine the concentration of the PAM solution and shear rate (and, in turn, the injection rate) and estimate shear rate, and temperature, as are both N m and N c . Therefore, it is important to properly determine rate, and temperature, as are both N and N . Therefore, it is important to properly determine the m c the concentration of the PAM solution and shear rate (and, in turn, the injection rate) and estimate the temperature distribution in the ground in order to design the soil remediation process and the concentration of the PAM solution and shear rate (and, in turn, the injection rate) and estimate concentration of the PAM solution and shear in rate (and,to indesign turn, the rate) and estimate the the temperature distribution in the ground order the injection soil remediation process and calculate its efficiency. the temperature distribution the ground in to order to the design soil remediation process and temperature distribution in thein ground in order design soil the remediation process and calculate calculate its efficiency. calculate its efficiency. its efficiency. 8/13 8/13
8/13
Materials 2016, 9, 16
9 of 13
Materials 2016, 9, 16 4.4. Micromodel Tests
Materials 2016, 9, 16
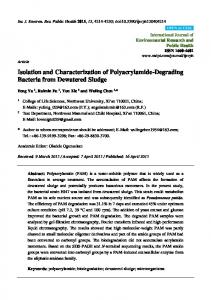
4.4. Micromodel Tests Figure 11 shows a series of snapshots of micromodels upon the injection of 10 g/L PAM solution with 4.4. Micromodel Tests additional one hundred times the PV after the first percolation through the micromodel. When Figure 11 shows a series of snapshots of micromodels upon the injection of 10 g/L PAM solution with additional one hundred times the PV first percolation through the micromodel. that these images were analyzed, it was found thatafter thethe displacement ratio increased at flow rates Figure 11 shows a series of snapshots of micromodels upon the injection of 10 g/L PAM solution When these images were analyzed, it was found that the displacement ratio increased at flow rates ranged from 59.4% atone 0.3hundred µL/min times to 90.1% 50after µL/min. Thepercolation distribution of thethe residual decane did with additional the at PV the first through micromodel. that ranged from 59.4% at 0.3 μL/min to 90.1% at 50 μL/min. The distribution of the residual decane not change significantly during the injection of a solution that had hundred times the PV, after the first When these images were analyzed, it was found that the displacement ratio increased at flow rates did not change significantly during the injection of a solution that had hundred times the PV, percolation for all the cases tested. that ranged from 59.4% at 0.3 μL/min to 90.1% at 50 μL/min. The distribution of the residual decane after the first percolation for all the cases tested.
did not change significantly during the injection of a solution that had hundred times the PV, after the first percolation for all the cases tested.
Figure 11. Snapshots of 10‐g/L PAM solution injection into the micromodel.
Figure 11. Snapshots of 10-g/L PAM solution injection into the micromodel.
Figure 12 shows the values of the displacement ratios with respect to flow rate. While the Figure 11. Snapshots of 10‐g/L PAM solution injection into the micromodel. displacement ratio of values the PAM against both air and with decane consistently increases Figure 12 shows the ofsolution the displacement ratios respect to flow rate. with While the increasing values of the flow rate, the effect of the flow rate is more prominent for decane. When the displacement ratio of thethe PAM solution both ratios air and decane Figure 12 shows values of the against displacement with respect consistently to flow rate. increases While the with displacement ratio is plotted with respect to the concentration of the solution (Figure 13), for both air increasing values of the flow rate, the effect of the flow rate is more prominent for decane. When displacement ratio of the PAM solution against both air and decane consistently increases with and decane saturated systems, the displacement ratio clearly shows an increasing trend for solution the displacement ratio is plotted with respect to the concentration of the solution (Figure 13), for increasing values of the flow rate, the effect of the flow rate is more prominent for decane. When the concentrations of up to 5 g/L. However, for larger concentrations, the relationship is not both displacement ratio is plotted with respect to the concentration of the solution (Figure 13), for both air airstraightforward but fluctuates slightly. The results (Figures 12 and 13) show that low flow rates and and decane saturated systems, the displacement ratio clearly shows an increasing trend for low concentrations of result in low levels of displacement ratios, which is a similar trend to the is not and decane saturated systems, the displacement ratio clearly shows an increasing trend for solution solution concentrations up to 5 g/L. However, for larger concentrations, the relationship multiphase flow of COto 2 and brine, as reported by Kuo et 12 al. (2011) [48]. The displacement ratio concentrations of up 5 g/L. However, for larger concentrations, the relationship is is not straightforward but fluctuates slightly. The results (Figures and 13) show that low flow rates and low higher for PAM solutions than deionized water; however, higher concentrations do not guarantee straightforward but fluctuates slightly. The results (Figures 12 and 13) show that low flow rates and concentrations result in low levels of displacement ratios, which is a similar trend to the multiphase higher displacement ratios. may be cost ratios, efficient at high rates trend but with low concentrations result in Soil low remediation levels of displacement which is a flow similar to the flow of moderate concentration levels (say, 5 g/L). CO2 and brine, as reported by Kuo et al. (2011) [48]. The displacement ratio is higher for PAM multiphase flow of CO2 and brine, as reported by Kuo et al. (2011) [48]. The displacement ratio is
solutions than deionized water; however, higher concentrations do not guarantee higher displacement higher for PAM solutions than deionized water; however, higher concentrations do not guarantee ratios.higher Soil remediation be cost at high ratesefficient but with levels displacement may ratios. Soil efficient remediation may flow be cost at moderate high flow concentration rates but with (say, 5moderate concentration levels (say, 5 g/L). g/L).
Figure 12. Displacement ratio with respect to flow rate in (a) an air saturated model and (b) a decane saturated model.
9/13 Figure 12. Displacement ratio with respect to flow rate in (a) an air saturated model and Figure 12. Displacement ratio with respect to flow rate in (a) an air saturated model and (b) a decane (b) a decane saturated model.
saturated model.
9/13
Materials 2016, 9, 16 Materials 2016, 9, 16
10 of 13
Figure13. 13.Displacement Displacementratio ratio with with respect anan airair saturated model andand (b) a Figure respect to to concentration concentration inin (a)(a) saturated model decane saturated model. (b) a decane saturated model.
4.5. Implication to Soil Remediation 4.5. Implication to Soil Remediation When the logarithmic values of the viscosity number (Nm) and capillary number (N m ) and capillary number (N c ) both exceed When the logarithmic values of the viscosity number (N c) both exceed a certain threshold, the flow has stable displacement and the displacement ratio is high (Figure 1). a certain threshold, the flow has stable displacement and the displacement ratio is high (Figure 1). In soil remediation using soil flushing, a higher displacement ratio indicates better remediation of In soil remediation using soil flushing, a higher displacement ratio indicates better remediation of contaminationin in soils. soils. For solution system, in which the injected fluid fluid is the PAM contamination For an an air-PAM air‐PAM solution system, in which the injected is the solution PAM and the defended fluid is air, Nm is higher when the viscosity of the injected PAM solution is higher solution and the defended fluid is air, N m is higher when the viscosity of the injected PAM solution (see Equation (1)). The PAM solution is a non-Newtonian fluid, as seen in Figure 10. In fact, the is higher (see Equation (1)). The PAM solution is a non‐Newtonian fluid, as seen in Figure 10. In fact, viscosity of biopolymer solutions, like that of other polymer solutions, is constant at low shear rate, the viscosity of biopolymer solutions, like that of other polymer solutions, is constant at low shear decreases with increasing shear rate at the moderate level of shear rate, and constant again at high rate, decreases with increasing shear rate at the moderate level of shear rate, and constant again at shear rate, whereas the viscosity of air is independent of the shear rate [49]. The viscosity of PAM high shear rate, whereas the viscosity of air is independent of the shear rate [49]. The viscosity of solution is also sensitive to the temperature and liquid concentration; the viscosity is higher when the PAM solution is also sensitive to the temperature and liquid concentration; the viscosity is higher temperature is lower (Figure 9), and the concentration is higher (Figure 8). As such, Nm is affected when the temperature is lower (Figure 9), and the concentration is higher (Figure 8). As such, N m is by the injecting rate, and the concentration of PAM solution, and ground temperature. The effect affected by the injecting rate, and the concentration of PAM solution, and ground temperature. of three controlling values, liquid concentration, injecting rate, and temperature, on Nc in Equation (2) The effect of three controlling values, liquid concentration, injecting rate, and temperature, on N c in is not as straightforward, though. The liquid concentration itself affects the viscosity of the injecting Equation (2) is not as straightforward, though. The liquid concentration itself affects the viscosity of the fluid (Figure 8), surface tension (Figure 7), and contact angle (Figure 6). The injecting rate affects the injecting fluid (Figure 8), surface tension (Figure 7), and contact angle (Figure 6). The injecting rate viscosity and velocity of the injecting fluid (Figure 10), and the temperature influences the viscosity of affects the viscosity and velocity of the injecting fluid (Figure 10), and the temperature influences the the injecting fluid (Figure 9). Thus, when designing a soil remediation process, one should be aware viscosity of the injecting fluid (Figure 9). Thus, when designing a soil remediation process, one should that the efficiency the remediation cannot be enhanced by simply increasing or decreasing be aware that the of efficiency of the remediation cannot be enhanced by simply increasing some or controlling value such as the liquid concentration or injecting rate. The temperature may be more decreasing some controlling value such as the liquid concentration or injecting rate. The temperature difficult to control; however, the seasonal and spatial variations of the ground temperature areground certainly may be more difficult to control; however, the seasonal and spatial variations of the an important factor to consider. The discussion of decane-PAM solutions is more complicated because temperature are certainly an important factor to consider. The discussion of decane‐PAM solutions phases are non-Newtonian fluids. Furthernon‐Newtonian research needs to be conducted to determine better the is both more complicated because both phases are fluids. Further research needs to be effect of controlling values and optimal design, including the effect of temperature on the displacement conducted to determine better the effect of controlling values and optimal design, including the effect ratio, which is equivalent to the remediation efficiency. Thus far, the obtained results indicate that low of temperature on the displacement ratio, which is equivalent to the remediation efficiency. Thus far, injecting rates and low concentrations result in low efficiency, and remediation can be cost-efficient the obtained results indicate that low injecting rates and low concentrations result in low efficiency, with a high injection rate and moderate concentration levels, as the increase in concentration above and remediation can be cost‐efficient with a high injection rate and moderate concentration levels, 5 g/L does not necessarily guarantee higher displacement. as the increase in concentration above 5 g/L does not necessarily guarantee higher displacement. 5. Conclusions 5. Conclusions A PAM solution was tested for contact angle, surface tension, viscosity, and flow characteristics A PAM solution was tested for contact angle, surface tension, viscosity, and flow characteristics (micromodels), and the implications to its applications were discussed. (micromodels), and the implications to its applications were discussed. In air, the contact angle of distilled water on a silica surface is ~40˝ ; however, it increases linearly In air, the contact angle of distilled water on a silica surface is ~40°; however, it increases linearly up to ~60˝ as the concentration of the PAM solution increases to 20 g/L. In decane, the contact angle up to ~60° as the concentration of the PAM solution increases to 20 g/L. In decane, the contact angle of
distilled water is ~71°; however, it decreases to 54°–59° when PAM is added. The surface tension 10/13
Materials 2016, 9, 16
11 of 13
of distilled water is ~71˝ ; however, it decreases to 54˝ –59˝ when PAM is added. The surface tension between the PAM solution and air decreases sharply with increasing concentrations up to ~5 mg/L; however, the rate of decrease subsequently becomes lesser. The viscosity of the PAM solution is highly dependent on the concentration of the solution, shear rate, and temperature, as are both Nm and Nc . Therefore, it is important to properly determine the concentration of the PAM solution and shear rate (and, in turn, the injection rate) and estimate the temperature distribution in the ground to design the soil remediation process and calculate the efficiency. The displacement ratio of the PAM solution against air and decane consistently increases with increasing values of flow rates. The effect of the flow rate is more prominent for decane. Low flow rates and low concentrations resulted in low levels of displacement ratios. The displacement ratio is higher for PAM solutions than for deionized water; however, higher concentrations do not guarantee higher displacement ratios. Soil remediation could be conducted cost-efficiently at high flow rates but with moderate concentration levels (~5 g/L). Further research needs to be conducted to better determine the effect of controlling values and optimal design, including the effect of temperature on the efficiency of remediation. Acknowledgments: This work was supported by the Fund for Innovative Engineering Research (FIER)—Round V grand award, and the Brain Korea 21 Plus Project in the Division of Creative Low Impact Development and Management for Ocean Port City Infrastructures. Author Contributions: Jongwon Jung and Jungyeon Jang conceived, designed, and performed the experiments. Jongwon Jung, Jungyeon Jang, and Jaehun Ahn analyzed the data and wrote the paper. All authors read and approved the final manuscript. Conflicts of Interest: The authors declare no conflict of interest.
References 1. 2. 3. 4.
5.
6.
7.
8. 9. 10.
Bate, B.; Zhao, Q.; Burns, S. Impact of organic coatings on frictional strength of organically modified clay. J. Geotech. Geoenviron. Eng. 2013, 140, 228–236. [CrossRef] Briscoe, W.H.; Klein, J. Friction and adhesion hysteresis between surfactant monolayers in water. J. Adhes. 2007, 83, 705–722. [CrossRef] Cabalar, A.; Canakci, H. Ground Improvement by Bacteria. In Proceedings of the 3rd Biot Conference on Poromechanics, Norman, OK, USA, 24–27 May 2005; pp. 707–712. Kang, J.; Sowers, T.D.; Duckworth, O.W.; Amoozegar, A.; Heitman, J.L.; McLaughlin, R.A. Turbidimetric determination of anionic polyacrylamide in low carbon soil extracts. J. Environ. Qual. 2013, 42, 1902–1907. [CrossRef] [PubMed] Kavazanjian, E., Jr.; Iglesias, E.; Karatas, I. Biopolymer soil stabilization for wind erosion control. In Proceedings of the 17th International Conference on Soil Mechanics and Geotechnical Engineering, Alexandria, Egypt, 5–9 October 2009; pp. 881–884. Martin, G.; Yen, T.; Karimi, S. Application of Biopolymer Technology in Silty Soil Matrices to form Impervious Barriers. In Proceedings of the 7th Australia-New Zealand Geomechanics Conference, Adelaide, Australia, 1–5 July 1996. Nugent, P.E.; Sullivan, M.; Cenko, S.B.; Thomas, R.C.; Kasen, D.; Howell, D.A.; Bersier, D.; Bloom, J.S.; Kulkarni, S.; Kandrashoff, M.T. Supernova sn 2011fe from an exploding carbon-oxygen white dwarf star. Nature 2011, 480, 344–347. [CrossRef] [PubMed] Yoshizawa, H.; Chen, Y.L.; Israelachvili, J. Fundamental mechanisms of interfacial friction. 1. Relation between adhesion and friction. J. Phys. Chem. 1993, 97, 4128–4140. [CrossRef] Blokker, N. Analysis of Alginate-Like Exopolysaccharides for the Application in Enhanced Oil Recovery. Master Thesis, Delft University of Technology, Delft, The Netherlands, 18 September 2014. Hove, K.; Pedersen, O.; Garmo, T.H.; Hansen, H.S.; Staaland, H. Fungi: A major source of radiocesium contamination of grazing ruminants in Norway. Health Phys. 1990, 59, 189–192. [CrossRef] [PubMed]
Materials 2016, 9, 16
11.
12. 13. 14. 15. 16. 17. 18. 19. 20. 21. 22. 23. 24. 25. 26. 27. 28. 29.
30. 31. 32. 33. 34. 35.
12 of 13
Pollock, T.J.; Thorne, L.; Yamazaki, M.; Mikolajczak, M.J.; Armentrout, R.W. Mechanism of bacitracin resistance in gram-negative bacteria that synthesize exopolysaccharides. J. Bacteriol. 1994, 176, 6229–6237. [PubMed] Kosaric, N. Biosurfactants and their application for soil bioremediation. Food Technol. Biotechnol. 2001, 39, 295–304. Meuser, H. Contaminated Urban Soils; Springer Science & Business Media: Berlin/Heidelberg, Germany, 2010; Volume 18. Daripa, P.; Pa¸sa, G. On capillary slowdown of viscous fingering in immiscible displacement in porous media. Transp. Porous Media 2008, 75, 1–16. [CrossRef] Mulligan, C.N. Environmental applications for biosurfactants. Environ. Pollut. 2005, 133, 183–198. [CrossRef] [PubMed] Chai, J.C.; Miura, N. Field vapor extraction test and long-term monitoring at a PCE contaminated site. J. Hazard. Mater. 2004, 110, 85–92. [CrossRef] [PubMed] Cho, J.S.; Wilson, J.T.; DiGiulio, D.C.; Vardy, J.A.; Choi, W. Implementation of natural attenuation at a jp-4 jet fuel release after active remediation. Biodegradation 1997, 8, 265–273. [CrossRef] [PubMed] Tse, K.K.; Lo, S.L.; Wang, J.W. Pilot study of in-situ thermal treatment for the remediation of pentachlorophenol-contaminated aquifers. Environ. Sci. Technol. 2001, 35, 4910–4915. [CrossRef] [PubMed] Mulligan, C.N.; Eftekhari, F. Remediation with surfactant foam of PCP-contaminated soil. Eng. Geol. 2003, 70, 269–279. [CrossRef] Knox, R.C.; Sabatini, D.A. Transport and Remediation of Subsurface Contaminants; American Chemical Society: Washington, DC, USA, 1992. Lee, M.; Kim, J.; Kim, I. In-situ biosurfactant flushing, coupled with a highly pressurized air injection, to remediate the bunker oil contaminated site. Geosci. J. 2011, 15, 313–321. [CrossRef] Khatami, H.R.; O’Kelly, B.C. Improving mechanical properties of sand using biopolymers. J. Geotech. Geoenviron. Eng. 2012, 139, 1402–1406. [CrossRef] Jafvert, C.T. Surfactants/Cosolvents; Ground-Water Remediation Technologies Analysis Center: Pittsburgh, PA, USA, 1996. Jawitz, J.W.; Annable, M.D.; Rao, P. Miscible fluid displacement stability in unconfined porous media: Two-dimensional flow experiments and simulations. J. Contam. Hydrol. 1998, 31, 211–230. [CrossRef] Lee, M.; Kang, H.; Do, W. Application of nonionic surfactant-enhanced in situ flushing to a diesel contaminated site. Water Res. 2005, 39, 139–146. [CrossRef] [PubMed] Mulligan, C.; Yong, R.; Gibbs, B. Remediation technologies for metal-contaminated soils and groundwater: An evaluation. Eng. Geol. 2001, 60, 193–207. [CrossRef] Park, J.Y.; Kim, S.J.; Lee, Y.J.; Baek, K.; Yang, J.W. Ek-fenton process for removal of phenanthrene in a two-dimensional soil system. Eng. Geol. 2005, 77, 217–224. [CrossRef] Tsai, T.T.; Kao, C.M.; Yeh, T.Y.; Liang, S.H.; Chien, H.Y. Remediation of fuel oil-contaminated soils by a three-stage treatment system. Environ. Eng. Sci. 2009, 26, 651–659. [CrossRef] Zhou, W.; Fu, H.; Pan, K.; Tian, C.; Qu, Y.; Lu, P.; Sun, C.C. Mesoporous TiO2 /α-Fe2 O3 : Bifunctional composites for effective elimination of arsenite contamination through simultaneous photocatalytic oxidation and adsorption. J. Phys. Chem. C 2008, 112, 19584–19589. [CrossRef] Lake, P.S. Flow-Generated disturbances and Ecological Responses: Floods and Droughts. In Hydroecology and Ecohydrology: Past, Present and Future; Wiley Press: New York, NY, USA, 2008; pp. 75–92. Sorbie, K. Polymer-Improved Oil Recovery; Springer Science+Business Media: Berlin, Germany, 1991; Chapter 1; pp. 1–5. Lenormand, R. Liquids in porous media. J. Phys. Condens. Matter 1990, 2, SA79. [CrossRef] Lenormand, R.; Touboul, E.; Zarcone, C. Numerical models and experiments on immiscible displacements in porous media. J. Fluid Mech. 1988, 189, 165–187. [CrossRef] Buchgraber, M. An enhanced oil recovery micromodel study with associative and conventional polymers. Master Thesis, University of Leoben, Leoben, Austria, September 2008. Hayden, M.K.; Bonten, M.J.; Blom, D.W.; Lyle, E.A.; van de Vijver, D.A.; Weinstein, R.A. Reduction in acquisition of vancomycin-resistant enterococcus after enforcement of routine environmental cleaning measures. Clin. Infect. Dis. 2006, 42, 1552–1560. [CrossRef] [PubMed]
Materials 2016, 9, 16
36. 37. 38. 39.
40.
41.
42. 43.
44. 45.
46. 47. 48. 49.
13 of 13
Lenormand, R.; Zarcone, C.; Sarr, A. Mechanisms of the displacement of one fluid by another in a network of capillary ducts. J. Fluid Mech. 1983, 135, 337–353. [CrossRef] Bruun, J.; Hicks-Bruun, M. Isolation of n-decane from petroleum by distillation and equilibrium melting. J. Res. Nat. Bur. Stand. 1932, 8, 583–589. [CrossRef] Fan, R.; Guo, S.; Li, T.; Li, F.; Yang, X.; Wu, B. Contributions of electrokinetics and bioremediation in the treatment of different petroleum components. Clean Soil Air Water 2015, 43, 251–259. [CrossRef] Fu, W.J.; Chi, Z.; Ma, Z.C.; Zhou, H.X.; Liu, G.L.; Lee, C.F.; Chi, Z.M. Hydrocarbons, the advanced biofuels produced by different organisms, the evidence that alkanes in petroleum can be renewable. Appl. Microbiol. Biotechnol. 2015, 99, 7481–7494. [CrossRef] [PubMed] Margesin, R.; Moertelmaier, C.; Mair, J. Low-temperature biodegradation of petroleum hydrocarbons (n-alkanes, phenol, anthracene, pyrene) by four actinobacterial strains. Int. Biodeterior. Biodegrad. 2013, 84, 185–191. [CrossRef] Bertrand, E.M.; Keddis, R.; Groves, J.T.; Vetriani, C.; Austin, R.N. Identity and mechanisms of alkane-oxidizing metalloenzymes from deep-sea hydrothermal vents. Front. Microbiol. 2013, 4. [CrossRef] [PubMed] Zemo, D.A.; Bruya, J.E.; Graf, T.E. The application of petroleum hydrocarbon fingerprint characterization in site investigation and remediation. Ground Water Monit. Remediat. 1995, 15, 147–156. [CrossRef] Rayner, J.L.; Snape, I.; Walworth, J.L.; Harvey, P.M.; Ferguson, S.H. Petroleum-hydrocarbon contamination and remediation by microbioventing at sub-antarctic macquarie island. Cold Reg. Sci. Technol. 2007, 48, 139–153. [CrossRef] Nadim, F.; Hoag, G.E.; Liu, S.; Carley, R.J.; Zack, P. Detection and remediation of soil and aquifer systems contaminated with petroleum products: An overview. J. Pet. Sci. Eng. 2000, 26, 169–178. [CrossRef] Zyakun, A.; Nii-Annang, S.; Franke, G.; Fischer, T.; Buegger, F.; Dilly, O. Microbial activity and 13c/12c ratio as evidence of n-hexadecane and n-hexadecanoic acid biodegradation in agricultural and forest soils. Geomicrobiol. J. 2012, 29, 570–584. [CrossRef] Sinha, P.K.; Wang, C.Y. Pore-network modeling of liquid water transport in gas diffusion layer of a polymer electrolyte fuel cell. Electrochim. Acta 2007, 52, 7936–7945. [CrossRef] Barvenik, F.W. Polyacrylamide characteristics related to soil applications. Soil Sci. 1994, 158, 235–243. [CrossRef] Kuo, C.W.; Perrin, J.C.; Benson, S.M. Simulation studies of effect of flow rate and small scale heterogeneity on multiphase flow of CO2 and brine. Energy Procedia 2011, 4, 4516–4523. [CrossRef] Picout, D.R.; Ross-Murphy, S.B. Rheology of biopolymer solutions and gels. Sci. World J. 2003, 3, 105–121. [CrossRef] [PubMed] © 2016 by the authors; licensee MDPI, Basel, Switzerland. This article is an open access article distributed under the terms and conditions of the Creative Commons by Attribution (CC-BY) license (http://creativecommons.org/licenses/by/4.0/).