applied sciences Article
Chord Recognition Based on Temporal Correlation Support Vector Machine Zhongyang Rao 1,2 , Xin Guan 1, * and Jianfu Teng 1 1 2
*
School of Electronic Information Engineering, Tianjin University, Tianjin 30072, China;
[email protected] (Z.R.);
[email protected] (J.T.) School of Information Science and Electronic Engineering, Shandong Jiaotong University, Ji’nan 250357, China Correspondence:
[email protected]; Tel.: +86-186-6890-9802
Academic Editor: Vesa Valimaki Received: 11 February 2016; Accepted: 6 May 2016; Published: 19 May 2016
Abstract: In this paper, we propose a method called temporal correlation support vector machine (TCSVM) for automatic major-minor chord recognition in audio music. We first use robust principal component analysis to separate the singing voice from the music to reduce the influence of the singing voice and consider the temporal correlations of the chord features. Using robust principal component analysis, we expect the low-rank component of the spectrogram matrix to contain the musical accompaniment and the sparse component to contain the vocal signals. Then, we extract a new logarithmic pitch class profile (LPCP) feature called enhanced LPCP from the low-rank part. To exploit the temporal correlation among the LPCP features of chords, we propose an improved support vector machine algorithm called TCSVM. We perform this study using the MIREX’09 (Music Information Retrieval Evaluation eXchange) Audio Chord Estimation dataset. Furthermore, we conduct comprehensive experiments using different pitch class profile feature vectors to examine the performance of TCSVM. The results of our method are comparable to the state-of-the-art methods that entered the MIREX in 2013 and 2014 for the MIREX’09 Audio Chord Estimation task dataset. Keywords: music information retrieval; hidden Markov models; robust principal component analysis; pitch class profile; chord estimation
1. Introduction A musical chord can be defined as a set of notes played simultaneously. A succession of chords over time forms the harmony core in a piece of music. Hence, the compact representation of the overall harmonic content and structure of a song often requires labeling every chord in the song. Chord recognition has been applied in many applications such as the segmentation of pieces into characteristic segments, the selection of similar pieces, and the semantic analysis of music [1,2]. With its many applications, automatic chord recognition has been one of the main fields of interest in musical information retrieval in the last few years. The basic chord recognition system has two main steps: feature extraction and chord classification. In the first step, the features used in chord recognition are typically variants of the pitch class profile (PCP) introduced by Fujishima (1999) [1]. Many publications have improved PCP features for chord recognition by addressing potentially negative influences such as percussion [2], mistuning [3,4], harmonics [5–7], or timbre dependency [5,8]. In particular, harmonic contents are abundant in both musical instrument sounds and the human singing voice. However, harmonic patterns in instrument sounds are more regular compared with the singing voice, which often includes ornamental features such as vibrato that lead to significant deviations of the frequency of partials from perfectly
Appl. Sci. 2016, 6, 157; doi:10.3390/app6050157
www.mdpi.com/journal/applsci
Appl. Sci. 2016, 6, 157
2 of 14
harmonic [9]. To attenuate the effect of the singing voice and consider the temporal correlations of music, we separate the singing voice from the accompaniment before obtaining the PCP. Chord classification is computed once the feature has been extracted. Modeling techniques typically use template-fitting methods [1,3,10–13], the hidden Markov model (HMM) [14–20], and dynamic Bayesian networks [21,22] for this recognition process. The template-based method has some advantages, including the fact that it does not require annotated data and has a low computational time. However, its drawbacks include the problem of creating a model of templates of chroma vectors and the selection of a distance measure. The HMM method is a statistical model and its parameter estimation requires substantial training data. The recognition rate of the HMM method is typically relatively high, but it only considers the role of positive training samples without addressing the impact of negative training samples, thereby greatly limiting its discriminative ability. The support vector machine (SVM) method can achieve a high recognition rate, but encounters challenges in the presence of cross-aliasing that cannot be accurately judged. The main difference between HMM and SVM is in the principle of risk minimization [23]. HMM uses empirical risk minimization, which is the simplest induction principle. In contrast, SVM uses structural risk minimization as its induction principle. The difference in risk minimization leads to the better generalization performance of SVM compared with HMM [24]. We present a new method for chord estimation based on a hybrid model of HMM and SVM. The remainder of this paper is organized as follows: Section 2 reviews related chord estimation work; Section 3 describes our PCP feature vector construction method; Section 4 explains our approach; Section 5 displays the results on the MIREX’09 (Music Information Retrieval Evaluation eXchange) dataset and a provides a comparison with other methods; and Section 6 concludes our work and suggests directions for future work. 2. Related Work PCP is also called the chroma vector, which is often a 12-dimensional vector whereby each component represents the spectral energy or salience of a semi-tone on the chromatic scale regardless of the octave. The computation of the chroma representation of an audio recording is typically based either on the short-time Fourier transform (STFT) in combination with binning strategies [18,25–27] or on the constant Q transform [3,6,15,28,29]. The succession of these chroma vectors over time is often called the chromagram and this forms a suitable representation of the musical content of a piece. Many features have been used for chord recognition including non-negative least squares [30], chroma DCT (Discrete Cosine Transform)-reduced log pitch (CRP) [31], loudness-based chromagram (LBC) [22], and Mel PCP (MPCP) [32]. In [1], Fujishima developed a real-time chord recognition system using a 12-dimensional pitch class profile derived from the discrete Fourier transform (DFT) of the audio signal, and performed pattern matching using binary chord-type templates. Lee [6] introduced a new input feature called the enhanced pitch class profile (EPCP) using the harmonic product spectrum. Gómez and Herrera [33] used harmonic pitch class profile (HPCP) as the feature vector, which is based on Fujishima’s PCP, and correlated it with a chord or key model adapted from Krumhansl’s cognitive study. Variants of the pitch class profile (PCP) first introduced by Fujishima (1999) [1] address the potentially negative influences of percussion [2], mistuning [3,4], harmonics [5–7] or timbre dependency [5,8]. In addition to these factors, we explore ways to attenuate the influence of the singing voice. Weil introduced an additional pre-processing step for main melody attenuation [34]. To attenuate the negative influence of singing voices, we consider the amplitude similarity of neighborhood musical frames belonging to the same chord and obtain the enhanced PCP. Adding a pre-processing step consisting of robust principal component analysis (RPCA), we expect the low-rank matrix to contain the musical accompaniment and the sparse matrix to contain the vocal signals. Then, the low-rank matrix can be used to calculate the features. The pre-processing considers the temporal correlations of music.
Appl. Sci. 2016, 6, 157
3 of 15
vocal signals. Then, the low-rank matrix can be used to calculate the features. The pre-processing considers the temporal correlations of music. The two most popular chord estimation methods are the template-based model and3 ofthe Appl. Sci. 2016, 6, 157 14 hidden Markov model. For the audio chord estimation task of MIREX 2013 and 2014, one of the most popular methods is HMM [35–41]. A binary chord template with three harmonics was also The two most popular chord estimation methods are the template-based model and the hidden presented [42]. Markov model. For thechord audiorecognition chord estimation task use of MIREX 2013definition and 2014, one of the most Template-based methods the chord to extract chordpopular labels methods is HMMpiece. [35–41]. A binary chorddata template with threemusic harmonics wasknowledge also presented [42].for from a musical Neither training nor extensive theory is used Template-based chord recognition methods use the chord and definition to the extract chord labels from a this purpose [43]. To smooth the resulting representation exploit temporal correlation, musical piece. Neither training data nor extensive music theory knowledge is used for this purpose [43]. low-pass and median filters are used to filter the chromagram in the time domain [10]. The To smooth the resulting andfragmented exploit the temporal correlation, low-pass and median template-based methodrepresentation only outputs transcriptions without considering the filters are correlations used to filterofthe chromagram in the time domain [10]. The template-based method only temporal music. outputs without considering the temporal correlations hidden of music. Thefragmented HMM can transcriptions model sequences of events in a temporal grid considering and visible The HMM model sequences of events a temporal considering hidden and visible variables. In thecan case of chord recognition, thein hidden statesgrid correspond to the real chords that variables. the case of chord recognition, the statesvectors. correspond to the realand chords that are being In played, while the observations are hidden the chroma In [35], Cho Bello useare a being played, while the observations are the chroma vectors. In [35], Cho and Bello use a K-stream K-stream HMM which is then decoded using the standard Viterbi algorithm. Khadkevich and HMM which thena decoded using HMM, the standard Viterbi algorithm. Khadkevich and Omologo Omologo alsois use multi-stream but the feature is a time-frequency reassignment also use a multi-stream HMM, but feature is a time-frequency reassignment spectrogram spectrogram [36]. Steenbergen andthe Burgoyne present a chord estimation method based on [36]. the Steenbergen and Burgoyne present chord estimation method based on the combination combination of a neural network andaan HMM [40]. In [39], the probabilities of the HMM areof nota neural network an HMM [40]. In [39], the probabilities of the HMM learning are not trained through trained throughand expectation-maximization (EM) or any other machine technique, but expectation-maximization or any other machine learning technique, butMcVicar are instead derived are instead derived from a(EM) number of knowledge-based sub-models. Ni and proposed a from a number of knowledge-based sub-models. Ni and McVicar proposed a harmony progression harmony progression HMM topology that consists of three hidden and two observed variables HMMThe topology that consistscorrespond of three hidden andkey twoK,observed variables variables [37]. hidden variables to the the chord C, and[37]. the The basshidden annotations B. correspond to theusually key K, the chordaC,reference and the bass annotations These methods usually require These methods require dataset for the B. learning period and entail morea reference dataset the learning period and entail more parameters to be trained. parameters to be for trained. In contrast, trained from thethe reference dataset, which is the In contrast, our ourmethod methodhas hasonly onlyone oneparameter parameter trained from reference dataset, which is state transition probability, and the parameters are obtained from the SVM. hybrid HMM the state transition probability, andother the other parameters are obtained from the The SVM. The hybrid and SVM theuses respective advantages of these methods. Our novelOur method called the HMM andmodel SVM uses model the respective advantages of these methods. novelismethod is temporal support vector machine (TCSVM). called thecorrelation temporal correlation support vector machine (TCSVM). Our system twotwo main steps: feature extraction and chord classification, as shown Our systemisiscomposed composedof of main steps: feature extraction and chord classification, as in Figure We pre-process the audio separate the singing voice. voice. The system then then trackstracks beat shown in 1. Figure 1. We pre-process the to audio to separate the singing The system intervals in theinmusic and extracts a setaofsetvectors for the In the classification step,step, our beat intervals the music and extracts of vectors for PCP. the PCP. Inchord the chord classification method uses SVM and theand Viterbi Because we employ temporal our method uses classification SVM classification the algorithm. Viterbi algorithm. Because wethe employ thecorrelation temporal of chords, the system can thecombine SVM with Viterbi leading to a TCSVM. The correlation of chords, the combine system can thethe SVM withalgorithm, the Viterbi algorithm, leading to a Viterbi algorithm usesalgorithm the transitions between chords to estimate thetochords. TCSVM. The Viterbi uses the transitions between chords estimate the chords.
Figure system. Figure 1. 1. Chord Chord estimation estimation system.
3. Enhanced PCP Feature 3. Enhanced PCP Feature 3.1. Normalized NormalizedLogarithmic Logarithmic PCP Feature 3.1. PCP Feature Our systembegins beginsbybyextracting extracting suitable feature vectors the audio. raw audio. Like chord most Our system suitable feature vectors fromfrom the raw Like most chord recognition systems, we use a chromagram or a PCP vector as the feature vector. Müller recognition systems, we use a chromagram or a PCP vector as the feature vector. Müller and Ewert and Ewert propose a 12-dimensional feature vector–quantized PCP [8,29] the thatproper determines the propose a 12-dimensional feature vector–quantized PCP [8,29] that determines frequency proper frequency resolution and is sufficient for separating musical notes by low-frequency resolution and is sufficient for separating musical notes by low-frequency components. components. The calculation of PCP feature vectors can be divided into the following steps: (1) using the
constant Q transform to calculate the 36-bin chromagram; (2) mapping the spectral chromagram to a particular semitone; (3) median filtering; (4) segmenting the audio signal with a beat-tracking algorithm; (5) reducing the 36-bin chromagram to a 12-bin chromagram based on beat-synchronous
Appl. Sci. 2016, 6, 157 Appl. Sci. 2016, 6, 157
4 of 15 4 of 15
The calculation of PCP feature vectors can be divided into the following steps: (1) using the The calculation of PCP feature vectors can be divided into the following steps: (1) using the constant Q transform to calculate the 36-bin chromagram; (2) mapping the spectral chromagram constant Q transform to calculate the 36-bin chromagram; (2) mapping the spectral chromagram Appl. Sci. 2016, 6, 157 4 of 14 to a particular semitone; (3) median filtering; (4) segmenting the audio signal with a beat-tracking to a particular semitone; (3) median filtering; (4) segmenting the audio signal with a beat-tracking algorithm; (5) reducing the 36-bin chromagram to a 12-bin chromagram based on algorithm; (5) reducing the 36-bin chromagram to a 12-bin chromagram based on beat-synchronous segmentation; (6) normalizing the The 12-bin chromagram. The is referred segmentation; (6) normalizing the 12-bin chromagram. reader is referred to [15]reader for more detailed beat-synchronous segmentation; (6) normalizing the 12-bin chromagram. The reader is referred to [15] for more steps. detailed PCP calculation steps. PCP calculation to [15] for more detailed PCP calculation steps. In the beat-synchronous beat-synchronous (tactus)segmentation, segmentation, weuse usethe the beat-tracking algorithm proposed In beat-tracking algorithm proposed by In the the beat-synchronous(tactus) (tactus) segmentation,we we use the beat-tracking algorithm proposed by Ellis [44]. This method has proven successful for a wide variety of signals. Using Ellis [44]. This method has proven successful for a wide variety of signals. Using beat-synchronous by Ellis [44]. This method has proven successful for a wide variety of signals. Using beat-synchronous segments has that the added advantage that theis resulting is a segments has the added advantage resulting representation function representation of the beat, or tactus, beat-synchronous segments has the the added advantage that the aresulting representation is a function of the beat, or tactus, rather than time. rather than time. function of the beat, or tactus, rather than time. Unlike mostofofthe the traditional PCP methods, we determine the normalized valuethe using the Unlike PCP methods, we determine the normalized value using p-norm Unlike most most of thetraditional traditional PCP methods, we determine the normalized value using the p-norm and logarithm. The formula is as follows: and logarithm. The formula as follows: p-norm and logarithm. The is formula is as follows: QPCPlog ( p ) = log10 [C ⋅ QPCP12 ( p ) + 1] (1) QPCP log1010rC [C ¨⋅ QPCP p ) +` 1]1s ( p“) = (1) QPCP ppq log QPCP1212( ppq (1) loglog (2) (2) (2)
/ |QPCP QPCP QPCP QPCPloglog || ( p ){| ppq( p“) = QPCP QPCP log ppq normnorm log QPCP norm ( p ) = QPCPlog ( p ) / QPCPlog
After applying is is called thethe LPCP. After applying the the logarithm logarithmand andnormalization, normalization,the thechromagram chromagram called LPCP. After applying the logarithm and normalization, the chromagram is called the LPCP. The left image of Figure 2 shows a PCP of the C major triad and the right image shows its LPCP. The left image of Figure 2 shows a PCP of the C major triad and the right image shows its The left image of Figure 2 shows a PCP of the C major triad and the right image shows its The strongest peaks arepeaks foundare at C, E, andatGC, because major triad threecomprises notes at C (root), LPCP. The strongest found E, andthe GC because the comprises C major triad three LPCP. The strongest peaks are found at C, E, and G because the C major triad comprises three E (third), G (fifth). demonstrates LPCP2more clearly approximates underlying notes at and C (root), E Figure (third),2 and G (fifth).that Figure demonstrates that LPCPthe more clearly notes at C (root), E (third), and G (fifth). Figure 2 demonstrates that LPCP more clearly fundamental frequencies thanfundamental PCP. approximates the underlying frequencies than PCP. approximates the underlying fundamental frequencies than PCP.
PitchClass Class Pitch
PitchClass Class Pitch
PCP of C Major Triad LPCP of C Major Triad B PCP of C Major Triad B LPCP of C Major Triad B B A# 1.5 A# A# 1.5 A# A A A A G# G# G# G# G G G G 1 F# F# 1 F# F# F F F F E E E E D# D# 0.5 D# D# 0.5 D D D D C# C# C# C# C C C C 0 2 4 0 2 4 Time(s) Time(s) 0 2 4 0 2 4 Time(s) Time(s)
1.2 1.2 1 1 0.8 0.8 0.6 0.6 0.4 0.4
Figure 2. PCP (logarithmic pitch class Figure PCP (pitch (pitch class class profile) profile) (left) (left) and and LPCP LPCP class profile) profile) (right) (right) of of C C Figure 2. 2. PCP (pitch class profile) (left) and LPCP (logarithmic (logarithmic pitch pitch class profile) (right) of C major triad. major triad. major triad.
3.2. Enhanced PCP with Singing-Voice Separation 3.2. Enhanced EnhancedPCP PCPwith with Singing-Voice Separation 3.2. Singing-Voice Separation To attenuate the effect of the singing voice and consider the temporal correlations of the To attenuate attenuatethe theeffect effectofof singing voice consider the temporal correlations of the To thethe singing voice andand consider the temporal correlations of the chord, chord, we first separate the singing voice from the accompaniment before calculating the PCP or chord, first separate the voice singing voice from the accompaniment before calculating PCP or we firstwe separate the singing from the accompaniment before calculating the PCP or the LPCP. This LPCP. This is denoted as enhanced PCP (EPCP) or enhanced logarithmic PCP (ELPCP). The LPCP. This denotedPCP as (EPCP) enhanced PCP (EPCP) or enhanced logarithmic PCP (ELPCP). The is denoted as is enhanced or enhanced logarithmic PCP (ELPCP). The framework of singing framework of singing voice separation is shown in Figure 3. framework of singing voice separation voice separation is shown in Figure 3. is shown in Figure 3.
Figure 3. Calculation of enhanced PCP (EPCP). Figure enhanced PCP PCP(EPCP). (EPCP). Figure 3. 3. Calculation Calculation of of enhanced
In general, because of the underlying repeated musical structure, we assume that music is a In general, because of the underlying repeated musical structure, we assume that music is a In general, the underlying musical structure, we rank assume is a low-rank signal.because Singingofvoices offer morerepeated variation and have a higher butthat are music relatively low-rank signal. Singing voices offer more variation and have a higher rank but are relatively low-rank signal. Singing voices offer more variation and have a higher rank but are relatively sparse sparse in the frequency domain. We assume that the low-rank matrix A represents the music sparse in the frequency domain. We assume that the low-rank matrix A represents the music in the frequency domain. assume thatEthe low-rank the matrix A represents theThen, musicwe accompaniment accompaniment and the We sparse matrix represents vocal signals [45]. perform the accompaniment and the sparse matrix E represents the vocal signals [45]. Then, we perform the and the sparse matrix E represents the vocal signals [45]. Then, we perform the separation steps. separation in two steps. First, we compute the spectrogram of music signals in matrix in D,two which is separation in two steps. First, we compute the spectrogram of music signals in matrix D, which is First, we compute theSTFT. spectrogram music in matrix D, whichLagrange is calculated from the STFT. calculated from the Second,ofwe use signals the inexact augmented multiplier (ALM) calculated from the STFT. Second, we use the inexact augmented Lagrange multiplier (ALM) Second, we use the inexact augmented Lagrange multiplier (ALM) method [45], which is an efficient algorithm for solving the RPCA problem, to solve A + E = |D|, given the input magnitude of D. Then,
given the input magnitude of D. Then, using RPCA, we can separate matrices A and E. The low-rank matrix A can be exactly recovered from D = A + E by solving the following convex optimization problem:
Minimize A * + λ E
Appl. Sci. 2016, 6, 157
Subject to A + E = D
1
(3)
5 of 14
where λ is a positive weighting parameter. The inexact ALM method is as follows [45]:
using RPCA, we can separate matrices A and E. The low-rank matrix A can be exactly recovered from Algorithm 1: Inexact ALM Algorithm D = A + E by solving the following convex optimization problem: Input: matrix D , parameter λ 1: Y0* = D / J ( D); E0 = Minimize| 0;μ 0 > 0;ρ >|A| 1; k |= ˚0`. λ||E||1 Subject to A ` E “ D (3) 2: while not converged do where a positive ALM method is as follows [45]: 3: λ is // lines 4–5weighting solve Ak +1parameter. = arg min LThe ( A, Einexact k , Yk ,μ k ) . A
4: (U , S , V= ) svd ( D − Ek + μ −k 1Yk ) ; Algorithm 1: Inexact ALM Algorithm 5: Ak +1 = USμ −1 [ S ]V T . Input: matrix D,k parameter λ 6:1:// Yline , E1; , Ykk ,μ ). ˚ 7 solves E +1 =“arg 0;Emin µ0 ąL(0;Akρ+1ą “k0. 0 “ D{JpDq;kE 0 1 7:2: Ewhile [converged Snot D − Ak +1 + μ −kdo Yk ] . 1 k += λμ −k 1 3: // lines 4–5 solve Ak`1 “ argmin LpA, Ek , Yk , µk q. 8: Yk +1 =Yk + μ k [ D − Ak +1 − Ek +1 ] . A ´1 4: pU, S, Vq “ svdpD ´ E ` µ Y q; 9: μ k +1 = ρμ k . k k k 5: Ak`1 “ USµ´1 rSsV T . 10: k= k + 1 . k 6: end // line 7 solves Ek`1 “ argmin LpAk`1 , E, Yk , µk q. 11: while E
Output: 1 Y s. 7: E( kA`k 1, E“k ).Sλµ´1 rD ´ Ak`1 ` µ´ k k k
8: Yk`1 “ Yk ` µk rD ´ Ak`1 ´ Ek`1 s. Figure 4 shows the PCP and EPCP of an audio music piece (the music is “Baby It’s You”, 9: µk`1 “ ρµk . from the Beatles’ album Please Please Me). Figure 5 shows the LPCP and ELPCP of the same 10: k “ k ` 1. musical piece. 11: end while Figure 4 shows that the EPCP has improved continuity compared with the PCP. Figure 5 shows Output: (Ak , Ek ). that the ELPCP is further enhanced compared with the LPCP. In Figure 4, it is shown that the EPCP of audio music is more obvious than the PCP. Figure 5 shows that the ELPCP of audio Figure 4 shows the the PCPLPCP. and EPCP of an audio music piece (the music is “Babyare It’s You”, from the music is clearer than Thus, PCP features for chord recognition improved by Beatles’ album Please Pleasebefore Me). Figure 5 shows LPCP and ELPCP of the same musical piece. singing voice separation calculating thethe PCP or LPCP. PCP of Test Music
EPCP of Test Music
B
3
B
A#
A# 2.5
A
G# 2
G F#
Pitch Name
Pitch Name
2
A
G#
1.5
F E
1
D#
1.5
G F# F
1
E
D#
D
0.5
D 0.5
C#
C# C
C 20
40
60
80
100
120
20
140
40
60
Time(s)
80
100
120
140
Time(s)
Figure of test test music. music. Figure4.4.PCP PCP(left) (left) and and EPCP EPCP (right) (right) of
Appl. Sci. 2016, 6, 157
ELPCP of Test Music
LPCP of Test Music B
B
1.6
1.4
A#
A# 1.4
G#
1.2
G 1
F#
0.8
F E
0.6
A
1.2
G#
Pitch Name
A
Pitch Name
6 of 15
1
G F#
0.8
F 0.6
E D#
D# D
0.4
D
C#
0.2
C#
C
0.4 0.2
C 20
40
60
80
Time(s)
100
120
140
20
40
60
80
Time(s)
100
120
140
Figure of test test music. music. Figure5.5.LPCP LPCP(Left) (Left) and and ELPCP ELPCP (Right) (Right) of
4. Automatic Chord Recognition Our chord recognition system entails two parts: support vector machine classification and the Viterbi algorithm. For SVM classification, we use LIBSVM (Library for Support Vector Machines) to obtain the chord probability estimates [46]. Then the Viterbi algorithm uses the probability estimates and trained state transition probability to estimate the chord of the music. Because of the temporal correlation of chords, we combine the SVM classification with the Viterbi
Appl. Sci. 2016, 6, 157
6 of 14
Figure 4 shows that the EPCP has improved continuity compared with the PCP. Figure 5 shows that the ELPCP is further enhanced compared with the LPCP. In Figure 4, it is shown that the EPCP of audio music is more obvious than the PCP. Figure 5 shows that the ELPCP of audio music is clearer than the LPCP. Thus, PCP features for chord recognition are improved by singing voice separation before calculating the PCP or LPCP. 4. Automatic Chord Recognition Our chord recognition system entails two parts: support vector machine classification and the Viterbi algorithm. For SVM classification, we use LIBSVM (Library for Support Vector Machines) to obtain the chord probability estimates [46]. Then the Viterbi algorithm uses the probability estimates and trained state transition probability to estimate the chord of the music. Because of the temporal correlation of chords, we combine the SVM classification with the Viterbi algorithm and call the system TCSVM (Temporal Correlation Support Vector Machine). 4.1. Support Vector Machine Classification SVM is a popular machine learning method for classification, regression, and other learning tasks. LIBSVM is currently one of the most widely used SVM software packages. A classification task usually involves a training set where each instance contains the class labels and the features. The goal of SVM is to produce a model to predict the target labels of the test data given only the test data features. Many methods are available for multi-class SVM classification [47,48]. LIBSVM uses the “one-against-one” approach for multiclass classification. The classification assumes the use of the 2
radial basis function (RBF) kernel of the form Kpxi , x j q “ e´γ||xi ´x j || . The two parameters of an RBF kernel, C and γ, must be determined by a parameter search as the optimal values vary between tasks. We use the grid-search method to obtain the C and γ parameters. Once the C and γ parameters are set, the class label and probability information can be predicted. This section discusses the LIBSVM implementation for extending the SVM to output probability estimates. Given K chord classes, for any x, the goal is to estimate pi “ Ppy “ i|xq, i “ 1, ..., K. 4.2. Viterbi Algorithm in SVM The SVM method recognizes the chord based on frame-level classification without considering the inter-frame temporal correlation of chord features. For multiple frames corresponding to the same chord, the recognition results of traditional SVM are independent and fluctuate. Accounting for the inter-frame temporal correlation in the recognition procedure can improve the overall chord recognition rate. Our system combines SVM with the Viterbi algorithm to introduce the temporal correlation prior to a chord. Suppose the system has hidden K states, and we denote each state as Si , i P r1 : Ks where the state refers to the chord type. The observed events are Qt , t P r1 : Ts, which are PCP features. The current observed chord feature is Q “ tQ1 , Q2 . . . , Q T u , t P r1 : Ts. Aij represents the transition probability from chord Si to chord S j . At an arbitrary time point t, for each of the states Si , a partial probability δt pSi q indicates the probability of the most probable path ending at the state Si , given the current observed events Q1 , Q2 . . . , Qt : δt pSi q “ maxpδt´1 pS j q ¨ ApS j , Si q ¨ PpQt |Si qq. Here, we assume j
that we already know the probability δt´1 pS j q for any of the previous states S j at time t ´ 1. PpQt |Si q is pi ptq, the current probability estimates of SVM. Once we have all of the objective probabilities for each state at each time point, the algorithm seeks from the end to the beginning to find the most probable path of states for the given sequence of observation events ψt piq “ argr max pδt´1 pS j q ¨ ApS j , Si qqs; 1ď j ď N
ψt piq indicates the optimal state at time t based on the probability computed in the first stage. The Viterbi algorithm is as follows:
Appl. Sci. 2016, 6, 157
7 of 14
Algorithm 2: Viterbi algorithm 1 Initialization: δt pSi q “ Πi PpQ1 |Si q, ψt piq “ 0, 1 ď i ď K; 2 Recursion: δt pSi q “ max pδt´1 pS j q ¨ ApS j , Si qq ¨ PpQt |Si q, 2 ď t ď T ψt piq “ argr max pδt´1 pS j q ¨ ApS j , Si qqs; 1ď j ď N
1ď j ď N
3 Termination: q T ˚ “ arg max rδt pSi qs, P˚ “ maxrδt pSi qs; 1ďiď N
i
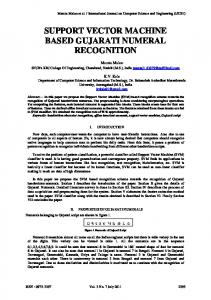
4 Path backtracking: qt ˚ “ ψt`1 pqt`1 ˚ q t “ T ´ 1, T ´ 2...1. In our method, we set the initialization observation probability Πi to 1/24. The observed events are PCP features yt , where yt is the PCP feature of the tth frame. Generally, SVM predicts only the class label without probability information. The LIBSVM implementation extends SVM to output the probability estimates. The current observation probability corresponds to the probability estimates of SVM and replaces the PpQt |Si q in the Viterbi algorithm. Si represents the chord i P r1 : Ks, where K is the number of chords and is set to 24. Figure 6 is the comparison of the ground truth chord and estimated chord for the Beatles song “Baby It’s You”. The top figure shows the result of using the SVM method to recognize the chord and the bottom figure uses TCSVM. The ground truth chord is represented in pink and the estimated chord Appl. Sci.are 2016, 157 Figure 6 indicates that the estimation is more stable when using TCSVM. 8 of 15 labels in 6,blue.
Figure 6. Comparison of ground truth and estimated chords using SVM (top) and TCSVM Figure 6. Comparison of ground truth and estimated chords using SVM (top) and TCSVM (bottom). (bottom).
5. Experimental Results and Analysis In this section, we compare the results of chord estimation using different features and methods. We compare our method with the methods that were submitted to MIREX 2013 and MIREX 2014 on the MIREX’09 dataset.
Appl. Sci. 2016, 6, 157
8 of 14
5. Experimental Results and Analysis In this section, we compare the results of chord estimation using different features and methods. We compare our method with the methods that were submitted to MIREX 2013 and MIREX 2014 on the MIREX’09 dataset. 5.1. Corpus and Evaluation Results For evaluation, we use the MIREX’09 Audio Chord Estimation task dataset which consists of 12 Beatles albums (180 songs, PCM 44 100Hz, 16 bits, mono). Besides the Beatles albums, in 2009, an extra dataset was donated by Matthias Mauch, which consists of 38 songs from Queen and Zweieck [21]. This database has been used extensively for the evaluation of many chord recognition systems, in particular those presented at MIREX 2013 and 2014 for the Audio Chord Estimation task. The evaluation is conducted based on the chord annotations of the Beatles albums provided by Harte and Sandler [49], and the chord annotations of Queen and Zweieck provided by Matthias Mauch [21]. According to [50], chord symbol recall (CSR) is a suitable metric to evaluate chord estimation performance. Since 2013, MIREX has used CSR to estimate how well the predicted chords match the ground truth: t CSR “ E (4) tA where t E is the total duration of segments where annotation equals estimation, and t A is the total duration of the annotated segments. Because pieces of music vary substantially in length, we weight the CSR by the length of the song when computing the average for a given corpus. This final number is referred to as the weighted chord symbol recall. In this paper, the recognition rate and CSR are equivalent for a song and the recognition rate and weighted chord symbol recall are equivalent for a given corpus or dataset. In the training stage, we randomly selected 25% of the songs from the Beatles albums to determine the parameters C and γ for the SVM kernel and the state transition probability matrix A. For SVM, the training dataset is composed of the PCP features of labeled musical fragments, which are selected from the training songs. The average estimation accuracies or recognition rates are reported. First, we compare the recognition rates of SVM with PCP and EPCP features. The comparison between the ground truth and estimated chord is shown in Figure 7 for the example song (the Beatles song “Baby It’s You”). The top and bottom figures show the results using the SVM method with PCP features and EPCP features, respectively. The ground truth chord is represented in pink and the estimated chord labels are in blue. Figure 7 indicates that EPCP improves the recognition rate. In Figure 8, the recognition rate using SVM with PCP features is 70.15%, while that of TCSVM with the same features is 75.07%. The top image of Figure 6 shows less reliable estimated chords at the times when the chords change. The bottom image considers the inter-frame temporal correlation of chord features and shows more stable estimated chords even when the chords change. Second, we compare the recognition rates of SVM and TCSVM with different features. The recognition results of the TCSVM method with ELPCP are superior, as shown in Figure 8. Because EPCP and ELPCP consider the temporal correlation of music, the rates show few differences between the SVM and TCSVM. 5.2. Experimental Results Compared with State-of-the-Art Methods We compare our method with the following methods from MIREX 2013 and MIREX 2014. MIREX 2013: ‚ ‚ ‚
CB4 and CB3: Taemin Cho and Juan P. Bello [35] KO1and KO2: Maksim Khadkevich and Maurizio Omologo [36] NMSD1 and NMSD2: Yizhao Ni, Matt Mcvicar, Raul Santos-Rodriguez [37]
determine the parameters C and γ for the SVM kernel and the state transition probability matrix A . For SVM, the training dataset is composed of the PCP features of labeled musical fragments, which are selected from the training songs. The average estimation accuracies or recognition rates are reported. Appl. Sci.First, 2016, 6,we 157 compare the recognition rates of SVM with PCP and EPCP features. The 9 of 14 comparison between the ground truth and estimated chord is shown in Figure 7 for the example song (the Beatles song “Baby It’s You”). The top and bottom figures show the results using the ‚ CF2 : Chris Cannam, Matthias Mauch, Matthew E. P. Davies [38] SVM method with PCP features and EPCP features, respectively. The ground truth chord is ‚ NG1 and NG2: Nikolay Glazyrin [42] represented in pink and the estimated chord labels are in blue. Figure 7 indicates that EPCP ‚ improves PP3 andthe PP4: Johan Pauwels and Geoffroy [39] rate using SVM with PCP features is recognition rate. In Figure 8, thePeeters recognition ‚ 70.15%, SB8: Nikolaas Steenbergen Ashley Burgoyne [40] The top image of Figure 6 shows while that of TCSVM and withJohn the same features is 75.07%. less reliable estimated chords at the times when the chords change. The bottom image considers MIREX 2014: the inter-frame temporal correlation of chord features and shows more stable estimated chords when the chords change.and Maurizio Omologo [51] ‚ even KO1: Maksim Khadkevich Second, we compare the recognition rates of SVM and TCSVM with different features. The ‚ CM3: Chris Cannam, Matthias Mauch [41] recognition results of the TCSVM method with ELPCP are superior, as shown in Figure 8. ‚ JR2: Jean-Baptiste Rolland [52] Because EPCP and ELPCP consider the temporal correlation of music, the rates show few differences between thethese SVMmethods and TCSVM. More details about can be found from the corresponding MIREX websites [53].
The results of this comparison are presented in Figure 9.
Chord Type
Comparison of Groud Truth Chord and Estimated Chord of SVM with PCP Bm A#m Am G#m Gm F#m Fm Em D#m Dm C#m Cm B A# A G# G F# F E D# D C# C
Groud Truth Chord Estimated Chord
0
20
40
60
80
100
T ime(s)
120
140
160
Comparison of Groud Truth Chord and Estimated Chord of SVM with EPCP Bm A#m Am G#m Gm F#m Fm Em D#m Dm C#m Cm B A# A G# G F# F E D# D C# C
Chord Type
Groud Truth Chord Estimated Chord
0
20
40
60
80
100
T ime(s)
120
140
160
Figure 7. Comparison of ground truth and estimated chord with PCP (top) and EPCP (bottom).
Figure Comparison of ground truth and estimated chord with PCP (top) and EPCP (bottom). Appl. Sci. 2016,7. 6, 157 10 of 15 100
SVM
90
TCSVM 82.07
Recognition Rate(%)
80 70
75.07
77.03
78.74
81.38
79.82
82.98
70.15
60 50 40 30 20 10 0
PCP
LPCP
EPCP
ELPCP
Features
Figure 8. Recognition rates with different features. Figure 8. Recognition rates with different features.
5.2. Experimental Results Compared with State-of-the-Art Methods We compare our method with the following methods from MIREX 2013 and MIREX 2014. MIREX 2013: •
CB4 and CB3: Taemin Cho and Juan P. Bello [35]
• • •
KO1: Maksim Khadkevich and Maurizio Omologo [51] CM3: Chris Cannam, Matthias Mauch [41] JR2: Jean-Baptiste Rolland [52] More details Appl. Sci. 2016, 6, 157about
these methods can be found from the corresponding MIREX websites[53]. 10 of 14 The results of this comparison are presented in Figure 9. 82.98 81.38 82.07 75.07
TCSVM(ELPCP) TCSVM(EPCP) TCSVM(LPCP) TCSVM(PCP) JR2(2014) CM3(2014) KO1(2014) SB8(2013) NG2(2013) PP4(2013) PP3(2013) NG1(2013) CF2(2013) KO2(2013) NMSD1(2013) NMSD2(2013) CB3(2013) KO1(2013) CB4(2013)
51.1 75.4 82.2 7 71 73 75 75 75
0
10
20
30
40
50
60
70
79 81 81 82 82 82 80 90
100
Recognition Rates(%) Figure 9. 9. Comparison state-of-the-artmethods methodsononMirex’09 Mirex’09 dataset. Figure Comparisonofofrecognition recognition rates rates with with state-of-the-art dataset.
The recognition rate of our TCSVM method with ELPCP is 82.98%. The recognition rate of our TCSVM (ELPCP) approach is similar to the best-scoring method (KO1) in MIREX 2014. The results of the 2015 edition of MIREX automatic chord estimation tasks can be found on the corresponding websites [54]. Table 1 shows the comparison of the recognition rates of the 2015 edition on the Isophonics 2009 datasets. The chord classes are as follows: Major and minor(MajMin); Seventh chords(Sevenths); Major and minor with inversions(MajMinInv); Seventh chords with inversions(SeventhsInv). The recognition rate of our TCSVM method is higher than other methods except the rates of the MajMinInv chords. Table 1. Comparison of recognition rates of the 2015 edition on Isophonics 2009 datasets. Algorithm
MajMin
MajMinInv
Sevenths
SeventhsInv
CM3 DK4 DK5 DK6 DK7 DK8 DK9 KO1 TCSVM
54.65 67.66 73.51 75.53 75.89 75.89 76.85 82.19 82.98
47.73 64.61 68.87 63.56 70.38 64.77 74.47 79.61 79.22
19.29 59.56 63.74 64.70 58.37 66.89 68.11 76.04 77.03
16.17 56.92 59.72 54.01 53.53 56.94 66.08 73.43 76.52
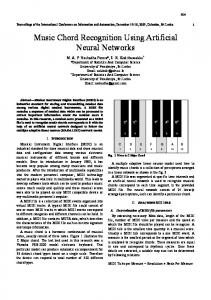
Figure 10 shows the confusion between the chords using SVM and Figure 11 shows the confusion between the chords using TCSVM. The x-axis is the ground truth chord and the y-axis is the estimated chord. Comparing the two images suggests that TCSVM reduces the rate of erroneous identifications for a more reliable result.
TCSVM
82.98
79.22
77.03
76.52
Figure 10 shows the confusion between the chords using SVM and Figure 11 shows the confusion between the chords using TCSVM. The x-axis is the ground truth chord and the y-axis is the Appl. Sci.estimated 2016, 6, 157 chord. Comparing the two images suggests that TCSVM reduces the rate 11 of of 14 erroneous identifications for a more reliable result.
Appl. Sci. 2016, 6, 157
Figure between chords chordswith withSVM. SVM Figure 10. 10. Confusion Confusion between
12 of 15
Figure chords with with TCSVM. TCSVM. Figure11. 11.Confusion Confusion between between chords
6. Conclusions 6. Conclusions We present a new feature called ELPCP and a machine learning model called TCSVM for We present a new feature called ELPCP and a machine learning model called TCSVM for chord chord estimation. We separate the singing voice from the accompaniment to improve the features estimation. We separate the singing voice from the accompaniment to improve the features and and consider the temporal correlation of music. Temporal correlation SVM is used to estimate the consider the temporal correlation of music. Temporal correlation SVM is used to estimate the chord. chord. This system results in more accurate chord recognition and eliminates many spurious This system results in more accurate chord recognition and eliminates many spurious chord estimates chord estimates appearing in the conventional recognition procedure. appearing in the conventional recognition procedure. Future work should address some limitations. First, this paper only involves common chord Future work should address some limitations. First, this paper only involves common chord estimation as part of the audio chord estimation task. Future work will involve the recognition of estimation as part of the audio chord estimation task. Future work will involve the recognition of more more complex chords to increase the applicability of this work in the field of music information complex chords to increase the applicability of this work in the field of music information retrieval, retrieval, including song identification, query by similarity, and structure analysis. Second, we including song identification, query by similarity, and structure analysis. Second, we consider the consider the effect of the singing voice and the results of Figure 8 show that the recognition rate effect of the singing voice and the results of Figure 8 show that the recognition rate with singing voice with singing voice separation is better than without it. There is more room for further improvement of the PCP features to make them more suitable for chord recognition. Finally, we will evaluate the TCSVM method for cases when the audio music contains noise or is corrupted by noise. Acknowledgments: This work was supported by the national Natural Science Foundation of China (Grant
Appl. Sci. 2016, 6, 157
12 of 14
separation is better than without it. There is more room for further improvement of the PCP features to make them more suitable for chord recognition. Finally, we will evaluate the TCSVM method for cases when the audio music contains noise or is corrupted by noise. Acknowledgments: This work was supported by the national Natural Science Foundation of China (Grant No. 61101225). Author Contributions: Zhongyang Rao and Xin Guan conceived and designed the experiments; Zhongyang Rao performed the experiments; Zhongyang Rao and Xin Guan analyzed the data; Jianfu Teng contributed materials and analysis tools; Zhongyang Rao and Xin Guan wrote the paper. Conflicts of Interest: The authors declare that there is no conflict of interests regarding the publication of this paper.
References 1.
2.
3. 4.
5.
6. 7.
8. 9. 10.
11.
12.
13. 14.
15.
Fujishima, T. Realtime Chord Recognition of Musical Sound: A System Using Common Lisp Music. In Proceedings of the International Computer Music Conference, Beijing, China, 22-27 October 1999; pp. 464–467. Ueda, Y.; Uchiyama, Y.; Nishimoto, T.; Ono, N.; Sagayama, S. HMM-based approach for automatic chord detection using refined acoustic features. In Proceedings of the IEEE International Conference on Acoustics Speech and Signal Processing (ICASSP 2010), Dallas, TX, USA, 14–19 March 2010; pp. 5518–5521. Harte, C.; Sandler, M. Automatic Chord Identifcation Using a Quantised Chromagram. In Proceedings of the Audio Engineering Society Convention 118, Barcelona, Spain, 28–31 May 2005. Degani, A.; Dalai, M.; Leonardi, R.; Migliorati, P. Real-time Performance Comparison of Tuning Frequency Estimation Algorithms. In Proceedings of the 2013 8th International Symposium on Image and Signal Processing and Analysis (ISPA), Trieste, Italy, 4–6 September 2013; pp. 393–398. Morman, J.; Rabiner, L. A system for the automatic segmentation and classification of chord sequences. In Proceedings of the 1st ACM Workshop on Audio and Music Computing Multimedia, Santa Barbara, CA, USA, 23–27 October 2006; pp. 1–10. Lee, K. Automatic Chord Recognition from Audio Using Enhanced Pitch Class Profile. In Proceedings of the International Computer Music Conference, New Orleans, LA, USA, 6–11 November 2006. Varewyck, M.; Pauwels, J.; Martens, J.-P. A novel chroma representation of polyphonic music based on multiple pitch tracking techniques. In Proceedings of the 16th ACM International Conference on Multimedia, Vancouver, BC, Canada, 26–31 October 2008; pp. 667–670. Müller, M.; Ewert, S. Towards timbre-invariant audio features for harmony-based music. IEEE Trans. Audio Speech Lang. Process. 2010, 18, 649–662. Nwe, T.L.; Shenoy, A.; Wang, Y. Singing voice detection in popular music. In Proceedings of the 12th Annual ACM International Conference on Multimedia, New York, NY, USA, 10–16 October 2004; pp. 324–327. Oudre, L.; Grenier, Y.; Févotte, C. Template-based Chord Recognition: Influence of the Chord Types. In Proceedings of the International Society for Music Information Retrieval Conference, Kobe, Japan, 26–30 October 2009; pp. 153–158. Rocher, T.; Robine, M.; Hanna, P.; Oudre, L.; Grenier, Y.; Févotte, C. Concurrent Estimation of Chords and Keys from Audio. In Proceedings of the International Society for Music Information Retrieval Conference, Utrecht, The Netherlands, 9–13 August 2010; pp. 141–146. Cho, T.; Bello, J.P. A Feature Smoothing Method for Chord Recognition Using Rrecurrence Plots. In Proceedings of the Music Information Retrieval Evaluation eXchange (MIREX 2011), Miami, FL, USA, 24–28 October 2011. Oudre, L.; Févotte, C.; Grenier, Y. Probabilistic template-based chord recognition. IEEE Trans. Audio Speech Lang. Process. 2011, 19, 2249–2259. [CrossRef] Papadopoulos, H.; Peeters, G. Large-scale Study of Chord Estimation Algorithms Based on Chroma Representation and HMM. In Proceedings of the International Workshop on Content-Based Multimedia Indexing (CBMI’07), 25–27 June 2007; pp. 53–60. Bello, J.P.; Pickens, J. A Robust Mid-Level Representation for Harmonic Content in Music Signals. In Proceedings of the International Society for Music Information Retrieval Conference, London, UK, 11–15 September 2005; pp. 304–311.
Appl. Sci. 2016, 6, 157
16. 17.
18.
19.
20.
21. 22. 23. 24. 25. 26. 27.
28. 29.
30.
31.
32. 33. 34.
35.
36.
13 of 14
Lee, K.; Slaney, M. Acoustic chord transcription and key extraction from audio using key-dependent HMMs trained on synthesized audio. IEEE Trans. Audio Speech Lang. Process. 2008, 16, 291–301. [CrossRef] Papadopoulos, H.; Peeters, G. Simultaneous Estimation of Chord Progression and Downbeats from an Audio File. In Proceedings of the IEEE International Conference on Acoustics, Speech and Signal Processing (ICASSP 2008), Bordeaux, France, 25–27 June 2008; pp. 121–124. Sheh, A.; Ellis, D.P. Chord Segmentation and Recognition Using EM-Trained Hidden Markov Models. In Proceedings of the International Society for Music Information Retrieval Conference (ISMIR 2003), Maryland, MD, USA, 27-30 October 2003; pp. 185–191. Scholz, R.; Vincent, E.; Bimbot, F. Robust Modeling of Musical Chord Sequences Using Probabilistic N-grams. In Proceedings of the IEEE International Conference on Acoustics, Speech and Signal Processing (ICASSP 2009), Taipei, Taiwan, 19–24 April 2009; pp. 53–56. Yoshii, K.; Goto, M. A Vocabulary-Free Infinity-Gram Model for Nonparametric Bayesian Chord Progression Analysis. In Proceedings of the International Society for Music Information Retrieval Conference, Miami, FL, USA, 24–28 October 2011; pp. 645–650. Mauch, M. Automatic Chord Transcription from Audio Using Computational Models of Musical Context. Ph.D. Thesis, University of London, London, UK, 23 March 2010. Ni, Y.; McVicar, M.; Santos-Rodriguez, R.; de Bie, T. An end-to-end machine learning system for harmonic analysis of music. IEEE Trans. Audio Speech Lang. Process. 2012, 20, 1771–1783. [CrossRef] Vapnik, V.N. An overview of statistical learning theory. IEEE Trans. Neural Netw. 1999, 10, 988–999. [CrossRef] [PubMed] Miao, Q.; Huang, H.Z.; Fan, X. A comparison study of support vector machines and hidden Markov models in machinery condition monitoring. J. Mech. Sci. Technol. 2007, 21, 607–615. [CrossRef] Bartsch, M.A.; Wakefield, G.H. Audio thumbnailing of popular music using chroma-based representations. IEEE Trans. Multimed. 2005, 7, 96–104. [CrossRef] Gómez, E. Tonal description of polyphonic audio for music content processing. Inf. J. Comput. 2006, 18, 294–304. [CrossRef] Khadkevich, M.; Omologo, M. Use of Hidden Markov Models and Factored Language Models for Automatic Chord Recognition. In Proceedings of the International Society for Music Information Retrieval Conference, Kobe, Japan, 26–30 October 2009; pp. 561–566. Brown, J.C. Calculation of a Constant Q spectral Transform. J. Acoust. Soc. Am. 1991, 89, 425–434. [CrossRef] Müller, M.; Ewert, S. Chroma Toolbox: MATLAB Implementations for Extracting Variants of Chroma-based Audio Features. In Proceedings of the 12th International Conference on Music Information Retrieval (ISMIR 2011), Miami, FL, USA, 24–28 October 2011. Mauch, M.; Dixon, S. Approximate Note Transcription for the Improved Identification of Difficult Chords. In Proceedings of the International Society for Music Information Retrieval Conference (ISMIR 2010), Utrecht, The Netherlands, 9–13 August 2010; pp. 135–140. Müller, M.; Ewert, S.; Kreuzer, S. Making chroma features more robust to timbre changes. In Proceedings of the International Conference on Acoustics, Speech and Signal Processing (ICASSP 2009), Taipei, Taiwan, 19–24 April 2009; pp. 1877–1880. Wang, F.; Zhang, X. Research on CRFs in Music Chord Recognition Algorithm. J. Comput. 2013, 8, 1017. [CrossRef] Gómez, E.; Herrera, P.; Ong, B. Automatic Tonal Analysis from Music Summaries for Version Identification. In Proceedings of the Audio Engineering Society Convention 121, San Francisco, CA, USA, 5–8 October 2006. Weil, J.; Durrieu, J.-L. An HMM-based Audio Chord Detection System: Attenuating the Main Melody. In Proceedings of the Music Information Retrieval Evaluation eXchange (MIREX), Philadelphia, PA, USA, 14–18 September 2008. Cho, T.; Bello, J.P. MIREX 2013: Large Vocabulary Chord Recognition System Using Multi-band Features and a Multi-stream HMM. In Proceedings of the Music Information Retrieval Evaluation eXchange (MIREX), Curitiba, Brazil, 4–8 November 2013. Khadkevich, M.; Omologo, M. Time-frequency Reassigned Features for Automatic Chord Recognition. In Proceedings of the IEEE International Conference on Acoustics, Speech and Signal Processing (ICASSP 2011), Prague, Czech Republic, 22–27 may 2011; pp. 181–184.
Appl. Sci. 2016, 6, 157
37.
38.
39. 40.
41.
42.
43. 44. 45. 46. 47. 48. 49.
50.
51.
52.
53. 54.
14 of 14
Ni, Y.; McVicar, M.; Santos-Rodriguez, R.; de Bie, T. Harmony Progression Analyzer for MIREX 2013. In Proceedings of the Music Information Retrieval Evaluation eXchange (MIREX), Curitiba, Brazil, 4–8 November 2013. Cannam, C.; Benetos, E.; Mauch, M.; Davies, M.E.P.; Dixon, S.; Landone, C.; Noland, K.; Stowell, D. MIREX 2015: Vamp Plugins from the Centre for Digital Music. In Proceedings of the Music Information Retrieval Evaluation eXchange (MIREX), Malaga, Spain, 26–30 October 2015. Pauwels, J.; Peeters, G. The Ircamkeychord Submission for MIREX 2013. In Proceedings of the Music Information Retrieval Evaluation eXchange (MIREX), Curitiba, Brazil, 4–8 November 2013. Steenbergen, N.; Burgoyne, J.A. MIREX 2013: Joint Optimization of an Hidden Markov Model-neural Network Hybrid Chord Estimation. In Proceedings of the Music Information Retrieval Evaluation eXchange (MIREX), Curitiba, Brazil, 4–8 November 2013. Cannam, C.; Benetos, E.; Mauch, M.; Davies, M.E.; Dixon, S.; Landone, C.; Noland, K.; Stowell, D. MIREX 2014: Vamp Plugins from the Centre for Digital Music. In Proceedings of the Music Information Retrieval Evaluation eXchange (MIREX), Taipei, Taiwan, 27–31 October 2014. Glazyrin, N. Audio Chord Estimation Using Chroma Reduced Spectrogram and Self-similarity. In Proceedings of the Music Information Retrieval Evaluation eXchange (MIREX), Curitiba, Brazil, 4–8 November 2013. Oudre, L. Template-Based Chord Recognition from Audio Signals. Ph.D. Thesis, TELECOM ParisTech, Paris, France, 3 November 2010. Ellis, D.P. Beat tracking by dynamic programming. J. New Music Res. 2007, 36, 51–60. [CrossRef] The Augmented Lagrange Multiplier Method for Exact Recovery of Corrupted Low-Rank Matrices. Available online: http://arxiv.org/abs/1009.5055 (accessed on 18 October 2013). Chang, C.C.; Lin, C.J. LIBSVM: A library for support vector machines. ACM Trans. Intell. Syst. Technol. 2011, 2, 389–396. [CrossRef] Guo, H.; Wang, W. An active learning-based SVM multi-class classification model. Pattern Recognit. 2015, 48, 1577–1597. [CrossRef] Tomar, D.; Agarwal, S. A comparison on multi-class classification methods based on least squares twin support vector machine. Knowl.-Based Syst. 2015, 81, 131–147. [CrossRef] Harte, C.; Sandler, M.B.; Abdallah, S.A.; Gómez, E. Symbolic Representation of Musical Chords: A Proposed Syntax for Text Annotations. In Proceedings of the International Society for Music Information Retrieval Conference, London, UK, 11–15 September 2005; pp. 66–71. Pauwels, J.; Peeters, G. Evaluating Automatically Estimated Chord Sequences. In Proceedings of the IEEE International Conference on Acoustics, Speech and Signal Processing (ICASSP 2013), Vancouver, BC, USA, 26–31 May 2013; pp. 749–753. Khadkevich, M.; Omologo, M. Time-frequency Reassigned Features for Automatic Chord Recognition. In Proceedings of the Music Information Retrieval Evaluation eXchange (MIREX), Taipei, Taiwan, 27–31 October 2014. Rolland, J.-B. Chord Detection Using Chromagram Optimized by Extracting Additional Features. In Proceedings of the Music Information Retrieval Evaluation eXchange (MIREX), Taipei, Taiwan, 27–31 October 2014. MIREX HOME. Available online: http://www.music-ir.org/mirex/wiki/MIREX_HOME (accessed on 10 November 2015). 2015:Audio Chord Estimation Results. Available online: http://www.music-ir.org/mirex/wiki/2015: Audio_Chord_Estimation_Results#Isophonics_2009 (accessed on 2 December 2015). © 2016 by the authors; licensee MDPI, Basel, Switzerland. This article is an open access article distributed under the terms and conditions of the Creative Commons Attribution (CC-BY) license (http://creativecommons.org/licenses/by/4.0/).