limited by doubt of whether they are a property of the sample or the population. Also, like ..... manual public sector jobs are considered to be somewhat libertarian and left-wing. ...... http://www.allacademic.com/meta/p41464_index.html [11.12.2013]. ..... Portugal: Social Democratic party (Partido Social Democrata, PPD/PSD).
Class Voting and Value Orientations The fourth generation
Peter Egge Langsæther
Department of Political Science Faculty of Social Sciences University of Oslo May 2014 Word count: 36 883
Class Voting and Value Orientations
The fourth generation
© Peter Egge Langsæther 2014 Class Voting and Value Orientations: The fourth generation Peter Egge Langsæther http://www.duo.uio.no/ Trykk: Reprosentralen, Universitetet i Oslo
Abstract The most important questions in the study of class voting during the last few decades have been whether, to what degree, and why class voting has been declining. Usually, a dichotomous left-right party choice variable has been utilized. This may have distorted dealignment and realignment, as the rise of the New Left and the New Right has changed the relationship between the social classes and the political parties. In this thesis, we utilize a party family dependent variable on contemporary data instead. We first describe the class basis in 18 West-European countries for all the party families, showing that the party families normally grouped into the “Left” and “Right” categories indeed have quite different class bases. The strength of class voting also varies by party family. We then test one of the mechanisms connecting class to voting, namely the role of value orientations. This means that we see how much of the bivariate association between class and voting that disappears when controlling for these intermediate variables. What we find is compelling evidence of the need for a more nuanced party choice variable: The amount of class voting accounted for by the value orientations varies between the party families. The thesis thus i) describes the class basis of the West-European party families; ii) tests a mechanism through which class has its effects on voting; iii) proves the need for a more nuanced, “4th generation” dependent variable.
Acknowledgements I am grateful to a great number of people who have made me capable of writing this thesis, whether directly or indirectly; academically or personally. Unfortunately I cannot name but a few. At the university, my supervisor Oddbjørn Knutsen stands above all else in this regard. With his excellent knowledge of cleavage voting and his constructive and thorough feedback throughout the last year, he has contributed immensely to this thesis. Thank you. KnutAndreas Christophersen has been very helpful ever since I started on the master’s programme. He has been an excellent teacher, always caring for his students. He has also read and given me feedback on parts of this thesis, for which I am very thankful. Øivind Bratberg is a born motivator and one of the most generous people I know. His presence at the university is a resource to every student. There are also a great many students I am thankful for having met during the last years; unfortunately too many to mention here. I have learnt as much from discussions with them as I have from my studies. I want in particular to thank the Matprat gang, with whom I have eaten every lunch and dinner at the university during the last two years: Einar Tornes, Magnus Jacobsen, Rémi César Fiquet Bredesen, Magnus Gabriel Aase, Lars Sutterud, Martin Søyland, and Aleksander Eilertsen. Life at the university has been better than I could ever have dreamt of because of you. The last member of the crew, Haakon Gjerløw, must be singled out. As a friend and discussion partner through many years, he means a lot to me both academically and personally. Not least, there are many to thank outside the university. I want to thank my father, for teaching me when and how to think with my head. I want to thank my mother, for teaching me when and how to think with my heart. You both mean the world to me. So does my brother, Øystein Egge Langsæther, and my closest friends throughout the last two decades, Mads André Jordansen and Petter Melnæs. You always remind me of who I am, where I come from, and why I’m here. Thank you. All faults in this thesis are my own.
Table of Contents Chapter 1: Introduction........................................................................................................... 1 1.1 The Study of Class Voting: A Brief History ................................................................................. 2 1.2 The State of the Art: The 4th Generation ....................................................................................... 4 1.3 The Aim of the Thesis – Filling the Gaps ..................................................................................... 6
Chapter 2: Research Design .................................................................................................. 10 2.1 Data: The European Values Study 2008 ..................................................................................... 10 2.2 Variables...................................................................................................................................... 10 2.2.1 The independent variable: Social class ................................................................................. 10 2.2.2 The dependent variable: Party choice ................................................................................... 14 2.2.3 The intermediate variables: The value orientations .............................................................. 16 2.3 Research Strategy ........................................................................................................................ 17 2.3.1 Description ........................................................................................................................... 17 2.3.2 Testing mechanisms: Multilevel logistic regression ............................................................ 21
Chapter 3: The Class Basis of the West-European Party Families ................................... 26 3.1 The Left Socialist Parties............................................................................................................. 27 3.1.1 Hypotheses............................................................................................................................ 27 3.1.2 The Class Basis of the Socialist Left in Western Europe ...................................................... 29 3.2 The Green Parties ........................................................................................................................ 31 3.2.1 Hypotheses............................................................................................................................ 31 3.2.2 The Class Basis of Green Parties in Western Europe .......................................................... 32 3.3 The Social Democratic Parties .................................................................................................... 33 3.3.1 Hypotheses............................................................................................................................ 33 3.3.2 The Class Basis of the Social Democratic Parties in Western Europe ................................ 35 3.4 The Agrarian Parties .................................................................................................................... 37 3.4.1 Hypotheses............................................................................................................................ 37 3.4.2 The Class Basis of the Agrarian Parties .............................................................................. 38 3.5 The Liberal Parties ...................................................................................................................... 39 3.5.1 Hypotheses............................................................................................................................ 39 3.5.2 The Class Basis of the Liberal Parties in Western Europe .................................................. 40 3.6 The Christian Democratic Parties ................................................................................................ 41 3.6.1 Hypotheses............................................................................................................................ 41 3.6.2 The Class Basis of Christian Democratic parties ................................................................ 42
3.7 The Conservative parties ............................................................................................................. 43 3.7.1 Hypotheses............................................................................................................................ 43 3.7.2 The Class Basis of Conservative Parties .............................................................................. 44 3.8 The Radical Right Parties ............................................................................................................ 45 3.8.1 Hypotheses............................................................................................................................ 45 3.8.2 The Class Basis of the Radical Right in Western Europe..................................................... 47 3.9 Conclusion: How strong is the class basis? ................................................................................. 48
Chapter 4: Class Voting and Value Orientations ................................................................ 52 4.1 Value orientations and Left Socialist class voting....................................................................... 53 4.2 Value orientations and Green class voting .................................................................................. 59 4.3 Value orientations and Social Democratic class voting .............................................................. 63 4.4 Value orientations and Agrarian class voting .............................................................................. 67 4.5 Value orientations and Liberal class voting ................................................................................ 70 4.6: Value orientations and Christian Democratic class voting......................................................... 74 4.7: Value orientations and Conservative class voting ...................................................................... 78 4.8 Value orientations and Radical Right class voting ...................................................................... 81
Chapter 5: Conclusion ........................................................................................................... 86 5.1 Summary: Total party family specific class voting in Western Europe ...................................... 86 5.2 Conclusion: The Future of the Fourth Generation....................................................................... 87
Bibliography ........................................................................................................................... 89 Appendix ................................................................................................................................. 96 A.1 Variable operationalization ........................................................................................................ 96 A.1.1 The coding of parties into the party family variable (original name in italics) ................... 96 A.1.2 The construction of the value orientation indexes ............................................................... 99 A.2 Descriptive Statistics ................................................................................................................ 106 A.2.1: Social class ....................................................................................................................... 106 A.2.2: The party families ............................................................................................................. 107 A.2.3: The value orientations ...................................................................................................... 108 A.3 Abbreviations ........................................................................................................................... 110
Table of Figures Figure 2.1: The EGP 11-class schema. .................................................................................... 12 Figure 2.2: Ideology and occupational groups in advanced capitalist democracies ................ 19 Figure 4.1: Predicted probability of voting Socialist Left, by class ......................................... 55 Figure 4.2: Predicted probability of voting LS by class and economic ideology .................... 58 Figure 4.3: Predicted probability of voting LS by class and authoritarian-libertarian values . 58 Figure 4.4: Predicted probabilities of voting Green by class and religiosity ........................... 63 Figure 4.5: Predicted prob. of voting Green by class and environmental values ..................... 63 Figure 4.6: Predicted probability of voting Social Democratic by class .................................. 66 Figure 4.7: Predicted probability of voting Social Democratic by class and economic ideology .................................................................................................................................................. 67 Figure 4.8: Predicted probabilities of voting Agrarian, by class .............................................. 70 Figure 4.9: Predicted probabilities of voting Agrarian, by class and religiosity ...................... 70 Figure 4.10: Predicted probability of voting Liberal, by class ................................................. 73 Figure 4.11: Predicted probability of voting Liberal by class and economic ideology ........... 74 Figure 4.12: Predicted probabilities of voting Christian Democratic, by class ........................ 77 Figure 4.13: Predicted probabilities of voting Christian Democratic, by class ........................ 78 Figure 4.14: Predicted probabilities of voting Conservative, by class ..................................... 81 Figure 4.15: Predicted probabilities of voting Conservative, by class and economic ideology .................................................................................................................................................. 81 Figure 4.16: Predicted probability of voting Radical Right, by class ...................................... 84 Figure 4.17: Predicted probability of voting Radical Right, by class and immigration orientations ............................................................................................................................... 85
Table of tables Table 2.1: The Applied Class Schema ..................................................................................... 13 Table 3.1: Support for the Left Socialist parties in percent, according to class ....................... 29 Table 3.2: Support for Green parties in percent, according to class ........................................ 32 Table 3.3: Support for the Social Democratic parties in percent, according to class ............... 35 Table 3.4: Support for the Agrarian parties in percent, according to class .............................. 38
Table 3.5: Support for the Agrarian parties among petite bourgeoisie and farmers, in percent .................................................................................................................................................. 38 Table 3.6: Support for the Liberal parties in percent, according to class ................................. 40 Table 3.7: Support for the Christian Democratic parties in percent, according to class .......... 42 Table 3.8: Support for Conservative parties in percent, according to class ............................. 44 Table 3.9: Support for the Radical Right parties in percent, according to class ...................... 47 Table 3.10: Kappa values for each party family, ranked by mean of kappas (high to low)..... 50 Table 4.1: Left Socialist voting and value orientations: Multilevel logistic regression ........... 54 Table 4.2: The kappa values from the Left Socialist voting models ........................................ 55 Table 4.3: Green voting and value orientations: Multilevel logistic regression ...................... 60 Table 4.4: Kappa values from the Green voting models .......................................................... 61 Table 4.5: Social Democratic voting and value orientations: Multilevel logistic regression... 65 Table 4.6: The kappa values from the Social Democratic voting models ................................ 66 Table 4.7: Agrarian voting and value orientations: Multilevel logistic regression .................. 68 Table 4.8: Kappa values from the Agrarian models ................................................................. 70 Table 4.9: Liberal voting and value orientations: Multilevel logistic regression ..................... 72 Table 4.10: Kappa values from the Liberal voting models ...................................................... 73 Table 4.11: Christian Democratic voting and value orientations: Multilevel logistic regression .................................................................................................................................................. 76 Table 4.12: The kappa values from the Christian Democratic voting models ......................... 77 Table 4.13: Conservative voting and value orientations: Multilevel logistic regression ......... 79 Table 4.14: The kappa values from the Conservative voting models ...................................... 80 Table 4.15: Radical Right voting and value orientations: Multilevel logistic regression ........ 83 Table 4.16: The kappa values from the Radical Right voting models ..................................... 83 Table 5.1: Summary of the reductions in total party family specific class voting ................... 86 Table A.1: Social class in percent, by country ....................................................................... 106 Table A.2: Support for the party families in percent, by country .......................................... 107 Table A.3: Economic ideology, from right (0) to left (10)..................................................... 108 Table A.4 Religiosity, from low to high ................................................................................ 108 Table A.5: Environmentalism, from low to high ................................................................... 109 Table A.6: Authoritarianism (low) – libertarianism (high) .................................................... 109 Table A.7: Immigration values, from negative to positive .................................................... 110
Chapter 1: Introduction Class has always been an essential component of political analysis. Karl Marx and Max Weber made the concept central to the social sciences, and since Lipset and Rokkan’s (1967) seminal work on cleavages it has also been central in political science and the study of the evolution of party systems. Lipset and Rokkan (1967) emphasized two cleavages connected to social class. The first is the conflict between labour and capital, workers and owners. This conflict led to a certain convergence between Western European party systems, as all countries developed parties representing the workers. However, after the Russian Revolution, not all of these were Social Democratic anymore. Neither did the conflict lead to convergence in the representation of the owners’ interests, which were represented by a number of different types of parties. The second cleavage connected to class is the conflict between producers and consumers of agrarian products. This cleavage has often been integrated into existing parties, although in the Nordic countries it contributed to the development of a new party family – namely, the Agrarian parties (see also Knutsen 2006: xi-xii). However, Lipset and Rokkan (1967) never provided a clear-cut definition of a cleavage. We will thus rely on Knutsen and Scarbrough (1995), who provide a three-part definition of cleavage. First, a cleavage is based on long-lasting social divisions that create “objectively” identifiable groups within a society – like classes, religious denominations, and so on. Second, the members of these groups share a common way of life, giving rise to shared value orientations within the groups. Finally, a cleavage needs to be organizationally institutionalized, for instance in a political party or a church (Knutsen and Scarbrough 1995: 494). Since the 1950s and 1960s, the class cleavage has been a central explanation for voting patterns in Western Europe. For some, such as Lipset et al. (1954) or Downs (1957), this is simply because people belonging to a certain class have common economic interests, and they vote in line with their material class interests. Those with few resources are in favour of redistribution because they want more, and those with many resources are against it because they do not want to share. But if that were all there was to it, we might as well use income instead of class as the independent variable. Since many within a class do not vote according to their economic class interests, something else must also be at stake. This could be the 1
common experiences and social networks members of a class often share. It could also be because class membership affects other aspects of our lives, such as our values or political attitudes, and thus indirectly explains our voting (Manza et al. 1995: 140). As mentioned, this is incorporated into the very definition of cleavage given by Knutsen and Scarbrough (1995). It is the last idea that will be tested in chapter 4 in this thesis, when we will see how much of the effect of class on voting that is indirect through value orientations.
1.1 The Study of Class Voting: A Brief History On the basis of the research problems, the hypotheses, the measurement procedures, and the employed methods, Nieuwbeerta (1995) categorized the literature on class voting into three “generations”. The first generation of class voting research was conducted during the 1950s and 1960s. The scholars involved studied whether or not there was a relationship between class and voting through the use of cross-tabulations. These were usually based on a dichotomous measure of class (manual/non-manual) and a dichotomous measure of political parties (left-wing/rightwing). The so-called Alford index (Alford 1962) was the dominant measure of class voting (Jansen 2011: 22; Knutsen 2007). This is simply the percentage difference between manual and non-manual occupations in left-wing voting (Alford 1964: 79-80). The second generation, which was born in the late 1960s, improved research in several ways. The class schemas were more nuanced than the manual/non-manual divide and linear regression replaced cross-tabulations as the most common method of analysis. Prominent contributions to this generation were Franklin et al. (1992) and Inglehart (1977; 1990). The goal was to increase the explained voting variance by including more variables, notably value orientations (Jansen 2011: 23; Knutsen 2007: 458). The first two generations came to a few broad conclusions: In all Western democracies, members of the manual class were more likely to vote left-wing than members of the non-manual class. Also, the strength of class voting varied significantly between countries, and had declined in most countries in the postwar period (Nieuwbeerta 1996: 346). Class voting was most important in Scandinavia and Great Britain, where it also decreased the most, and least important in the US and Canada (Evans 1999: 5). The first two generations also made some attempts at finding explanations for the differences in levels of class voting. Some of the explanations considered were income inequality, social 2
mobility, and the politicization of class issues (Alford 1964), religious and ethnic fragmentation (Lipset and Rokkan 1967; Lijphart 1979), the standard of living (Kerr et al. 1960), the unionization rate of workers (Korpi 1983), and the rise of New Politics (Inglehart 1977; 1990). However, the empirical tests were bivariate and usually based on crude measures of both class and party choice – e.g. the Alford index (Nieuwbeerta and Ultee 1999: 124). In the mid-1980s, the third generation of class voting research came forth, criticizing both the measure of class and of class voting. The dichotomous class schema was seen as too crude (see also Erikson et al. 1979: 415). According to scholars like Heath et al. (1985) and Hout et al. (1993), important changes in the class structure had emerged during the last decades, rendering the manual/non-manual divide less relevant. This was both due to the fact that the working class was diminishing, and that the middle class was getting larger and more heterogeneous (see also Nieuwbeerta 1996: 360-361). Evans (1999: 8-11) also criticized the Alford index for obscuring variations within the non-manual and manual classes. The class measure was further developed and scholars regularly used internationally comparable and standardized class schemas, like the Erikson-Goldthorpe-Portocarero (EGP) class schema (Erikson et al. 1979; Erikson and Goldthorpe 1992). Heath et al. (1985) and Thomsen (1987) also criticized the Alford index for being sensitive to the general popularity of the parties, and argued that it was necessary to use relative measures (like log odds ratios) instead of absolute ones. Nieuwbeerta (1995) categorized his own important study as belonging to the third generation. In one of the most expansive studies of class voting conducted at the time, he wanted to describe both the variations in relative class voting between countries and within countries over time in light of the critiques raised by the third generation. He found that the third generation scholars had a point: Some of the variation between countries and over time was due to the use of the Alford index. However, important variations still remained, and there was a clear decline in class voting throughout the period. In addition, the relative and absolute measures of class voting did not yield substantially different conclusions (Nieuwbeerta 1996: 370-371). Nieuwbeerta (1996: 371-372) ends by urging future research to explain the differences in class voting and to distinguish between all parties in the party system. Hout et al. (1995) introduced the kappa index, which allowed for just that: A more differentiated party choice measure (Jansen 2011: 24-25). They also distinguished between traditional class voting, i.e. the Alford index, and total class voting, which includes all effects 3
class may have on voting, not only on voting left-wing versus right-wing (Hout et al. 1995: 806). We will return to the kappa index in section 2.3. What explanations were suggested by the third generation for the variations in class voting? Nieuwbeerta (1996) argues that social characteristics (such as value orientations or standards of living) and political characteristics (such as party polarization) were suggested in some very tentative analyses. Nieuwbeerta and Ultee (1999) used multilevel techniques and crosslevel interaction terms to find that ethnic and religious diversity reduced class voting. They also found that increased union density was positively associated with class voting between countries, but negatively associated with class voting over time within-countries. While the third generation improved and discussed the dichotomous class variable and the relative versus absolute measures of class voting, they did not (with a few exceptions) pay sufficient attention to the problems related to the dichotomous party choice variable.
1.2 The State of the Art: The 4th Generation Knutsen (2007) launches a possible fourth generation. He suggests that the class cleavage cuts across the left-right division of parties: the New Left parties are more popular amongst the higher educated and the new middle class, whereas the Radical Right is more popular amongst the less educated and workers (see also Knutsen 2004: 195). Hence, it is necessary with a more detailed party choice variable. This issue has formerly been raised by Evans (1999: 12-15), who claims that the dichotomous party choice variable is affected by changes in the relative size of the different parties labelled as “left” and “non-left”, and misrepresents class-party realignment as dealignment (for instance if manual workers stop voting for the left and start voting for the radical right). Expanding on Hout et al.’s (1995) distinction between total and traditional class voting, Knutsen (2006) categorizes the parties in eight European countries into ten party families and analyses total class voting over time. The correlations between party choice and social class still show a clear average decline from the 1970s to the 1990s. Total class voting was largest in Denmark in the 1970s and 1980s and lowest in Germany, but converged at a low level in the 1990s as the countries with the highest total class voting also saw the sharpest decreases (Knutsen 2006: 181-183). These findings are in accordance with findings from the third generation, especially those of Nieuwbeerta (1995).
4
Knutsen (2007) launches the new approach with a nuanced party choice variable as a possible new generation of class voting research. Whereas Knutsen (2007) mainly discusses the dependent variable, Jansen (2011: 24-29) claims that there has also been a change in the research problems and hypotheses, as well as the measurement procedures and analyses strategies. In Jansen’s view, only a few studies have tried to systematically test the explanations suggested in the literature, namely Nieuwbeerta (1995, chapter 4), Nieuwbeerta and Ultee (1999), and Knutsen (2006). Jansen (2011: 25) argues that the explanations usually fit two categories: Sociological and political explanations. The sociological hypotheses, regarding the demand-side, include changes in the composition of classes or the values of the classes (so-called “bottom up” explanations). The political hypotheses, covering the supplyside, include party polarization and the class basis of electoral appeals (“top-down” explanations). The class measures encompass post-industrial, revised class schemas. The techniques used are notably multinomial and conditional logistic regression. According to Jansen (2011), the fourth generation is in its early years, and his own analysis is one of its contributions. Nevertheless, in the comparative part of his thesis he is still using the dichotomous party choice variable (Jansen 2011: ch. 3). In the second part of his analysis, covering only the Netherlands, albeit over time, he uses a party choice variable categorizing the parties into the old-left, the new-left, the liberal right, and religious parties. Thus only the second part may be said to belong to the fourth generation, if we stick to the definition suggested by Knutsen (2007). Jansen (2011: 200) himself criticises his pooled analyses for their “low level of detail in measuring cleavages and cleavage strength”. But even the analysis of the Netherlands could be more detailed in its measure of party choice: The four categories are not exhaustive. In the fourth generation part of his study, Jansen (2011: ch. 4) finds that social explanations as well as political ones are important to explain the decline of class voting in the Netherlands. For instance, the differences between classes with respect to economic ideology weakened over time – although holding this ideology constant only partly explained the decline in class voting in the Netherlands in the period 1971-2006. After controlling for bottom up explanations, it turns out that the parties’ economic left-right position does impact class voting, whereas their position on the cultural dimension does not (Jansen 2011: 198-199). The latest major addition to the class voting literature at the time of writing, Evans and de Graaf (2013), advocates a fourth generation approach by arguing that parties need to “diverge 5
on matters of relevance to people in different classes or with differing levels of religiosity for there to be class and religious differences in party preferences” (Evans and de Graaf 2013a: 7). The goal of the book is to test sociological explanations versus political ones, in particular whether the positions of parties on class and religious issues affect the level of class and religious voting. The comparative part of the book is testing these explanations on fifteen Western democracies from 1960-2005, although with a dichotomous dependent variable. While some of the decline in class voting is explained by changes in party positions and party polarization, important declines in class voting remain even after controlling for these two factors. This is in line with other third generation findings, as already discussed. Nevertheless, the authors admit that this might be due to the collapsed party choice variable, “ignoring the complexity of the ‘new left’ and the ‘new right’” (Evans and De Graaf 2013b: 392). The case studies that follow are usually applying a fourth generation dependent variable. These show a more nuanced picture. In only four of the twelve countries studied, namely Australia, Britain, France and Spain, do the authors find a clear decline of class voting. In two countries, West Germany and Italy, there is a modest decline. There is stability in Canada, Denmark and East Germany. In Poland they find alignment, in the US realignment, and in the Netherlands decline and then realignment (Evans and De Graaf 2013b: 394). It is also interesting to note that in the Australian case study, one of the four showing a clear decline, the party choice variable was still dichotomous (Marks 2013: 149). The authors also attempted to explain the changes or stability in class voting. In most countries, the changes were explained by top-down (i.e. political) processes. The lack of decline in Canada and Denmark were accounted for by top-down stability. In Australia, the decline was accounted for by both political and sociological factors. The decline and realignment in the Netherlands, as well as the alignment in Poland, were explained by bottomup processes (Evans and De Graaf 2013b: 394).
1.3 The Aim of the Thesis – Filling the Gaps This thesis’ aim is to fill certain gaps in the newly formed fourth generation of class voting studies. Until now, these studies have mostly been divided into two parts: One comparative, large-scale part, followed by one or more case studies (see Jansen 2011; Evans and De Graaf 2013). Only the case studies have actually measured total class voting by using fourth 6
generation party choice measures. The comparative parts have commonly been using the traditional left-right dichotomous party choice variable, measuring what Knutsen (2006) labelled “overall left-right class voting” (i.e. detailed class schema but dichotomous party choice variable). This is partly due to the fact that these studies are longitudinal, often covering most of the post-war period. As Evans and De Graaf (2013a: 12) put it, “[a]lthough it would be ideal to have strictly comparable measures for each case, this is not feasible in a project that covers so many surveys across such extensive periods of time.” Also, these longitudinal studies have tended to focus mainly on whether or not and to what degree class voting has been declining within countries over time, without enough emphasis on the variation between countries (see also Knutsen 2004: 2). This thesis, on the other hand, will measure total class voting in a comparative setting. By limiting the cases in time, we avoid several of the problems related to non-comparable cases. We also change the focus from the question of decline and change over time to the question of how the situation is today. With the possible exception of Knutsen (2006), this will be the first full-fledged comparative fourth generation study. Hopefully the end result will cast light upon both the need for a more nuanced party choice variable and class voting and its mechanisms in Western Europe. Given that most studies even today use a dichotomous left-right dependent variable, the findings may have huge implications as to whether or not this practice should continue. We will further attempt to disentangle the relationship between class and voting by testing one of the mechanisms. This means that we will try to say something about why there is an association between structure and vote. Thomassen (2005: 6-7) writes that there are three main schools of thought in this area. First, the political-psychological approach, which emphasizes that party identification, developed early in life, shapes people’s political attitudes, perceptions, and political behaviour. The second school is based on Downs’ economic theory of democracy. This school claims that ideology, notably the left-right dimension, is used to reduce information costs for voters, who assess parties based on political issues and government performance. Finally, we have the political-sociological approach, represented by Lipset and Rokkan (1967) in the European context. They claim that the cleavage structure is reflected in differences in value orientations, which again affect voting. This is evident in their description of parties as “alliances in conflicts over policies and value commitments within the larger body politic” (Lipset and Rokkan 1967: 5, italics in 7
original). While acknowledging the role of economic interests in group preference formation, they emphasize the conflict over norms and values in all of the four cleavages (see for instance Lipset and Rokkan 1967: 11; 15; 19). When it comes to the specific issue of class voting, they write that “[c]onflicts between workers and employers have always contained elements of economic bargaining, but there have also often been strong elements of cultural opposition and ideological insulation.” (Lipset and Rokkan 1967: 18). Amongst more contemporary scholars, Knutsen and Scarbrough (1995: 494) even includes value orientations as a part of the definition of a cleavage, as formerly mentioned: “…a cleavage engages some set of values common to members of the group; group members know a ‘common life’ in so far as they share the same value orientation.” (Knutsen and Scarbrough 1995: 494).1 In chapter 4, we will test the mechanism suggested by the political-sociological approach. We will compare the bivariate relationship between class and party family specific voting with class voting after controlling for the most important value orientations. How much of the effect of class is indirect through value orientations? Which value orientations account for most class voting? How does this differ between party families? These are central questions to be answered in the last two chapters of this thesis. Evans (2010) is highly critical of the lack of work in this area. Our analysis does exactly what he recommends: “Multi-variate analysis should preferably start with reduced form models that contain only structural characteristics. More elaborate specifications that include both structural and potential mechanisms can then be introduced in a path-analytical framework that allows explicit tests of the role of perceptions and attitudes in connecting structural positions and political preferences.” (Evans 2010: 638). Nevertheless, before we can test mechanisms of class voting, we need to describe the phenomenon properly. This is what we will do in the third chapter. A detailed description of the class basis of the party families in eighteen West European countries will give us an impression of the need for a more nuanced party choice variable. Notably, we will be able to ascertain whether some of the non-manual classes vote for the New Left and whether the manual classes vote for the New Right. We might also discover other patterns that we have not hitherto found. We will see whether parties belonging to a certain party family have the same class basis or not. The strength of class voting, described for instance by Knutsen (2006) 1
For a more in-depth discussion of the three schools of thought, please refer to Antunes (2010)
8
via the kappa index, will also be disentangled. We will see which classes that contribute to the strength of class voting. What classes vote disproportionally in favour of each party family and which do the opposite? Does this differ between countries? In sum, the aim of this thesis is twofold: To describe the class basis of the West European party families and the strength of class voting; and to test one of the mechanisms creating the differences we discover. It is hoped that in doing so, some light will also be shed on the methodological issue of what dependent variable to choose in future studies of class voting.
9
Chapter 2: Research Design 2.1 Data: The European Values Study 2008 The European Values Study (EVS) is a decennial survey, occupied with the values of Europeans. There are six main topics: Life, Family, Work, Religion, Politics, and Society. We will be using the latest version at the time of writing, i.e. the one from 2008. The interviews were conducted face-to-face by trained field workers who made at least three revisits in case of not reaching the respondent at the first visit. All countries employed a representative multistage random sample of the adult population of 18 years or older. The sample consists of approximately 1,500 respondents for each of the 47 countries/regions, although there is some covariation between the size of the samples and the size of the population in the countries/regions. All information in this section is gathered from their website.2 The specific data set we are using is an edited version of the EVS 2008 where only the relevant West European countries are kept. We have a total of 25,299 respondents from 18 countries. The country samples vary from 808 in Iceland to 2,038 in Germany. Detailed descriptive statistics are to be found in the appendix, section A.2.
2.2 Variables 2.2.1 The independent variable: Social class
Social class is obviously a key concept in studies of class voting. As mentioned in section 1.1, the first two generations used the simple manual/non-manual divide when studying class voting (Alford 1962), but this way of measuring class was increasingly criticized and rendered less relevant throughout the third generation of class voting studies. The most important alternatives today are different variations of the Erikson-Goldthorpe-Portocarero (EGP) class schema and variations of the class schema of Daniel Oesch (2006a). The EGP class schema was first developed by Erikson, Goldthorpe and Portocarero (1979), and then updated and improved by Erikson and Goldthorpe (1992). The class schema is based on a distinction between the position of an individual within labour markets and production units. First a distinction between employers, employees and the self-employed is drawn,
2
http://www.europeanvaluesstudy.eu
10
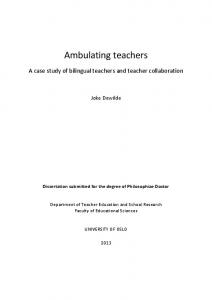
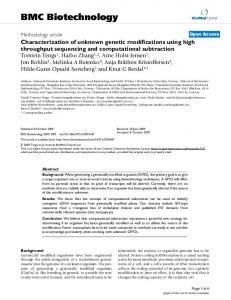
derived from both the Weberian and Marxian tradition (Erikson and Goldthorpe 1992: 37). Distinctions are drawn between large employers and small employers, and, within the latter group, between those belonging to industry and agriculture. The self-employed are also divided into an industrial and an agricultural component (Erikson and Goldthorpe 1992: 36). However, the basic distinction in the schema, according to Knutsen (2006: 14) is within the category of the employees. These are separated depending on their relationship to their employer. A main distinction here, following Weber, is between employees with a service relationship to their employer and those with a labour contract. If the employer has delegated authority to the employee or the employee uses specialized knowledge and expertise, there is a service relationship between the two. These positions are usually characterised by a certain amount of autonomy, and the performance of the employee is based on a degree of moral commitment rather than external sanctions. The relationship requires that the employer invests trust in the employee, and is usually a rather durable relationship. Those with a labour contract, on the other hand, usually perform more or less routinized tasks under supervision, and are paid in wages rather than salaries (Erikson and Goldthorpe 1992: 41-42). However, the service relationship and the labour contract must be seen as ideal types, and many occupations fall inbetween. On this basis, the EGP schema differentiates between the eleven classes outlined in figure 2.1.3 [Figure 2.1 here]4 However, this theoretical 11-class schema is not very suitable for empirical analysis. Erikson and Goldthorpe (1992: 35-37) insist that some classes must be collapsed to ensure crossnational comparability and to avoid cell counts that are unreliably low. Our collapsed six class schema is based on the collapsed five class version of Erikson, Goldthorpe and Portocarero (1979: 425), except that we have kept the distinction between skilled and unskilled manual workers. This is because there are some theoretical reasons to believe that these groups may differ in terms of support for certain party families (see chapter 3).
3
Due to the extensive use of this schema in class research during the last decades, a further introduction seems redundant. The interested reader may consult Erikson, Goldthorpe and Portocarero (1979) and Erikson and Goldthorpe (1992: chapter 2). 4
Sometimes it is not possible to place the tables or figures where they are supposed to be, for reasons related to layout and text flow. In these cases, we have written where the table or figure ideally should be, like here, and then it is inserted as soon as possible after this.
11
Figure 2.1: The EGP 11-class schema. Large
Class I
Employers
Industry
IVa
Agriculture
IVc
Small SelfEmployed Service Relationship
Industry
IVb
Agriculture
IVc
Professional, higher technical, administrative and management
Higher grade
I
Lower grade
II
Higher grade
IIIa
Lower grade
IIIb
Routine, non-manual Employees
Intermediate
Lower technical, and manual, supervisory
V Skilled
VI
Unskilled
VIIa
Agriculture
VIIb
Industry Labour Contract
Manual Non-industry
Based on figure 2.1 in Erikson and Goldthorpe 1992: 36.
On the other hand, there are both theoretical and empirical reasons to combine the farmers with the petite bourgeoisie. As we will see, Oesch (2006b: 269) categorizes both farmers and other self-employed as petite bourgeoisie, based on theoretical arguments about their employment status (self-employed) and their marketable skills. The traditional Marxist use of the term includes farmers (Kitschelt 1994: 26). It is also common in the empirical parts of the literature to combine the two groups (see for instance Evans and De Graaf 2013), and they do indeed vote rather similarly.5 Another reason to combine the groups is that there are so few farmers (and also rather few petty bourgeois) within most countries that the estimates of class voting for these groups in the survey material are surrounded by extreme uncertainty. Any findings would be severely limited by doubt of whether they are a property of the sample or the population. Also, like Ivarsflaten and Stubager (2013: 124), we want to avoid too small categories. Empty cells make it impossible to calculate log odds ratios. There is one drawback, however: Keeping farmers as a separate class would make it easier to analyse the class cleavage in the commodity market, namely the one between producers and consumers of agricultural products (see Lipset and Rokkan 1967). This would be particularly relevant when analysing the class basis of the Agrarian party family (see section 3.4). 5
I have calculated the percentages of farmers and petty bourgeois voting for different parties in different countries separately. For most party families (with some exceptions, like Agrarian and Radical Right parties), these groups tend to vote rather similarly.
12
Table 2.1 shows how the applied class schema in this thesis compares to the original 11-class schema. Table 2.1: The Applied Class Schema Types of occupations, EGP
Classes and terms used in this study
Class I: Higher-grade professionals, administrators and officials; managers in large industrial establishments; large proprietors
Higher Service Class
Class II: Lower-grade professionals, administrators and officials; higher-grade technicians; managers in small business and industrial establishments; supervisors of nonmanual employees
Lower service class
Class IIIa: Higher grade routine non-manual employees (administration and commerce) Class IIIb: Lower grade routine non-manual employees (sales and services; other rank-andfile employees)
Routine non-manual employees
Class IVa: Small proprietors, artisans, etc., with employees Class IVb: Small proprietors, artisans, etc., without employees
Petite bourgeoisie
Class IVc: Farmers and smallholders; selfemployed fishermen Class V: Lower-grade technicians; supervisors of manual workers
Skilled manual workers
Class VI: Skilled manual workers VIIa: Semi- and unskilled workers (not in agriculture)
Unskilled manual workers
VIIb: Agricultural workers Source: Erikson, Goldthorpe and Portocarero 1979: 420; Erikson and Goldthorpe 1992: 36.
The other major modern alternative is the class schema of Daniel Oesch (2006a). While he does include hierarchical divisions through employment relationships and marketable skills, like Erikson and Goldthorpe, he adds a horizontal dimension to it: the work logic. Jobs within the same employment relationship may differ significantly in their setting of work process; their relations of authority; their primary orientation and the skill requirements (Oesch 2006b: 13
265-268). With these traits, Oesch (2006b: 269) creates a 17-class schema based on four different work logics (independent; technical; organizational; interpersonal service) and four different marketable skills (professional/managerial; associate professional/managerial; general/vocational; low/unskilled). This schema does to a greater extent than the EGP schema take into account the increasing heterogeneity of the service class6, like the distinction between socio-cultural specialists, higher-grade managers and technical experts. While the schema of Oesch is highly interesting and increasingly popular (see for instance Kitschelt 2013: 229-231), we will stick with the EGP class schema in this thesis. First and most importantly, this is still “the only systematically validated measure of class position available for use in this sort of large scale comparative project” (Evans and De Graaf 2013a: 13). Also, we want to shed some light upon the need for the fourth generation party choice variable. Hence it is an obvious advantage to be able to compare our findings with those of the third generation – which usually applied this schema. Our EGP class variable is based on question 112 in the EVS 2008 questionnaire, where the respondent is asked the title of his or her main job (or, if not employed at the moment, the title of the last job) and question 112a, where the respondent is asked what kind of work he/she does or did do most of the time. On the basis of these two questions, the interviewer codes the job using the ISCO88 system. These codes are transferred into the full 11-class EGP schema. We then created the EGP6-variable by combining some classes as shown in table 2.2. For descriptive statistics, please refer to appendix A.2.1, which also shows considerable crossnational variations in class composition. 2.2.2 The dependent variable: Party choice The need for a more nuanced party choice variable in the class voting literature was discussed in section 1.2. Here, we will rather focus on the concrete operationalization. In a case study, one could simply use the national parties as individual nominal vote options; but comparative studies need to categorize the parties into some form of party families (Knutsen 2004: 14; Mair and Mudde 1998: 212). Party families may be classified by criteria such as names, historical traditions and origins, party programmes or memberships in transnational party organisations (Mair and Mudde 1998). The classification used here will be based on the first three of these. I follow Knutsen’s 6
According to Kitschelt (2013: 231), this class «blows apart» because they differ on a number of dimensions.
14
approach, which is built upon former classifications like von Beyme’s (1985).7 The categorization includes ten party families: Communist, Left Socialist, Green, Social Democratic, Agrarian, Ethnic/Regional, Liberal, Christian Democratic, Conservative, and Radical Right parties (Knutsen 2004: 14-19; Knutsen 2006: 34-39). The parties are categorized into the different party families based on Knutsen’s expert judgement, rather than for instance party manifestos or voter surveys (see Bakker and Hobolt 2013: 31).8 We will discuss these party families more in detail in chapter 3. Classification of parties into party families poses several challenges, although we avoid some of them here. First, the party family schemas may be geographically limited to Western Europe, for which they were usually developed. This is no problem here, as this thesis limits itself to that particular geographic area. Second, time may render the party families increasingly outdated as politics change (Mair and Mudde 1998: 215). This should not pose any problems: The classification used is recently developed (Knutsen 2004; 2006), and the analysis is not cross-temporal. We have chosen a “vote intention” approach to measure party choice, namely question 75a in the EVS 2008. In other words, the respondents answer what party they would vote for if a general election were to be held the next day. This question avoids recall problems one might have if asked what one voted for in the last election, which could turn out to be several years ago (Knutsen 2004: 19). When the respondents have indicated that they would not vote, we have used question 75b, asking what party appeals the most to the respondent. On the basis of these two variables, we have constructed a party family preference variable. As we utilize the same data set as Knutsen (2012), this party choice variable is constructed in the exact same way as his (see Knutsen 2012: 11). Descriptive statistics may be found in section A.2.2 in the appendix. There will be one section for each party family to be analysed. The dependent variable will consist of a dichotomy coded 1 if the respondent voted for the particular party family (or declared it as the most appealing) and 0 if the respondent voted for any other party family. Responders who did not vote or did not reply to any of the two questions above are excluded from the analysis. 7
This is, in turn, built upon an expansion of Lipset and Rokkan’s (1967) conflict model, with 10 conflicts considered to shape the West European party systems (von Beyme 1985: 23-25) 8
For a full list of exactly how each party was coded, please refer to section A.1.1 in the appendix.
15
2.2.3 The intermediate variables: The value orientations As mentioned in chapter 1, we wish to assess the relevance of value orientations as intermediate variables between social class and voting. Values are here defined as “conceptions of the desirable which are not directly observable but are evident in moral discourse and relevant to the formulation of attitudes” (van Deth and Scarbrough 1995: 46). To translate unobservable values into an empirically useful device, van Deth and Scarbrough (1995: 41-43; 46) consider attitude patterns which are constrained by the values, called value orientations. While van Deth and Scarbrough (1995) identifies three important value orientations, later work has expanded on this. Knutsen (2012: 4-5) argues that there are five important political value orientations that are relevant for explaining party choice in modern, West-European societies. The first two are derived from the structural cleavage model of Lipset and Rokkan (1967). These are often said to belong to “Old Politics”, meaning that they are related to traditional conflicts in industrial societies. The religious cleavage has given roots to a religious versus secular value orientation. Here, religious values, such as traditional and Christian morals, stand against secular values where people wish to make their own decisions without the guidelines of the church. The Industrial Revolution, in turn, gave rise to a value orientation related to economic ideology, often referred to as economic left-right values or left-right materialist values. The main issues in this value orientation are related to questions of economic (in-)equalities, ownership of the means of production, and conflict over the desirability of a market economy (Knutsen 1995: 160). Based on a discussion of former works in the subfield, Knutsen (2012: 5-6) uses three value orientations related to “New Politics”, meaning that they are connected to post-industrial conflicts. The first of these is the libertarian-authoritarian value orientation. While libertarians emphasize self-actualisation, autonomy, openness and self-betterment, the authoritarians are concerned with ideas of law and order, authority, discipline, and dutifulness. While both Kitschelt (1994, 1995) and Flanagan (1987) include items related to immigration, patriotism or resistance to ethnic diversity at the authoritarian pole, these have been singled out by Knutsen (2012: 6) as a value orientation in and of themselves. Environmental versus economic growth values are the last, and perhaps most manifest, value orientation related to New Politics.
16
Utilizing the same data set as Knutsen (2012), namely EVS 2008, we are able to use the exact same operationalization of these value orientations that he did. While the details are to be found in the appendix, a short note should be made here. The indexes were constructed by combining the answers to several substantial questions related to the value orientations at hand. The only exception to this is the religious-secular value orientation, where several substantial questions of the religious beliefs of the respondent were asked and used as a proxy of their religious-secular values. To our credit, we avoid ideological self-placement scales. These receive heavy criticism from scholars such as Evans (2010: 636-637) for confusing the independent and the dependent variable.9 To be able to comprehend the analyses in chapter 4, it is vital to know the direction of the indexes. They all go from 0-10. A high score on the economic left-right value orientation (economic ideology in chapter 4) indicates a leftist position. A high score on the religioussecular value orientation (religiosity) indicates a high level of religiosity. High scores on the environmental versus growth value orientation (environmental values) are more concerned with the environment. Higher scores on the libertarian-authoritarian value orientation (libertarianism) imply a higher level of libertarianism. The immigration value orientation (immigration orientations) has a high score when the respondent is positive to immigration and immigrants. The exact operationalization and construction of the value orientation indexes are discussed in section A.1.2, and descriptive statistics are available in section A.2.3.
2.3 Research Strategy 2.3.1 Description In chapter 3, we will describe the class basis of the party families in Western Europe. There will be one section for each party family. We will start with a short theoretical subsection with some hypotheses of what to expect from the bivariate relationship between class and voting for the particular party family. The hypotheses are derived from theoretical expectations of where the classes and party families are positioned in the two-dimensional Western European political space. Inspired by Kitschelt’s (1994) framework, we assume that the political space is divided by an economic
9
In other words, many voters will for instance place themselves in the «Left»-category if they vote for a party on the Left and vice versa, yielding an overlap between the independent variable (in this case the economic leftright value orientation) and the dependent variable (party choice).
17
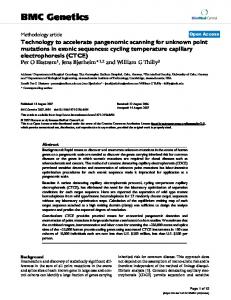
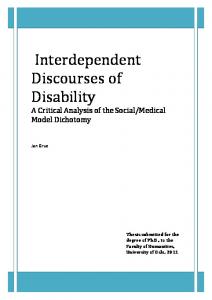
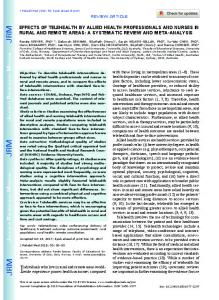
axis (socialist-capitalist, in Kitschelt’s terminology) and a value axis (libertarianauthoritarian). Whereas West European politics were formerly concerned with mainly a materialist conflict of distribution and control of the means of production, modern society has seen an increase in highly educated, client-oriented, female employees. This shift, in turn, has changed the political space from “a simple alternative between socialist (left) and capitalist (right) politics to a more complex configuration opposing the left-libertarian and rightauthoritarian alternatives” (Kitschelt 1994: 30-31). Kitschelt (1994: 20-27) discusses the position of the different layers of society in this two-dimensional space (see figure 2.2). [Figure 2.2 here] This model is our starting point. As we see in figure 2.2, Kitschelt argues that the petite bourgeoisie is both most authoritarian and most economically right-wing. People in low-skill jobs in domestic services and manufacturing are positioned as centrist on the economic axis and authoritarian on the value axis. These are similar to our unskilled workers. Those with “high skill jobs in internationally competitive and service sectors” are assumed to be somewhat less authoritarian, but still centrist economically speaking. The administrative and manual public sector jobs are considered to be somewhat libertarian and left-wing. Liberal professionals and corporate organization men are mostly regarded as authoritarian and economically right-wing. High-skill employees processing symbols and clients in the private sector are fragmented when it comes to economic ideology, but are libertarian. Employees with high education processing symbol and clients in the public sector are placed in the leftlibertarian corner of the two-dimensional space. However, we cannot use this model in its current form, as Kitschelt’s classification of social groups differs from the EGP schema. Notably, Kitschelt separates private and public jobs, which our schema does not; whereas our schema separates the manual and service sectors; which Kitschelt does not always do. The main point is that we will use the same framework. We will rely on theoretical and empirical contributions throughout chapter 3 and 4 to position the EGP-classes within the two-dimensional political space. We will, as mentioned in section 2.2.3, analytically distinguish the value axis into three different New Politics components: Environmentalism, immigration values, and libertarianism proper. After positioning the classes, we will do the same for the party families. This is similar to what Kitschelt (1994: 3037) does when he discusses the current positioning and possible future strategies for social democratic parties (see Kitschelt 1994: 32). 18
Figure 2.2: Ideology and occupational groups in advanced capitalist democracies Social structure and preference formation (high education, women, symbol and client processing)
Libertarian politics
Left-libertarian politics high education symbol and client processing jobs in the public sector
Economicleftist politics (public and/or domestic sector, nonowners)
high skill, processing symbols and clients in the private sector
administrative and manual public sector jobs
high skill jobs in the inter - nationally competitive manufacturing and service sectors low-skill jobs in domestic services and manufacturing
liberal professionals and corporate organization men
petite bourgeoisie
Authoritarian politics
Economicrightist politics (private and/or internationally competitive sector, owners)
Right -authoritarian politics
(low education, men, symbol and artifacts and documents)
Figure 2. Ideology and occupational groups in advanced industrial democracies.
Source: Figure 2 in Kitschelt (1994: 27)
As this is a study of the demand-side of politics, the position of the party families are extracted from relevant literature and assumed to be the same across individual party family members. In reality, individual parties within a party family may of course differ from these positions. Future research should follow the approach recently developed by Evans and De Graaf (2013), integrating the demand and supply side of politics to model the party specific positions – but that is beyond the scope of this thesis. The hypotheses are thus also based on a Downsian (1957) view of voting, where we assume that voters normally try to minimize the political distance between the party they vote for and their own views (although in some cases this view may be qualified, see for instance section 3.3.1). After developing the party family specific hypotheses, we move on to present an empirical part where the support of the party family according to class within each country is presented. By looking at the shares of each class voting for the given party family in each country, we can see whether the class basis is the same for all parties in the party families. The log odds ratios are usually considered in the class voting literature because they are insensitive to 19
changes in the overall support for parties or party groups (Knutsen 2006: 52). Although this study is not longitudinal, log odds ratios will be used because they are also insensitive to differences in the overall support for parties. There are, however, three problems with log odds ratios. The first is that, although the measure is insensitive to differences in the overall support, small parties are in a way more likely to obtain large (positive or negative) log odds ratios by chance, because a one percentage point increase in support in one social class (which is by far within the margin of error) will increase or decrease the log odds ratio by much more for a party with 1% of the total votes than for a party with 10% of the total votes. This may be dealt with to a certain extent by being especially aware of the absolute percentage differences when considering differences in support for very small parties between social classes. If deviations from the expected log odds ratio pattern in chapter 3 are found to be due to tiny parties, they will not be discussed in detail. The other problem is that a log odds ratio by definition is a comparison of two groups. It shows us how the classes vote compared to the reference group, in our case the unskilled workers. What we need is a coefficient for the total relationship between class and voting. Hout, Brooks and Manza (1995) launched the kappa index for this purpose, which measures total class voting. By using the standard deviation of the log odds ratios of the classes, we can measure the difference in voting behaviour between the classes. The higher the value, the more the classes differ in their voting behaviour. Whereas the kappa index does not tell us whether the parties within a party family have the same class basis, it does give us a handy measure of the strength of class voting; i.e. how much the classes differ in voting for each particular party in the particular party family (see also Knutsen 2006: 52-53). The third problem is that no log odds ratio (and hence no kappa value) can be obtained when a party has no voters in the sample belonging to a particular class in a particular country. This is especially likely when considering the support of small parties within small classes, like the support of the Norwegian Left Socialists within the petite bourgeoisie. As mentioned, this is one of the reasons as to why we combined the farmers with the petite bourgeoisie. Finally, we conclude chapter 3 by comparing the strength of class voting for each party family. We will do this by calculating the mean of the kappa values for each party within a party family, and a kappa value based on the mean support of the party family. The first measure will illuminate how class based a party family is; the second will help us see to what 20
degree the party family has the same class basis in all countries. We discuss this further in section 3.9. 2.3.2 Testing mechanisms: Multilevel logistic regression To test one of the mechanisms leading to the differences we find between the classes, we will first analyse the bivariate relationship between class and voting for each party family (model 1 in chapter 4). As the model will be logistic (see below), the coefficient for each class will be their log odds ratio compared to the unskilled workers, our reference group. Based on these log odds ratios, we may calculate a kappa value (the standard deviation of the log odds ratios). The kappa value obtained from a logistic regression without controls is labelled “gross kappa” by Hout et al. (1995: 809), measuring total class voting. In our case we will refer to it as measuring “total party family specific class voting”, as our analyses are done separately for each party family. For each analysis, we will exclude the countries which do not have the relevant party family in its political system. The dependent variable will be a dichotomy: Voting for the specific party family versus voting for any other party family. As Dolezal (2010: 542) did in his analysis of Green voting, we will exclude non-voters and respondents who did not answer the question of what they voted for or what party that appeals the most to them. Second, we will control for each of the value orientation variables discussed in section 2.2.3 one by one, and see how these change the class coefficients (model 2-6 in chapter 4). As we do not expect any single value orientation to account for all of the class voting, we need a way to measure how much of the class voting that is accounted for. We will do this by calculating a kappa value for each model, based on the coefficients of the classes. Hout et al. (1995: 809) refers to this as the “net kappa”. Considering the change in the kappa value after controlling for a value orientation (net kappa) compared with the kappa value from the bivariate model 1 (gross kappa), we will see how much of the total party family specific class voting the value orientation accounts for. It should be mentioned that as the log odds ratios are non-linear measures, a 20 % reduction in the kappa value does not necessarily equal a 20 % reduction in class differences. The reduction in the kappa values, i.e. in total party family specific class voting, will be seen as a rough measure of how much of the class differences the value orientation accounts for. Finally, we control for all the value orientations at the same time (model 7 in chapter 4), to see how much of the total party family specific class voting they account for together. We will 21
refer to this as “direct party family specific class voting”. In Hout et al.’s (1995) terminology, we compare the gross kappa with the net kappa. To visualize the results, we also calculate and plot the predicted probabilities10 of voting for the particular party family for each class, for a selected few of the models most relevant to our hypotheses. If the differences in predicted probabilities are reduced at any given level of the control variable, the magnitude of the reduction is a sign of how much of the bivariate classvoting relationship we have accounted for. We need to choose a statistical model that is suitable for the purpose. There are several special statistical traits we must account for with the research question at hand. First, the dependent variable for each analysis will be dichotomous, as mentioned in section 2.2.2. Thus we must use logistic regression to avoid predictions outside the possible range (0-1) and to avoid violation of certain assumptions of linear regression (see Skog 2004: 352-353, 360, 377). In addition, also the general assumption that every respondent is independent of all other respondents (Skog 2004: 380) may be violated. In many cases respondents are more similar to each other within a given country than between countries: There is within-country homogeneity. The respondents are nested in their national political systems, meaning that they belong to a country with a political system which has a homogenizing effect on them. This affects the standard errors, as we assume more information from each respondent than we actually obtain (see Bickel 2007: 145; 180). For each party family to be analysed, we will first test whether the statistical dependency between respondents in each country is large enough to need to be dealt with by for instance multilevel analysis. Since this is multilevel logistic regression, we may perform a likelihood ratio test for the null hypothesis that the residual variance at the country level (also called, more generally, “level 2 variance” or “cluster variance”) equals 0. In other words, we test the null hypothesis that the intercept does not vary between countries (see Rabe-Hesketh and Skrondal 2012: 536). This test is performed for each subchapter before analysis commences, although we expect this test to show country level residual variance – after all, we already know that the support for the party families varies in different countries.11 10
The predicted marginal or population-averaged probabilities; not the mean or mode of the predicted subjectspecific probabilities (see Rabe-Hesketh and Skrondal 2012: 548-557). 11
As these tests predictably gave the expected results in all cases, they are not reported. The interested reader may be sent the test results on demand.
22
We can deal with this statistical dependency in several ways. We could use a fixed effects model by incorporating dummy variables for each country except one – this would, however, require a huge amount of extra parameters to be estimated (17 in the case of the Social Democrats) and thus not be very efficient. It may also give inconsistent estimates (RabeHesketh and Skrondal 2012: 557). We could use ordinary logistic regression with cluster robust standard errors, thus “controlling” for the dependency as a statistical nuisance, or we could use multilevel logistic regression, which considers the variances as interesting in and of themselves. In this thesis, we will employ the latter. This method should be of huge interest to the class voting literature, as it makes it possible to calculate how much the effect of class varies between countries and how much of this variation we can “explain” by adding country level variables, like party polarization or GDP/capita. However, with a class schema of six classes suspected to have non-linear effects, we would have to run a model with six random parameters (the random intercept and five random slopes), meaning that six coefficients are allowed to vary between countries. Logistic multilevel models are computationally demanding even with just the random intercept.12 For this reason, such a study must be left to others with more computer power, manpower, and time than those we dispose of at the moment. This is also an important reason for running separate analyses for each party family, rather than running a single multinomial logistic regression where all party families are analysed at the same time. In multinomial logistic regression, each variable would have one coefficient for each category of the dependent variable except the reference category. Even the simple bivariate model with six classes and eight party families would yield more than 35 parameters. Another issue is that of sample size. Our analyses naturally include between 18 (countries with Social Democratic parties) and 5 (Agrarian) level 2 units. Although there is some disagreement on the topic, a much cited “rule of thumb” is that we at least need 30 level 1 units in each of at least 30 level 2 units to get reliable variance estimates (the 30/30-rule, see Kreft (1996)). There have also been some discussions about possible bias in coefficients and 12
and the increase in calculation time is approximately proportional to the number of random coefficients times the number of integration points used (Rabe-Hesketh and Skrondal 2012: 541). In this study, the number of integration points has been gradually increased until the results are stable. This has been done for each and every model, as recommended by Rabe-Hesketh and Skrondal (2012: 540).
23
standard errors of level 2 variables, but these are not relevant here, as we will not include level 2 variables in this thesis. However, later studies should look closer into this, as mentioned. In any case, as Andrew Gelman (2014) has briefly argued, multilevel analysis could be used at any number of level 2 units. This is due to the fact that a non-multilevel analysis is equivalent to a multilevel analysis where the level 2 residual variance is set to 0 or infinity, which hardly can be said to be better than a biased estimate. Nevertheless, the intercept variances and changes in these between the models will only briefly be commented upon, and they will not be given considerable weight in our interpretation of the results. For the analyses with the fewest level 2 units, like those including Agrarian parties, we will not discuss the intercept variances at all. When it comes to possible bias in the estimation of the fixed effects in the multilevel models, we will also run all models with an ordinary logistic model with cluster robust standard errors. If these differ substantially from the estimates from the multilevel models, this will be commented upon. Finally, there is some confusion as to whether or not to use survey weights and how to use them in multilevel logistic regression. The standard function for multilevel logistic regression in Stata at the time of writing, xtmelogit, does not even allow the use of weights. Kolenikov (2008) explains this: “The basic reason is that the weights can apply to different levels, and there is no literature consensus as to what’s the best way to go about that even in simpler linear models…” The models in this thesis are normally run with the regular xtmelogit command in Stata, unweighted. To test the robustness of the results – to test whether they are sensitive to small changes in the model specifications – all models are also estimated with the gllamm command (see Rabe-Hesketh, Skrondal, and Pickles 2004), which allows the use of weights. We will run three alternative specifications: One with total weights on level 1, one with total weights on level 2, and one with separate level 1 and level 2 weights. The models will also, as mentioned, be run with a fourth alternative specification: Ordinary logistic regression with cluster robust standard errors and applied importance weights. If the results differ substantially from those reported in chapter 4, this will be commented upon in footnotes as the “alternative specifications”. The results from all the alternative specifications are available upon request.
24
In chapter 5, we will conclude the thesis by summing up how much class voting each value orientation accounts for on average, and how this varies by party family.
25
Chapter 3: The Class Basis of the WestEuropean Party Families There is no way to explain a phenomenon which we have not yet described properly; or else we would not know what to explain. What follows is a complete description of the class basis of West European parties belonging to either of the party families mentioned above, with two exceptions. The Communist parties have so few voters in the samples from most of the countries (there are exceptions, like Greece and Portugal) that there are plenty of empty cells. This ruins the calculation of log odds ratios and highly affects the kappa values. Thus, there is no subchapter for the Communist parties. Also, the ethnic-regional parties are not presented in this chapter. These are very few (Svenska Folkpartiet in Finland; the Nieuw-Vlaamse Alliantie in Belgium; and the Scottish Nationalist Party and Plaid Cymru in Great Britain) and very different from each other – they are also popular with different classes. First, we will briefly discuss what class basis to expect for each party family given the literature; then we will assess the class basis empirically. The hypotheses about what to expect necessarily include explanatory claims (or at least correlational ones) that attempt to justify the bivariate relationship between class and voting, but notice that even when the class basis is as predicted, this does not confirm the causal claims. True predictions do not necessitate true explanations. In chapter 4, however, we will attempt to test some of the explanations. The hypotheses are as mentioned mainly derived from theoretical expectations of where the classes are positioned on the two political axes of Kitschelt (1994). These are the economic axis (socialist-capitalist) and the value axis (libertarian-authoritarian). As discussed in chapter 2, we split the New Politics orientations – or what Kitschelt called “libertarianism” – into three value orientations: Environmentalism, immigration orientations, and libertarianism proper. The working classes are assumed to be economically progressive (left-wing), and the service classes to be economically conservative (right-wing). On the other hand, we expect the middle class to be libertarian and the working classes to be authoritarian. We also expect these values to affect voting. These statements are broadly supported in the literature (for a short review, see Achterberg 2006: 241-242). We will go in-depth on what to expect from each social class in the sections to come. 26
3.1 The Left Socialist Parties The Left Socialist (hereafter: LS13) party family is based on a post-materialistic conflict of values, rather than a materialistic conflict of resources (Oesch 2013: 31), although its roots are partly to be found in economic left-opposition to the Social Democrats. After the suppression of the reform movements in Hungary in the 1950s and Czechoslovakia in 1968, communism lost much of what was left of its credibility as a progressive force. At the same time, social democracy had prospered with the growing economy which went into recession in 1973, bringing with it the fall of Keynesianism and leaving social democracy in disarray. In the years that followed, the Communist and Social Democratic parties no longer hegemonized the Left, thus opening space for new leftist parties (Eley 2002: 5-8). Among the most successful of these still in existence is the Danish Socialistisk Folkeparti. The parties in this party family typically combine a leftist economic view with a libertarian or post-materialistic value stance on issues such as abortion, the protection of the environment, participatory democracy and gay rights (Eley 2002: part IV). 3.1.1 Hypotheses According to Oesch (2013: 31-32), the rise of the New Left and the Radical Right has been interpreted as signs of the end of class politics, as these parties no longer were based in particular social groups. However, Oesch strongly contends this interpretation and claims that the New Left and Radical Right have diametrically opposed class structures. This is in line with the view of Herbert Kitschelt (1994) that modern societies are divided along a libertarian-authoritarian axis which is based on cultural and value issues (lifestyle, sexuality, immigration, and so on). Kitschelt suggests that the New Left occupies an extreme position along this axis, near the libertarian pole. Let us first consider the workers. As will be explicated in greater detail in section 3.8 on the Radical Right, workers are especially negative to immigration, both for economic (domestic and international competition) and cultural reasons. In addition, they are prone to authoritarianism due to a comparably low level of education. Kitschelt (1994: 27) places the “low-skill jobs in domestic services and manufacturing” as one of the most authoritarian groups in modern societies. The high skill jobs in the internationally competitive manufacturing and service sectors are seen as occupying a middle ground in this respect. Both 13
A list of all abbreviations used in this thesis is to be found in the appendix. The abbreviations and the full names will be used interchangeably based on esthetical considerations.
27
groups are seen as occupying a centre position along the economic axis in Kitschelt’s framework. However, Knutsen (1995: 179-180) anticipate that the working class will be more left materialist. Administrative and manual public sector employees are regarded as more socialist. We suspect that the routine non-manual employees in the EGP schema are more likely to vote Socialist Left than the workers as the former are more often public employees and also (per definition) working in the service sector, which is less affected by economic competition from abroad. The petite bourgeoisie (which includes the farmers) combines low education and strong authoritarianism with higher income and more right-wing economic views than the workers (see Kitschelt 1994: 27). The LS parties are believed to occupy an extreme left-libertarian position in Kitschelt’s framework, i.e. be libertarian on issues like crime, sexuality and immigration, while favouring redistribution or at the very least a large public sector. Thus, the following hypotheses may be extracted: Hypothesis 3.1.1: The petite bourgeoisie is least likely to vote Left Socialist Hypothesis 3.1.2: Unskilled manual workers are more likely to vote Left Socialist than the petite bourgeoisie, but less so than the other classes Hypothesis 3.1.3: Skilled manual workers are more likely to vote Left Socialist than the unskilled ones, but less likely than the non-manual employees If these hypotheses turn out to be true, the idea that we need a more nuanced party choice variable is strengthened, as they imply that workers disproportionally rarely vote for this party family, which would be considered “Left” when using the dichotomous dependent variable. This could partly explain why traditional and overall left-right class voting seem to be declining. The service classes in many ways occupy the other extreme of the petite bourgeoisie when it comes to the value axis. Highly educated, skilled and seldom facing economic competition from immigrants, the service classes are likely to be libertarian. This is in line with Inglehart’s (1990) argument that in modern society, the affluent are less occupied with material questions, and more with post-materialistic issues – which overlap to a certain degree with what Kitschelt terms “libertarian” values (Achterberg 2006: 240). However, the group is divided when it comes to the economic axis. Whereas some scholars, like John Goldthorpe 28
(1982), claim that the service classes will be conservative, others have claimed that they are more fragmented (see Knutsen 1995: 181; 2006: 6-7). Assuming that the service classes are the most libertarian along the value axis and fragmented along the economic axis, we hypothesize that: Hypothesis 3.1.4: The service classes will be most likely to vote Left Socialist. 3.1.2 The Class Basis of the Socialist Left in Western Europe Table 3.1 shows the percentage of the respondents in the EVS data that said they would vote for the Left Socialist party in their national elections, by country and class. The calculated kappa value for each party is observed in the column to the right. Table 3.1: Support for the Left Socialist parties in percent, according to class Hi serv.
Lo serv.
Rout nman.
Petite bourg.
Skilled work.
Unskilled work.
Total
Kappa
Denmark
14
24
32
4
15
20
21
0.77
Finland
3
3
7
5
15
13
6
0.73
Iceland
13
25
25
19
11
20
20
0.37
Norway
10
7
7
3
0
6
7
-
Sweden
4
8
8
4
9
8
8
0.38
Ireland
3
5
9
4
18
17
10
0.73
Germany
12
11
9
6
14
12
11
0.30
Luxembourg
2
4
1
0
1
1
2
-
Netherlands
10
11
16
1
12
16
12
1.00
France
4
6
5
5
11
8
6
0.38
Greece
15
21
8
5
9
10
10
0.53
Italy
5
2
4
4
4
1
3
0.64
Portugal
11
17
9
3
5
2
7
0.83
Spain
17
14
8
3
10
7
9
0.56
Mean
9
11
11
5
10
10
9
14
Hypothesis 3.1.1 is generally confirmed. The petite bourgeoisie is least likely to vote LS in most countries, although there are some exceptions. The Vasemmistoliitto (LWA, Left-Wing Alliance) in Finland is even less popular amongst the service class, which is normally the most eager supporter of this party family. The LWA was formerly a Communist party. Although it has taken sincere steps in a post-materialist direction, it still has retained some of 14
The countries are sorted first by region, then alphabetically within the regions. This is done to facilitate regional comparisons.
29
its Old Politics profile, and it takes time to change the electoral base. In addition, the Green party in Finland has been dominant on New Politics issues, decreasing the political space for a whole-hearted New Politics turn for the LWA (Ziliacus 2001). In Iceland both the skilled workers and the higher service class are less prone to support the VG than the petite bourgeoisie. In Portugal the unskilled workers are – barely – less likely to vote for the Bloco de Esquerda (Left Bloc) than the petite bourgeoisie. This might also be due to issues of political space. The Portuguese party system includes both a sizeable Communist Party and a Social Democratic party which are both popular with the workers (see table 3.3). Given that hypothesis 3.1.1 is generally supported, the first part of hypothesis 3.1.2 is also, per definition, generally supported. In most countries the Socialist Left is less popular with the petite bourgeoisie than with the unskilled workers. However, the unskilled manual workers are in general not the second least prone to vote Socialist Left. The higher service class votes less for the Left Socialists than the unskilled workers do. For the skilled workers, the picture is mixed. In most Nordic and Western Central European countries, they are less likely to vote Left Socialist than the unskilled ones, contrary to hypothesis 3.1.2 and 3.1.3. In all Southern European countries except Greece, the voting pattern is in line with hypothesis 3.1.2. Contrary to the second part of hypothesis 3.1.3, the routine non-manual employees also show a mixed picture. In the Nordic countries they vote similar to or more in favour of the Left Socialists than the skilled workers. In the Central West, the pattern is the opposite. In the South, the picture is mixed. Hypothesis 3.1.3 is thus not generally confirmed. The lower service class is the class that is most inclined to vote for the Left Socialist parties only in a few countries, contrary to hypothesis 3.1.4. However, the lower service class is consistently amongst the most ardent supporters of the Left Socialist party family. This could reduce traditional or overall left-right class voting, but not total class voting. The higher service class is divided. In some countries, they are most likely to vote LS, such as in Spain and Norway. In France and Sweden, they are least likely to vote LS. We also notice that there are considerable cross-national variations in the strength of class voting for the Socialist Left. We see that total LS class voting is particularly strong in Denmark, Finland, the Netherlands, Italy and Portugal, and particularly weak in Germany, Iceland, Sweden, and France. Greece and Spain are in intermediate positions. 30
3.2 The Green Parties The Green parties were created in response to materialism and as a protest against the growthorientation of society (von Beyme 1985: 24). Their main concern is, obviously, the protection of the environment, but their agenda usually also contain other elements of post-materialism, such as an emphasis on participation, democracy, the right to privacy, women’s rights, and so on (von Beyme 1985: 130-131). The Global Greens, an organization with 91 Green parties as members across the globe, includes these themes in its 2012 Charter (GlobalGreens 2012). 3.2.1 Hypotheses Green parties are part of the same New Politics category as the Left Socialist parties. In fact they could be seen as even more extreme “post-materialists” than the Left Socialists, as many of them share the view that material politics are no longer of fundamental importance, whereas the Left Socialists often emphasize their socialist views along the economic axis. Indeed, this has led observers such as von Beyme (1985: 131) to note that these parties do not seem to have any common class basis. He is sceptical of the claim that the new middle class will form the social basis of the Green parties. This is partly because he finds that it is difficult to position these parties along the economic axis, and that there is considerable cross-national variation in these parties orientations’ along this axis (von Beyme 1985: 132). He also notes that these parties have a tendency to gather some protest votes, blurring the social basis even more. Dolezal (2010: 536) claims that cleavages have not been seen as relevant for Green parties and that their “very existence has also been interpreted as an indicator of the overall decline of cleavage politics per se”, although he strongly contends this. We suspect that the new middle class will be somewhat more likely to vote Green than other classes. This includes the upper service class. High education gives them a certain postmaterialist value basis15, and since the Green parties are not necessarily socialist on the economic axis like the Left Socialists, the high income of the higher service class perhaps does not affect the Green vote. We develop the following hypotheses: Hypothesis 3.2.1: There will be no large differences between the classes.
15
Although here we would benefit from the use of Oesch’s (2006) class schema to differentiate between groups within the service classes (see Dolezal 2010: 537-538).
31
Hypothesis 3.2.2: We expect the service classes (both higher and lower) to vote somewhat more in favour of the Greens than the other classes. 3.2.2 The Class Basis of Green Parties in Western Europe Table 3.2: Support for Green parties in percent, according to class Hi serv.
Lo serv. Rout nman.
Petite bourg.
Skilled work.
Unskilled work.
Total
Kappa
Finland
18
21
18
3
5
15
16
0.78
Sweden
7
12
13
7
1
7
10
0.80
Ireland
3
10
7
0
1
2
5
-
UK
7
10
9
10
5
10
9
0.25
Austria
21
18
17
5
9
7
14
0.63
Belgium
14
20
18
9
6
6
13
0.55
Germany
12
15
13
9
9
6
11
0.35
Luxembourg
14
22
18
14
11
12
16
0.29
Netherlands
5
10
3
5
2
4
6
0.54
Switzerland
14
19
15
0
11
5
14
-
France
9
13
11
5
10
10
10
0.34
Italy
2
3
3
0
1
2
2
-
Mean
11
14
12
6
6
7
10
Hypothesis 3.2.1 receives no support from the data. Even in the UK, the country with the smallest class differences, the Green party still has twice as much support amongst the lower service class (10%) as amongst the skilled workers (5%). Hypothesis 3.2.2 is supported, but needs some adjustment. The lower service class is in fact the most ardent supporters of the Green parties in ten of the twelve countries. This is in line with the findings of Dolezal (2010) in his analysis of 12 countries, although he utilizes a different class schema than ours. In Austria, this role is held by the higher service class, and in Sweden by the routine non-manual employees. The Green parties are thus clearly socially based in the service classes, notably the lower one. What we did not anticipate was that the routine non-manual employees would reveal themselves as the second most eager supporters of the Greens in eight of the twelve countries. The exceptions are the Netherlands, where the higher service class is second; Austria, where the lower service class is second; and of course Sweden where the routine non-manual employees are most Green of all the social classes. In addition, they are marginally below three other classes in the UK: 9% of the routine non-manual employees vote Green, whereas 10% of the lower service class, petite bourgeoisie, and unskilled workers do the same. 32
The higher service class is third most likely to vote Green in nine out of twelve countries. The exceptions are the UK (7%); Austria (where it is most prone to vote Green); and France where the skilled and unskilled workers vote approximately as Green as the higher service class, while the lower service class and routine non-manuals are even Greener. The conclusion, contrary to the claims of von Beyme (1985), is that Green parties are indeed class based parties. We also notice the cross-national differences in class voting for Green parties. It is especially high in Finland and Sweden (>.70), and low in the UK, Germany, Luxembourg, and France (1). This is due to the fact that this party has extremely low support amongst the petite bourgeoisie (around 2%), whereas it ranges from 10-40% in the other groups.18 Total SD class voting is also relatively high in Sweden, Belgium, the 17
Perhaps because they vote en masse for the Swiss radical right party, Schweizerische Volkspartei (see section 3.8.2) 18
The Finnish petite bourgeoisie generally votes for the Radical Right (29%), the Agrarian party (26%) and the Conservatives (24%).
36
Netherlands, and Portugal. It is low in Denmark, the UK, Austria, Germany, and Switzerland, and extremely low in Greece and Italy (0.16 and 0.10).
3.4 The Agrarian Parties The Agrarian parties were created in response to one of the two class cleavages, namely the conflict between producers and consumers in the commodity market. As mentioned, this cleavage has been integrated into existing parties in most Western European countries, but in all the Nordic countries independent Agrarian parties were established to protect the interests of the agrarian producers (Knutsen 2006: xi-xii). This was in part due to the fact that in these countries, there were important cultural barriers between rural and urban areas. This cultural conflict was added to the already bitter economic conflict, combining to make both conflicts worse (Lipset and Rokkan 1967: 44-46). 3.4.1 Hypotheses It is challenging to study the class basis of the Agrarian parties. First of all it is hard to distinguish the economic from the cultural conflict. Second, we would expect simply that the rural producers of agrarian products vote disproportionally in favour of these parties, while the urban consumers do not. In the EGP class schema, the producers would correspond to the farmers (here included in the petite bourgeoisie) and the agricultural workers (here part of the unskilled workers). The class schema was simplified this way to make possible the analysis of the other party families without getting too many empty cells. However, it distorts the analysis of the Agrarian parties. To remedy this, I have done the analyses also with the more extensive EGP class schema, but the results are merely commented on here, not analysed fully. Future research should focus on separate analysis of this party family with a suitable class schema. As the Agrarian parties are clearly representatives of the interests of a very particular group, namely the rural producers of agricultural products, we expect these to vote Agrarian. The industrial areas are often concentrated near or in the cities, and so are the workplaces related to higher education and finance. We thus expect the workers and middle classes to be mostly urban, with the exception of the unskilled workers, because they include the agricultural workers. In the countries with Agrarian parties, there are a total of 717 people in the “unskilled worker” category. Of these, about 10% are farm labourers. We derive the following hypotheses: 37
Hypothesis 3.4.1: The petite bourgeoisie is most likely to vote Agrarian Hypothesis 3.4.2: The unskilled workers will also vote somewhat more in favour of the Agrarian parties than the rest of the classes, except the petite bourgeoisie 3.4.2 The Class Basis of the Agrarian Parties Table 3.4: Support for the Agrarian parties in percent, according to class Hi serv.
Lo serv.
Rout nman.
Petite bourg.
Skilled work.
Unskilled work.
Total
Kappa
Denmark
35
27
24
59
27
24
30
0.53
Finland
10
14
12
39
5
14
14
0.72
Iceland
5
11
16
20
15
19
13
0.51
Norway
2
7
5
29
6
10
7
0.88
Sweden
5
4
2
15
3
4
4
0.66
Mean
11
12
12
32
11
14
14
Hypothesis 3.4.1 is strongly supported. The petite bourgeoisie is most likely to vote Agrarian in all countries, with a great margin everywhere but Iceland. This is mostly due to the farmers, although the Agrarian parties are popular also with the other parts of the petite bourgeoisie. When we separate the farmers from the petite bourgeoisie, we get the pattern in table 3.5. Table 3.5: Support for the Agrarian parties among petite bourgeoisie and farmers, in percent Petite bourg.
Farmers
Denmark
50
71
Finland
28
59
Iceland
20
26
Norway
13
60
Sweden
6
45
Mean
23
52
The largest difference between the two classes is in Sweden, where very few of the petite bourgeoisie vote for Centern (6%), whereas almost half the farmers vote for this party. Hypothesis 3.4.2 is supported by the data in Finland, Iceland, and Norway, where the unskilled workers are second most likely to vote Agrarian. In Sweden, they are about as likely as the other classes (4%) except the petite bourgeoisie which is about three times as likely to vote Agrarian (15%). In Denmark, 24% of the unskilled workers vote Agrarian, compared with 24-35% for the other classes. The Agrarian party family may thus contribute to reduce traditional and overall left-right class voting somewhat, at least in three countries, as the 38
unskilled workers vote slightly in favour of this party family which is normally considered as part of the “Right”. Total Agrarian class voting is especially strong in Norway, notably because of the large difference between the petite bourgeoisie (29%) and the other classes (2-10%). Total Agrarian class voting is also rather strong in Sweden, for the same reason (15% versus 2-5%), and Finland (39% vs 5-14%). It is moderate in Iceland, but rather weak in Denmark, in spite of the fact that an impressive six out of ten petty bourgeois vote Agrarian. This is because Venstre is rather popular in all classes, with support ranging from 24% amongst the unskilled workers to 35% amongst the higher service class.
3.5 The Liberal Parties The Liberal parties of today have their roots in the liberalism and radicalism of the 18th century, leading back to the conflict with the old regimes over the values of the French Revolution (von Beyme 1985: 31-35). Together with the Conservative parties, these were usually the earliest parties to form. 3.5.1 Hypotheses Liberalism is, and has always been, connected to the protection of the bourgeois concept of private property. At the same time, liberals have been engaged in the support of human and civil rights, pluralism and regionalism, education policy and social liberalism (von Beyme 1985: 36-39). Today, other post-materialist values such as environmental protection and personal privacy have become important for liberal parties. We position the Liberal party family as a right-libertarian party family – right-leaning on the economic axis, libertarian on the cultural axis. Von Beyme (1985: 44-45) discussed the loss of middle class monopoly and the erosion of the Liberals’ social basis due to the decline of the old middle class, but he predicted (rather correctly; see the next subsection) that the new middle class gradually would replace the old as the social basis of the Liberal parties. Due to the new focus on some post-materialist issues, it could be that the service classes will vote disproportionally in favour of the Liberals. In addition, Knutsen (2006: 54) identifies the Liberal party family as the strongest defender of the capitalists in the conflict between labour and capital. We hypothesize the opposite pattern of the Social Democrats: the more the class is tied to capitalist economic interests, the more popular the Liberals will be with the class (see section 3.3.1 for a discussion of how the class interests were derived). 39
Hypothesis 3.5.1: The classes will vote in the following rank (from highest to lowest probability of voting Liberal): 1) petite bourgeoisie; 2) higher service class; 3) lower service class; 4) routine non-manual employees; 5) skilled workers; 6) unskilled workers. 3.5.2 The Class Basis of the Liberal Parties in Western Europe Table 3.6: Support for the Liberal parties in percent, according to class Hi serv.
Lo serv.
Rout nman.
Petite bourg.
Skilled work.
Unskilled work.
Total
Kappa
Denmark
11
11
5
1
5
1
7
0.96
Norway
9
7
6
1
4
3
6
0.64
Sweden
17
11
7
4
3
2
9
0.83
UK
22
15
13
5
16
12
15
0.52
Austria
5
7
5
0
0
1
4
-
Belgium
26
15
18
34
12
11
17
0.51
Germany
14
14
8
20
8
5
10
0.52
Luxembourg
26
15
15
22
22
22
19
0.26
Netherlands
22
15
12
26
18
5
16
0.58
Switzerland
25
20
19
19
9
12
19
0.43
France
16
18
16
20
12
6
15
0.46
Portugal
25
22
31
27
27
40
31
0.27
Mean
18
14
13
15
11
10
14
The hypothesis is generally confirmed, with one exception. Comparing the total mean, we see that the higher service class is even more supportive of the Liberals than the petite bourgeoisie (18% vs 15%). This is true in seven of the twelve countries, whereas the classes are more equal in the remaining five. This is partly due to the fact that the farmers, who are economically right-wing and culturally authoritarian, are not particularly prone to vote Liberal (this was confirmed by analysing the class basis with farmers separated from the petite bourgeoisie). The other classes are in general ranked as hypothesised. Breaking it down by country, the Liberals are most popular within the higher service class or the petite bourgeoisie in all countries except Austria and Portugal. The lower service class is most prone to vote for the Austrian Liberales Forum, whereas it is surprisingly the unskilled workers who vote most for the Partido Social Democrata. This is, however, a somewhat special version of a Liberal party, which its name also suggests. Note also that in the UK and in Norway, the petite bourgeoisie is least likely to vote Liberal. 40
The unskilled workers act as hypothesised in 7 out of 12 countries, and in three of the remaining five countries they are the second least likely to vote Liberal. In the UK and Norway, this is due to the aforementioned voting of the petite bourgeoisie. In Luxembourg, both the lower service class and the routine non-manual employees are less likely to vote Liberal than the unskilled workers. In Switzerland, the skilled workers have a lower log odds ratio than the unskilled ones. The last country is Portugal. The skilled workers are less prone to vote Liberal than the unskilled in all countries except Luxembourg (equal proportions), Switzerland, and Portugal. They are less likely to vote Liberal than the rest of the classes in all countries except Norway and the UK (as mentioned), the Netherlands and Portugal. In the Netherlands, both the lower service class and the routine non-manual employees are less likely to vote Liberal than the skilled workers. Total Liberal class voting is by far most widespread in the Nordic countries. This is because the petite bourgeoisie and the unskilled workers almost never vote for this party family (14%), whereas the service classes often do (7-17%). Total Liberal class voting is very low in Portugal and Luxembourg, while it is at a moderate level for the rest of the Liberal parties.
3.6 The Christian Democratic Parties Religious parties were often formed as a part of the counter-reaction to Liberal or secular legislation in the 19th century, especially related to education. However, they did not turn into mass parties until after the Second World War. Today, they vary from the Protestant parties in Scandinavia to the Catholic ones in Belgium and Austria (von Beyme 1985: 81-85). 3.6.1 Hypotheses The Christian Democratic parties see themselves as somewhat outside the two political axes, and they are generally against the class war. Compared to the pre-war religious parties, the Christian Democratic parties established after the Second World War were cross-confessional, i.e. no longer strictly Catholic, and thus increased their cross-class appeal. They also incorporated a number of central, shared values in the time after the war, like support for human rights, anti-communism, and democracy. In addition, they want to even out the differences between the social classes: “More than other parties, the Christian Democrats stress that they are catch-all parties” (von Beyme 1985: 93). Kalyvas and van Kersbergen (2010: 187) explain that the need to incorporate diverse class interests within the parties also
41
created a successful appeal across classes and sectors outside the parties, and that the CD parties have emphasized religion at the expense of class. Knutsen (2006: 55-56) also emphasizes their cross-class appeal, although he suggests that they may enjoy more support in the rural parts of the population due to their more conservative stances in several cultural issues, and because the rural population usually is more religious than the urban. This is mostly relevant to the petite bourgeoisie (which includes farmers) and the unskilled workers (which include agricultural workers). Hypothesis 3.6.1: We expect no great differences between the classes. Hypothesis 3.6.2: The petite bourgeoisie and the unskilled workers will be somewhat more prone to vote Christian Democratic than the other classes. 3.6.2 The Class Basis of Christian Democratic parties Table 3.7: Support for the Christian Democratic parties in percent, according to class Hi serv.
Lo serv.
Rout Petite Skilled nman. bourg. work.
Unskilled work.
Total
Kappa
Finland
3
3
3
0
0
1
2
-
Norway
4
5
12
1
4
3
6
0.69
Sweden
4
6
2
2
0
6
4
-
Ireland
24
27
25
32
22
14
23
0.33
Austria
31
23
20
42
18
22
24
0.40
Belgium
22
27
24
30
25
23
25
0.14
Germany
41
37
39
43
39
38
39
0.09
Luxembourg
28
30
29
42
13
23
27
0.48
Netherlands
21
17
21
34
16
28
21
0.34
Switzerland
15
10
14
17
10
15
13
0.34
Italy
13
11
12
8
9
7
10
0.24
Mean
19
18
18
23
14
16
18
As we see, hypothesis 3.6.1 is supported by the data. The CDU/CSU in Germany is the most extreme case of a cross-class Christian Democratic party: Its support ranges from 37% in the lower service class to 43% in the petite bourgeoisie, and the kappa value is merely 0.09. There are no large differences between the classes, as indicated by the low kappa values. The only notable exception is the Norwegian Kristelig Folkeparti (KrF) with its kappa of 0.66. This is due to the routine non-manuals voting disproportionally in favour of the KrF (12%), at the same time that the petite bourgeoisie does not vote for the KrF (1%). The other classes vary from 3-5%. 42
In Luxembourg, the Chrëschtlech Sozial Vollekspartei also has a somewhat higher kappa value than the others, namely 0.36. This is mainly caused by the great support amongst the petite bourgeoisie (42%) and the low support amongst the skilled workers (13%). The other classes vary from 23-30%. Hypothesis 3.6.2 also gets some support, but only for a limited area. The petite bourgeoisie is the most likely to vote Christian Democratic in all countries in Central Western Europe (which counts six out of ten relevant countries). In the Nordic countries, however, it is amongst the rarest supporters of Christian Democracy – perhaps because the Nordic countries have Agrarian parties, which the farmers largely flock to. This idea is strengthened by the fact that when analysing farmers separately from the petite bourgeoisie, the Christian Democratic support amongst the petite bourgeoisie falls drastically in Central Western Europe, but not in the Nordic countries.19 The low petite bourgeoisie support for CD parties in the Nordic countries could also be due to the fact that these parties are more left-wing than their Continental counterparts (Kalyvas and van Kersbergen 2010: 188). The hypothesis does not seem to hold when it comes to the unskilled workers.
3.7 The Conservative parties Conservative parties were amongst the first to develop, usually as a defensive response to Liberal parties. Although they have gone through considerable ideological changes, they still share scepticism to rapid change and faith in traditional values. What have changed, however, are their economic policies – these have become more or less neoliberal since the 1970s. We may thus describe these parties as right-authoritarian in general, which is also what Kitschelt (1994; 1995) suggests. 3.7.1 Hypotheses The shift in economic policy is partly due to the changing class basis of the Conservative parties. While originally existing for the nobility and clergy, they have become increasingly popular amongst the upper middle classes and even in some parts of the working class (von Beyme 1985: 46-51). However, with the strong emphasis on neoliberalism as some of the old Liberal parties moved towards social-liberal positions, we expect the Conservatives to be “the parties for the bourgeoisie and the upper-middle class” (Knutsen 2006: 55; see also von 19
In fact, between 26 (Iceland) and 71 (Denmark) percent of the farmers in our sample vote Agrarian in the Nordic countries, and only 0-4% vote Christian Democratic. On the other hand, around 70% of the farmers in all Central Western European countries vote Christian Democratic (except in Switzerland, where only 17% do so).
43
Beyme 1985: 50-52), and inversely, the nemesis of the working class – along the economic axis. Given the former discussion of the economic interests of the classes, this also implies that the petite bourgeoisie may vote disproportionally in favour of this party family. The value axis, however, complicates the picture. First of all, there is some considerable variation between the parties in this regard (the Norwegian Conservatives, for instance, describe themselves as both conservative and liberal, see Høyre 2014). Also, whether workers will vote for this party family or not, given that they share their somewhat authoritarian outlook but not their economic policies, depends on whether the economic axis or the value axis is most important. Here, we will assume that Old Politics are still more important than New Politics for Conservative voting, and thus that the workers will not vote Conservative. The petite bourgeoisie, sharing both the economic and value outlook of the Conservatives, will vote disproportionally in favour of this party family. Hypothesis 3.7.1: The higher service class and the petite bourgeoisie will be most likely to vote Conservative Hypothesis 3.7.2: The workers (of all sorts) will be least likely to vote Conservative Hypothesis 3.7.3: The lower service class will be in a middle position between the workers on the one hand and the higher service class and the petite bourgeoisie on the other 3.7.2 The Class Basis of Conservative Parties Table 3.8: Support for Conservative parties in percent, according to class Hi serv.
Rout Lo serv. nman.
Petite bourg.
Skilled work.
Unskilled work.
Total
Kappa
Denmark
15
7
5
16
6
4
8
0.60
Finland
45
35
21
24
11
8
29
0.76
Iceland
39
26
29
37
21
27
30
0.31
Norway
29
24
12
15
11
5
18
0.67
Sweden
43
35
20
46
17
11
28
0.71
Ireland
47
31
41
34
41
45
40
0.23
UK
47
43
36
38
36
22
38
0.37
France
34
22
18
41
16
14
22
0.54
Greece
30
22
26
38
35
27
31
0.27
Italy
27
21
19
31
26
32
26
0.25
Portugal
18
0
4
6
0
0
2
-
Spain
46
31
27
42
31
22
30
0.37
Mean
35
25
22
31
21
18
25
44
Hypothesis 3.7.1 is supported. It holds in seven out of 12 countries. The exceptions are Finland, Norway, and the UK, where the lower service class is more likely to vote Conservative than the petite bourgeoisie. In addition, the unskilled workers are about as prone to vote Il Popolo della Libertà as the petite bourgeoisie is. Ireland is, as usual, different from the other countries. Here the Conservative party is least popular amongst the lower service class and the petite bourgeoisie. Hypothesis 3.7.2 is also strongly supported. In seven out of 12 countries, the unskilled, skilled, and routine non manual employees are less likely than the other classes to vote Conservative. In Iceland, Greece, and Portugal, the lower service class is least likely to vote Conservative. In Italy, Il Popolo della Libertà (PdL), a somewhat untypical Conservative group, is actually relatively popular with both the skilled and unskilled workers. Hypothesis 3.7.3 receives much less support. The lower service class does only take this middle position in Denmark, Sweden, France, and Spain. Total Conservative class voting is especially important in the Nordic countries (except Iceland), and to some degree in France. It is lower in the other countries, especially in Ireland with a kappa value of only 0.14.
3.8 The Radical Right Parties The Radical Right party family (from now on: RR) is perhaps the most studied party family, which explains why this subsection is somewhat longer and more theoretically sophisticated than the others. The RR is one of the main reasons as to why we need to stop measuring party choice as left versus right. As Rydgren (2013: 1-3) writes, the RR has started changing its economic policy from neo-liberal to centre or even leftist policies, but the main reason that workers vote for the RR is that they agree with its socio-cultural rightist policies – i.e. its stances in questions such as immigration and authoritarianism (see Kitschelt 2013). 3.8.1 Hypotheses The RR is often labelled the “new worker parties”. In the literature we find several theoretical arguments of why this is so. One kind of explanation is economic. Workers tend to be the “losers” (economically speaking) of modernization and globalization due to both increased economic competition domestically from immigrants (over jobs and social services), and due to increased competition internationally from countries with lower labour costs. Thus they
45
tend to vote in favour of parties which are against both immigration and globalization – i.e. the RR (see Betz and Meret 2013: 109-111; Oskarson and Demker 2013: 175; Oesch 2008). A second kind of explanation is cultural. Due to low education, workers are claimed to lack the cognitive development necessary to prevent generalizations and scapegoating; to lack the teaching of communicative interaction skills and the socialization of specific norms related to avoiding prejudices, and so on. Hence they are more prone to have authoritarian values and to feel threatened by foreign cultures, and thus vote for anti-immigrant and authoritarian parties like the RR (Ivarsflaten and Stubager 2013: 126, 131; Coffé 2013: 138; Oesch 2008). This should also mean that unskilled workers are even more likely than skilled workers to vote for the RR, as they have lower education and are more directly exposed to the economic competition of immigrants. Based on these theoretical arguments, we deduce the following hypotheses: Hypothesis 3.8.1: Workers will vote disproportionally in favour of the RR Hypothesis 3.8.2: Unskilled workers will vote more in favour of the RR than skilled workers Based on the theoretical arguments above, we may infer that the highly educated or high income groups will show the opposite tendency. The middle classes are winners of globalization – especially the sociocultural specialists – and thus not likely to vote for the RR (Bornschier and Kriesi 2013: 17). Hypothesis 3.8.3: The RR will be least popular amongst the service classes. According to Kitschelt (2013: 230-232), there is no reason to distinguish between manual and non-manual labour, as these groups are performing analytically similar tasks. It has also been noted that the routine non-manual employees are similar to manual workers in their low salary, absence of career structure, low workplace autonomy, and so on (Evans 2005). Thus one might think that they will vote like the manual workers. However, they are less exposed to competition from immigrants and/or economic competition from developing countries. This goes in particular for the ones employed in the public sector. We therefore hypothesise a middle position for the routine non-manual employees. Hypothesis 3.8.4: The routine non-manual employees will vote more in favour of the RR than the service classes, but less so than the workers. The small business owners are also somewhere in between: They are characterized by a lack of education, but they are not bad off in terms of income and they have a certain preference 46
for laissez-faire economic policies, and thus face no trade-offs in voting for the radical right (unless it keeps moving to the left in economic questions). Bornschier and Kriesi (2013: 17) predict that many potential supporters of the RR are to be found within this class. Farmers, with their typically low education and rural conservatism in matters of culture and values, may also be supporters of this party family (Kitschelt 1994: 26). Thus: Hypothesis 3.8.5: The petite bourgeoisie will vote more in favour of the RR than the service classes, but less so than the working classes. 3.8.2 The Class Basis of the Radical Right in Western Europe Table 3.9: Support for the Radical Right parties in percent, according to class Hi serv.
Lo serv.
Rout Petit Skilled Unskilled nman. bourg. work. work. Total Kappa
Denmark
4
4
8
8
18
20
9
0.69
Finland
5
6
12
23
18
19
11
0.64
Norway
17
19
20
33
40
24
22
0.42
Austria
12
26
21
23
30
16
21
0.39
Belgium
4
3
8
6
12
9
6
0.50
Germany
1
1
2
0
6
6
3
-
Luxembourg
2
2
5
8
5
4
4
0.61
Netherlands
4
2
3
3
7
3
3
0.35
Switzerland
17
15
24
33
39
31
22
0.46
France
1
2
2
3
2
8
3
0.78
Greece
1
5
4
3
7
8
4
0.66
Italy
6
1
0
7
0
0
2
-
Mean
6
7
9
12
15
12
9
In general, hypotheses 3.8.1, 3.8.3, 3.8.4 and in 3.8.5 receive support from the data, whereas 3.8.2 does not. The workers vote disproportionally in favour of the RR – in fact, the skilled workers are the most eager supporters of these parties. Thus the second hypothesis does not receive support – the unskilled workers only vote more in favour of the RR than the skilled ones in Denmark, Finland, and France. Unsurprisingly, the service classes are the least eager supporter of the RR. This holds true in all countries except the Netherlands, where the party is tiny (3 %). As we see, the RR is second most popular amongst the petite bourgeoisie, and is basically at the level of the workers – in other words, even more prone to voting RR than hypothesised. In sum, we see important differences between the classes in their propensity to vote for Radical Right parties. Interestingly, these differences seem to have the same base in most 47
countries. For instance, the RR is least popular in the service class everywhere but Italy; usually with the higher service class being most reluctant to vote for them. The working class and the petite bourgeoisie together form the core electorate of the radical right in all countries except Germany, France and Italy. The electorates of the three German RR parties and the French Front National are comprised almost solely of workers. The Italian RR is based on a surprising alliance between the petite bourgeoisie and the higher service class. Total Radical Right class voting is especially important in Denmark, Finland, Luxembourg and France. It is least important in Norway, Austria, and the Netherlands. A main point to take from this subchapter is that the West European Radical Right is clearly a class-based party family, with the petite bourgeoisie and the workers as its core electorate. As this differs from the other categories of non-socialist party families, the fourth generation party choice variable seems to be needed for a more nuanced understanding of class voting.
3.9 Conclusion: How strong is the class basis? The kappa measure introduced in section 2.3.1 has been used throughout this chapter to measure how strong class voting is for each party – how much the classes vary in their voting. In this subsection, we will comment on the fuller picture by showing the difference in class voting by party family instead of showing the difference in class voting by national parties within a party family. In table 3.10, two measures are included. First, the mean of the kappa values for each individual party within a party family. This tells us how strong total party family specific class voting is, as a whole. Second, we show a kappa value calculated with the mean total support for the party family in each class. This indicates to what degree the party family specific class basis is the same in all countries. That explains why the latter is consistently lower than the former. Imagine, for instance, a hypothetical party family with only two parties, which are both highly class based. Party A has strong support in the service classes and amongst the routine non-manual employees and party B has an equally strong support in the working classes and the petite bourgeoisie. In this case, both parties would have a high kappa value, yielding a high mean of the two kappas. However, the mean support of the party family would yield a lower kappa value, as this party family could now seem to be approximately equally supported by all classes.
48
We believe that the parties that were created as part of the two class cleavages will have a stronger class basis than the other parties – i.e. the Agrarian parties, the Social Democrats, and the Liberals. Parties based on cleavages that cross the class cleavage, like the Christian Democrats, are expected to show the weakest class voting. The results should ideally be compared to former studies, but as this is amongst the first comparative analyses of total party family specific class voting ever undertaken, there is not much to compare to. Knutsen (2006:66-68) analysed total party family specific class voting with the mean kappa value as a measure. However, his analysis used a somewhat different class schema, was longitudinal (covering the time period 1975-1997), and included only eight of the eighteen countries studied here. It is thus not evident that the results are comparable. At the very least, it means that where our findings diverge from his, there are at least three possible interpretations. First, that the total party family specific class voting was different in 2008 and in the period 1975-1997; second, that it was different in the ten countries not included in Knutsen’s analysis; and third, that it is different due to the use of somewhat different class schemas. Knutsen (2006: 67) found that the old class parties, i.e. the Communists, Social Democrats, and the Liberals, were most firmly anchored in social classes. He found that the New Politics parties (the Green, the LS, and the RR) were class based, but to a much lower degree than the old class parties. He also found that the Christian Democrats were not very class based. Table 3.10 displays the results from our own analysis. [Table 3.10 here] As hypothesised, the Christian Democrats contribute least to class voting, independent of what kappa measure we are considering. This is in line with Knutsen’s (2006: 67) results. It is more surprising that the Social Democrats and the Conservatives appear to be comparatively little class based – especially the Social Democrats were believed to have a strong class basis. Only the Christian Democrats have a lower mean kappa value than these two, whereas only the Christian Democrats and the Liberals have a lower kappa based on mean support.
49
Table 3.10: Kappa values for each party family20, ranked by mean of kappas (high to low) Party Family
Mean of kappas
Kappa based on mean support
Agrarians
0.66
0.47
Left Socialists
0.60
0.31
Radical Right
0.55
0.36
Liberals
0.54
0.22
Greens
0.50
0.39
Social Democrats
0.49
0.32
Conservatives
0.46
0.31
Christian Democrats
0.33
0.18
The Agrarian parties, representing the producer pole of the agrarian class cleavage, are in the top, as expected. This is true for both kappa measures. The Liberals are almost as class based as the Radical Right, based on the mean of the kappa values – in line with both our theoretical expectations and Knutsen’s (2006) empirical findings. However, their kappa based on mean support is less than half of the first measure – only 0.22. The only party family with a lower kappa based on mean support are the Christian Democrats. This means that the Liberal parties do have a firm anchoring in social classes, but in different social classes in different countries. Even with the mean of the kappa values, the Liberal parties are just slightly more class based than the Greens. This post-materialist party family, deemed to have no particular class basis (von Beyme 1985: 131), appears to be quite class based indeed. In fact, the Green party family has the second highest kappa based on mean support, meaning that these parties have one of the most consistent class bases in all countries. While not in line with our theoretical expectations or the findings of Knutsen, this is in line with Dolezal’s (2010) empirical findings. It is especially interesting to note the top three, and compare this result to the following statement: “The rise of the New Left in the 1980s and the Radical Right in the 1990s has been widely interpreted as the demise of class politics” (Oesch 2013: 31). Oesch was right to
20
Parties with empty cells are excluded from the calculation, as no kappa value could be obtained. These are limited to the Left Socialists in Norway and Luxembourg; the Greens in Ireland, Switzerland, and Italy; the Liberals in Austria; the Christian Democrats in Finland and Sweden; the Conservatives in Portugal; and the Radical Right in Germany and Italy.
50
contend this view. Although the Left Socialist parties have different class bases in different countries, as is noticeable when comparing the mean of the kappas to the kappa based on mean support, the Left Socialist and the Radical Right are both amongst the party families that contribute most to class voting as measured by the mean of the kappas. As we saw in section 3.1.2 and 3.8.2, this is partly due to workers voting disproportionally for the Radical Right and “against” the Left Socialist parties; and due to the service classes voting the opposite way. We want to underline that this reduces traditional and overall left-right class voting, but not total class voting, which is the most valid measure. The need for fourth generation class voting studies is obvious.
51
Chapter 4: Class Voting and Value Orientations Like the previous chapter, this chapter is divided into subchapters for the party families. Although chapter 2 gave a thorough summary of what we will do in this chapter, a brief reminder is called for. For each subchapter, we will first show the bivariate relationship between social class and party family specific voting (model 1). This will show us whether the classes vote significantly different from each other – recall that no significance tests were performed in chapter 3. All the social classes will be compared to the unskilled workers, who are chosen as the reference group. We will calculate a gross kappa value based on the coefficients of the social classes, i.e. the log odds ratios (cf. chapter 2). We will also visualize the results by plotting the predicted probabilities of voting for the party family for each class. We will then attempt to learn more about how class and voting are related and how this relationship varies between party families. We will control for the value orientations discussed in chapter 2 and see how this changes the coefficients of the classes (and thus the kappa value); in other words, how this affects the party family specific class voting (models 2-6). We remind the reader that the value orientations are centered around their mean. Hence the intercept is interpreted as the log odds of an unskilled worker with a mean value on the relevant value orientation voting for the specific party family. Finally, we will control for all the value orientations at the same time (model 7). We can then calculate kappa values based on the coefficients and see how they change for each model. This will give us a measure of how much total party family specific class voting the value orientations account for. In other words, the more the kappa value is reduced, the more of the differences between the classes are accounted for by the five value dimensions – although, as specified in chapter 2, there is not a linear relationship between reductions in total party family specific class voting and reductions in class differences. The results will be evaluated relative to some hypotheses we develop in each subchapter. These will generally be based on the theoretical parts of chapter 3. Some models will be visualized by plotting the predicted probabilities, which will be compared to the plot of the first model. The choice of which models to visualize is made by considering the relevance of the model to the developed hypotheses. 52
4.1 Value orientations and Left Socialist class voting In section 3.1 we labelled the Left Socialist parties as post-materialistic. Our hypotheses were based in part on assuming how the classes related to issues like the environment, immigration, and libertarianism. LS parties have a clear New Politics profile, related to environmental protection; ecological concern; promotion of minority rights and feminism; promotion of libertarian values, and so on (Zilliacus 2001: 34). Kitschelt described these parties as extreme libertarians along the value axis. There is thus reason to believe that New Politics values, related to immigration, libertarianism, and environmental protection, will be more important in accounting for class differences than Old Politics values. As these parties are especially regarded to be libertarian (see for instance Knutsen 1995: 163, Zilliacus 2001: 34), we believe that this value orientation will account for most class voting of the ones regarded here. We develop the following hypotheses: Hypothesis 4.1.1: The New Politics value orientations will be more important in accounting for total LS class voting than the Old Politics value dimensions. Hypothesis 4.1.2: The libertarian-authoritarian value orientation will be most important in this regard. The results from the analysis of LS voting are shown in table 4.1. Model 1 shows the bivariate relationship between class and LS voting. We note that the petite bourgeoisie is significantly different (at the 1%-level) from the unskilled workers, as expected. There is no difference between the skilled and unskilled workers. The other differences are not significant at any reasonable level. Figure 4.1 visualizes these results by plotting the predicted probabilities of voting LS for each class. The figure reveals the small differences between the classes, with the petite bourgeoisie differing somewhat from the rest.21 While this may be surprising given the high mean kappa value for this party family, it merely reflects the fact that the Left Socialists have somewhat different class bases in the different countries. For instance, the Irish Sinn Fein is highly popular with the working class, and unpopular with the service class, whereas the Spanish Izquierda Unida shows the opposite pattern. The results mimic those of the mean support for the party family in section 3.1, which for instance was 10% for both the skilled and unskilled workers.
21
Note that the y-scale goes from 0-0.1 in the figure, not to 1.
53
Table 4.1: Left Socialist voting and value orientations: Multilevel logistic regression Model 1
Model 2
Model 3
Model 4
Model 5
Higher service class
-0.19 (0.11)
0.15 (0.12)
-0.29 (0.11)
*
-0.22 (0.11)
-0.41 (0.11)
-0.39 (0.11)
-0.27 (0.12)
Lower service class
0.06 (0.10)
0.21 (0.10)
*
0.02 (0.10)
0.00 (0.10)
-0.15 (0.10)
-0.13 (0.10)
-0.12 (0.11)
Routine non-manual
0.10 (0.10)
0.21 (0.10)
*
0.13 (0.10)
0.06 (0.10)
-0.06 (0.10)
-0.00 (0.10)
0.05 (0.10)
Petite bourgeoisie
-0.81 (0.16)
-0.49 (0.16)
**
-0.79 (0.16)
-0.83 (0.16)
-0.84 (0.16)
-0.85 (0.16)
-0.52 (0.16)
Skilled workers
-0.00 (0.12)
0.06 (0.12)
-0.08 (0.12)
-0.02 (0.12)
-0.06 (0.12)
0.02 (0.12)
-0.02 (0.12)
Unskilled workers
0.00 (.)
0.00 (.)
0.00 (.)
0.00 (.)
0.00 (.)
0.00 (.)
0.00 (.)
***
***
***
***
***
Model 6 ***
***
***
Economic ideology
***
***
-0.12 (0.01) ***
Environmental values
***
0.20 (0.02)
0.14 (0.02) ***
Libertarianism
***
0.21 (0.02)
Immigration orientations
0.09 (0.02) ***
0.12 (0.02)
***
0.19 (0.02) ***
**
0.41 (0.02) -0.15 (0.01)
***
*
***
0.46 (0.02)
Religiosity
Model 7
***
***
***
***
***
Intercept
-2.37 (0.20)
-2.73 (0.23)
-2.42 (0.20)
-2.38 (0.21)
-2.33 (0.19)
-2.39 (0.21)
-2.69 (0.24)
Intercept variance N
0.479 (0.192) 12014
0.625 (0.247) 12014
0.485 (0.194) 12014
0.555 (0.221) 12014
0.406 (0.164) 12014
0.547 (0.218) 12014
0.671 (0.265) 12014
Standard errors in parentheses. * p < 0.05, ** p < 0.01, *** p < 0.001
We also note the country level residual variance of 0.479. This is the variance of the intercept, i.e. the variance of the log odds of voting Social Democratic for the unskilled workers. It is hard to interpret in and of itself as it is the variance of a log odds (LEMMA 2014a), but we will return to it when we compare models later. Table 4.2 portrays the kappa values based on the models in table 4.1. For models 2-7, the absolute and relative change from the kappa value from model 1 is shown. We see that the class coefficients from the bivariate model 1 yield a kappa value of 0.31. As expected, this is similar (in fact, it is identical) to the kappa based on mean support in section 3.9. 54
Figure 4.1: Predicted probability of voting Socialist Left, by class
Table 4.2: The kappa values from the Left Socialist voting models22 Kappa Absolute change Relative change 0.31 Model 1: Class only 0.16 -0.16 -50 % Model 2: Class and economic ideology 0.31 -0.01 -2 % Model 3: Class and religiosity 0.31 0.00 -1 % Model 4: Class and environmental values 0.29 -0.02 -6 % Model 5: Class and libertarianism 0.00 0% Model 6: Class and immigration orientations 0.31 0.20 -0.12 -37 % Model 7: Class and all value orientations
Model 2 controls for economic ideology. The more left-leaning voters are more likely to vote LS than the right-leaning voters. It is highly interesting to notice that the class coefficients have changed dramatically. Notably, table 4.1 shows that the coefficient of the petite bourgeoisie is halved. The kappa value is reduced by 50%, to 0.16, as we can see in table 4.2. This means that when controlling for economic ideology, only half of the total LS class voting remains. The difference between the unskilled workers on the one hand, and the lower service class and the routine non-manual employees on the other, has increased and is now significant.23 At the same time, the level 2 variance has increased to 0.625. This could for instance be due to the classes having different ideologies in different countries, and this could be correlated with the popularity of the LS parties in the mentioned countries. 24 It should, 22
Rounded to the second decimal, which is why some of the relative changes might not correspond perfectly to the absolute ones. 23
This is only the case in one of the four alternative specifications.
24
The variance increases in four of the five remaining models, although less dramatically. This will not be commented upon as the interpretation remains the same.
55
however, be duly noted that changes in level 2 variance must be interpreted with a solid dose of caution in multilevel logistic regression (see LEMMA 2014b). Therefore, such changes will be observed and sometimes commented upon, but not given much weight. Model 3 controls for religiosity, which is negatively associated with voting LS. The only class coefficient that undergoes noteworthy change is that of the higher service class, which is now significantly different from the unskilled workers.25 The kappa value remains almost the same. Model 4 controls for environmental values. Predictably, voters whom are more preoccupied with preserving the environment also vote more often for the LS parties, in line with New Politics theory. Contrary to hypothesis 4.1.1, however, controlling for environmental values does not account for any of the differences between the classes. No coefficients are substantially changed, and the kappa value thus remains the same. Model 5 controls for libertarianism, which as expected is positively related to voting LS. Otherwise it looks like model 3: Stable kappa values and no important change in coefficients except for the higher service class. This is highly surprising and contrary to both of our hypotheses. There is, however, a reduction of about 15% in the level 2 variance,26 indicating that the different distribution of libertarianism in the different countries may account for some of the between-country differences in LS voting. Model 6 controls for immigration orientations. Positive attitudes are connected to an increase in LS voting. Otherwise it is similar to model 3. Again this is contrary to hypothesis 4.1.1. Model 7 includes all the value orientations. There are no important changes in their coefficients other than that of libertarianism, which is halved. Compared to model 1, the difference between the petite bourgeoisie and the unskilled workers are reduced, whereas the difference between the higher service class and the unskilled workers increased. The kappa value is reduced by 37% percent, implying that direct LS class voting is 37% lower than total LS class voting. In other words, the value orientations account for 37% of the total LS class voting.
25
This is also only the case in one of the four alternative specifications.
26
This is calculated by subtracting the level 2 variance in the relevant model from the level 2 variance in the model only accounting for class (model 1), and dividing it by the level 2 variance in model 1 (0.479-0.406 /0.479 ≈ 0.152).
56
It may seem counter-intuitive that economic ideology alone (model 2, 50%) accounts for more total LS class voting than including all the value orientations at the same time (model 7, 37%). Here, controlling for economic ideology reduces the difference between the petite bourgeoisie and the unskilled workers at the same time that it is increasing the difference between the lower service class and the routine non-manual employees. Thus, these log odds ratios are closer to the mean of the coefficients, meaning that the kappa – the standard deviation of the coefficients – is heavily reduced. The last model, however, only reduces the difference between the petite bourgeoisie and the unskilled workers (there is no significant difference between the two other mentioned classes and the unskilled workers), reducing the kappa to a lesser extent. In sum, LS voting is class based, although the class basis differs between countries: In some countries, the LS parties are worker parties; in others, they are most popular with the service classes. This could be due to the profile and history of the party. To what degree have former Communist parties been able to successfully change into New Politics parties? It could also be connected to issues of political space. Some parties are facing competition over the worker vote by Social Democratic and/or Communist parties, while others are facing competition over the service class vote from Green parties. The value orientations account for about 37% of the total LS class voting, but surprisingly the most important value orientation was economic left-right views, connected to Old Politics. None of our hypotheses received support from the analysis. To visualize these findings, figure 4.2 and 4.3 plots the predicted probabilities of voting LS for each class given their, respectively, economic ideology and libertarianism (with all other variables held at their observed values).27 These are chosen to show the unexpected high importance of economic ideology and vice versa for libertarianism, compared to our hypotheses. Figure 4.2 shows that there are important variations in the differences between the classes at different levels of economic ideology, where the right-wing voters almost never vote LS regardless of class, whereas notably the petite bourgeoisie and the higher service class vote less LS than the other most left-oriented voters. Figure 4.3 shows, in contrast, that the difference between the classes is rather similar at all levels of libertarianism.
27
They were also plotted with all other variables held at their mean; this did not affect the plot much.
57
Figure 4.2 may give the impression of an interaction effect – it may seem like the effect of class is larger at more leftist economic views. There is, however, no interaction. The transformed variables increase linearly, but given the logarithmic transformation, this yields a non-linear increase in the predicted probabilities. Thus the higher the “original” predicted probability of voting LS for a class, the more it will increase as economic ideology becomes more leftist.
Figure 4.2: Predicted probability of voting LS by class and economic ideology
Figure 4.3: Predicted probability of voting LS by class and authoritarian-libertarian values
58
4.2 Value orientations and Green class voting In section 3.2, the Green parties were discussed as extreme post-materialists with environmental protection as their raison d’être (see also Dolezal 2010: 541). We expect the economic growth versus environmental protection value orientation to account for most class voting. Although we found that the Green parties did have a class basis in the service classes, we also emphasized that the Green parties sometimes deny the relevance of materialist issues altogether. Green leaders have often claimed that they are standing outside of the traditional political division between left and right (Dolezal 2010: 537). At the same time, they take a clear pro-immigration and pro-libertarian stance (Dolezal 2010: 542). In other words, there is reason to believe that there are other issues than the material ones that create the class differences in Green voting. We thus expect the value orientations connected to New Politics to be more important than the ones connected to Old Politics. We develop the following hypotheses: Hypothesis 4.2.1: The New Politics value orientations will be more important in accounting for total Green class voting than the Old Politics value dimensions. Hypothesis 4.2.2: The environmental value orientation will be most important (of the ones considered here) in accounting for total Green class voting The analysis of Green voting is displayed in table 4.3. Model 1 shows the bivariate relationship between class and Green voting. First, there are no significant differences between the petite bourgeoisie, the skilled workers and the unskilled workers. Second, we note that the higher service class, lower service class, and the routine non-manual employees do differ significantly from the unskilled workers. The ranking of the classes is similar to the one discovered in section 3.2. Table 4.4 displays the kappa values from the models. The kappa value from model 1 is 0.38. This is again, as expected, highly similar to the one displayed in section 3.9, namely 0.39. [Table 4.3 here] Model 2 controls for economic ideology. It is interesting to note that being leftist in economic ideology is positively related to voting Green. This is in contrast to the claims of scholars such as Talshir (2002: 12) that the question of economic redistribution or control over means of production does not matter at all for Green politics (see Dolezal 2010: 541). However, unlike the case for the Left Socialists, economic ideology seems to account for very little of the class 59
differences in Green voting. There is basically no change in the kappa value. The coefficients of the three classes that did differ from the unskilled workers are slightly increased, whereas that of the petite bourgeoisie is slightly reduced. Model 3 tells us that being religious is weakly, negatively associated with Green voting. Controlling for religiosity has practically no impact on the class coefficients or the kappa values. As such it is unimportant in explaining class differences, although it does account for some 13% of the between-country variance in Green voting. Table 4.3: Green voting and value orientations: Multilevel logistic regression Model 1
Model 2
Model 3
Model 4
Model 5
Model 6
Model 7
Higher service class
0.49 (0.13)
***
0.64 (0.13)
***
0.45 (0.13)
***
0.40 (0.13)
**
0.22 (0.13)
0.26 (0.13)
*
0.07 (0.13)
Lower service class
0.86 (0.11)
***
0.95 (0.11)
***
0.83 (0.11)
***
0.73 (0.11)
***
0.63 (0.11)
***
0.69 (0.11)
***
0.47 (0.12)
Routine non-manual
0.65 (0.12)
***
0.70 (0.12)
***
0.67 (0.12)
***
0.57 (0.12)
***
0.48 (0.12)
***
0.59 (0.12)
***
0.44 (0.12)
Petite bourgeoisie
-0.17 (0.19)
-0.01 (0.19)
-0.16 (0.19)
-0.21 (0.19)
-0.24 (0.19)
-0.13 (0.19)
-0.18 (0.19)
Skilled workers
0.00 (0.15)
0.03 (0.15)
-0.05 (0.15)
-0.03 (0.15)
-0.06 (0.15)
0.07 (0.15)
-0.05 (0.16)
Unskilled workers
0.00 (.)
0.00 (.)
0.00 (.)
0.00 (.)
0.00 (.)
0.00 (.)
0.00 (.)
***
Economic Ideology
0.07 (0.02) ***
***
-0.09 (0.01)
-0.06 (0.01) ***
Environmental values
***
0.36 (0.02)
0.33 (0.02) ***
Libertarianism
***
0.23 (0.02)
Immigration orientation
0.12 (0.02) ***
0.22 (0.02)
***
-2.80 (0.19)
*
0.285 (0.132) 10797
0.26 (0.02) ***
-2.83 (0.19)
*
0.326 (0.147) 10797
Intercept
-2.74 (0.19)
Intercept variance N
0.331 (0.149) 10797
***
**
0.16 (0.02)
Religiosity
***
***
-2.75 (0.18)
***
-2.77 (0.18)
*
0.288 (0.130) 10797
***
-2.68 (0.19)
**
0.263 (0.122) 10797
***
-2.80 (0.21)
**
0.310 (0.139) 10797
**
0.386 (0.172) 10797
Standard errors in parentheses. * p < 0.05, ** p < 0.01, *** p < 0.001
60
***
***
**
Table 4.4: Kappa values from the Green voting models Kappa Model 1 Model 2 Model 3 Model 4 Model 5 Model 6 Model 7
0,38 0,39 0,38 0,34 0,31 0,30 0,25
Absolute Relative change change 0,01 2% 0,00 -1 % -0,04 -10 % -0,08 -20 % -0,08 -21 % -0,14 -36 %
Model 4 adds environmental values to social class. Obviously enough, caring for the environment is positively, even most positively, linked to Green voting. Different distributions of environmental values in the different countries account for about 20% of the between-country variance in Green voting. However, it only accounts for a small portion of the class differences. The net kappa value after controlling for environmental values is about 10% lower than the gross kappa value, i.e. the total Green class voting, and the coefficients are slightly changed. In sum, environmental values are very important for Green voting, but not for accounting for class differences, contrary to hypothesis 4.2.2. It is still more important than the Old Politics cleavages, strengthening hypothesis 4.2.1. Model 5 controls for libertarianism, which is positively related to Green voting. Controlling for this variable renders the difference between the higher service class and the unskilled workers halved and non-significant. The differences between the lower service class and the routine-non manual employees, on the one hand, and the unskilled workers on the other, are reduced. Total class voting as measured by the kappa value is reduced with 20%, thus accounting for twice as much class voting as environmental values. This gives support to hypothesis 4.2.1, whereas hypothesis 4.2.2 is disconfirmed. Model 6 includes immigration orientations, and being more positive to immigration increases the chance of voting Green. Controlling for this variable also reduces the between-country variance. The class coefficients are reduced28 and the kappa value is reduced by more than 20%. The conclusion is the same as for model 5: hypothesis 4.2.1 is supported, while 4.2.2 is disconfirmed. The final model includes all variables. The difference between the higher service class and the unskilled workers is rendered non-significant and with almost no magnitude. The log odds 28
In the four alternative specifications, the coefficient of the higher service class is even rendered non-significant
61
ratio of the lower service class is halved; that of the routine non-manual employees reduced by a third. The kappa value is reduced by 36%. In addition, although less important, the economic ideology and libertarianism coefficients are approximately halved.29 In conclusion, the value orientations account for about 36% of the total Green class voting. The Old Politics values were of almost no importance in this regard, whereas the New Politics-orientations mattered. This was as expected, and hypothesis 4.2.1 was greatly supported. However, it was surprising to see that libertarianism and immigration orientations were more important in accounting for class differences than were environmental values. Hypothesis 4.2.2 was disconfirmed.30 Visualizing these findings, figure 4.4 plots the predicted probabilities from model 3 of voting Green for each class, by religiosity levels. There are two things to note: The Old Politics dimension religiosity has no strong impact on the likelihood of voting Green (although we see that the most religious people are somewhat less likely to do so). Also, the class differences do not vary much by level of religiosity (although the classes are somewhat more homogenous at the higher religiosity levels). [Figure 4.4 here] Compare this to figure 4.5, plotting the predicted probabilities of voting Green by class and environmental values. These are obviously important, and the differences between the classes vary from barely existent (at low levels of environmentalism) to highly salient (at high levels of environmentalism). These plots are meant to visualize the support our analysis gave to hypothesis 4.2.1; namely that the New Politics value orientations would account for more class voting than the Old Politics value orientations. [Figure 4.5 here]
29
In the four alternative models, some coefficients are significant at a less strict level than here.
30
A closer analysis revealed why: The classes do in fact not differ greatly in their environmental values.
62
Figure 4.4: Predicted probabilities of voting Green by class and religiosity
Figure 4.5: Predicted prob. of voting Green by class and environmental values
4.3 Value orientations and Social Democratic class voting In section 3.3, we mentioned that the Social Democratic parties are amongst the old class parties, created as part of the class cleavage that developed with the Industrial Revolution. We theoretically justified our hypothesis about the likelihood that the different classes would vote SD by discussing the classes’ economic interests. These were measured by their economic 63
security, economic stability, and economic prospects. We now assume that these interests will affect economic ideology. Our hypothesis in this chapter is then as follows: Hypothesis 4.3.1: The most important factor (of the ones considered here) accounting for total SD class voting will be economic ideology. The results from the analysis of SD voting are shown in table 4.5. Model 1 shows the bivariate relationship between class and SD voting. As we see, all the classes differ significantly from the unskilled workers at the 0.1% level when it comes to SD voting, except for the skilled workers whose difference is significant at the 5% level.31 The ranking of the classes is similar to the one found in section 3.3.2. [Table 4.5 here] Table 4.6 portrays the kappa values based on the models. We see that the class coefficients from the bivariate model 1 yield a kappa value of 0.30 – compared to 0.32 in section 3.9. [Table 4.6 here] Model 2 controls for economic ideology. Unsurprisingly, the more left-leaning voters are more likely to vote SD than the right-leaning voters. It is more interesting to notice that the class coefficients have changed. The kappa value is reduced by 20%, to 0.24. The skilled workers no longer significantly differ from the unskilled ones. Different distributions of economic values in the countries also account for some 10% of the between-country variance in SD voting. Model 3, 4 and 5 controls for, respectively, religious beliefs, environmental values, and libertarianism. We see that being religious is weakly, negatively associated with voting SD. The two other coefficients are not significant at any reasonable level and have no magnitude to speak of. None of these three value orientations account for any between-country variance and none of them change the kappa values. In all three models, the difference between the skilled and unskilled voters remains significant.
31
The results are similar in the alternative specifications, except that the difference between the unskilled and skilled workers is only significant at the 10%-level in the gllamm and logit models (this is true for model 3, 4 and 5 as well).
64
Table 4.5: Social Democratic voting and value orientations: Multilevel logistic regression Model 1
Model 2
***
-0.55 (0.07)
***
-0.49 (0.06)
***
-0.27 (0.06)
-0.82 (0.08)
***
*
Model 3
***
-0.73 (0.07)
***
-0.58 (0.06)
***
-0.30 (0.06)
-0.66 (0.08)
***
-0.14 (0.07)
-0.11 (0.07)
0.00 (.)
0.00 (.)
Higher service class
-0.71 (0.07)
Lower service class
-0.57 (0.06)
Routine non-manual
-0.30 (0.06)
Petite bourgeoisie Skilled workers Unskilled workers
Model 4
***
-0.71 (0.07)
***
-0.56 (0.06)
***
-0.30 (0.06)
-0.82 (0.08)
***
-0.16 (0.07)
*
0.00 (.)
Model 5
***
-0.72 (0.07)
***
-0.57 (0.06)
***
-0.30 (0.06)
-0.82 (0.08)
***
-0.14 (0.07)
*
0.00 (.)
Model 6
***
-0.84 (0.07)
***
-0.67 (0.06)
***
-0.36 (0.06)
-0.82 (0.08)
***
*
***
-0.64 (0.07)
***
-0.55 (0.06)
***
-0.28 (0.06)
-0.83 (0.08)
***
-0.66 (0.08)
-0.14 (0.07)
-0.13 (0.07)
-0.10 (0.07)
0.00 (.)
0.00 (.)
0.00 (.)
***
Economic ideology
***
***
***
***
***
0.23 (0.01)
0.22 (0.01) ***
Religious beliefs
Model 7
***
-0.03 (0.01)
Environmental values
-0.03 (0.01)
**
-0.01 (0.01)
Libertarianism
-0.04 (0.01)
***
0.01 (0.01)
Immigration orientations
-0.04 (0.01) ***
0.10 (0.01)
0.11 (0.01)
***
Intercept
-0.63 (0.12)
***
-0.72 (0.11)
***
-0.63 (0.12)
***
-0.64 (0.12)
***
-0.63 (0.12)
***
-0.60 (0.11)
***
-0.71 (0.11)
***
Intercept variance N
0.21 (0.07) 15609
***
0.19 (0.07) 15609
***
0.21 (0.07) 15609
***
0.21 (0.08) 15609
***
0.21 (0.07) 15609
***
0.20 (0.07) 15609
***
0.18 (0.07) 15609
***
Standard errors in parentheses. * p