Classification of Web Documents Using a Graph Model Adam Schenker
Mark Last
Horst Bunke
Abraham Kandel
University of South Florida, Department of Computer Science and Engineering E-mail:
[email protected]
Ben-Gurion University of the Negev, Department of Information Systems Engineering E-mail:
[email protected]
University of Bern, Department of Computer Science E-mail:
[email protected]
University of South Florida, Department of Computer Science and Engineering E-mail:
[email protected]
Abstract In this paper we describe work relating to classification of web documents using a graph-based model instead of the traditional vector-based model for document representation. We compare the classification accuracy of the vector model approach using the kNearest Neighbor (k-NN) algorithm to a novel approach which allows the use of graphs for document representation in the k-NN algorithm. The proposed method is evaluated on three different web document collections using the leave-one-out approach for measuring classification accuracy. The results show that the graph-based k-NN approach can outperform traditional vector-based k-NN methods in terms of both accuracy and execution time.
1. Introduction Automated classification or categorization of natural language documents is an important research topic because it promises to reduce the cost and time associated with organizing large groups of documents related to diverse topics. Since the number of documents being produced now is more than ever before — especially when we consider the Internet with its massive amount of heterogeneous documents — manual classification and categorization can be extremely difficult. Thus we have the need for accurate, automated systems that can assign categories to documents based on their content. When representing documents for clustering or classification the vector model is typically used [14]. In this model, each possible index term that can appear in a document becomes a feature (dimension). The value assigned to each dimension of a document usually indicates the frequency of a particular term inside a document. The vector model is simple and allows the use of traditional classification methods that deal with numerical feature vectors. However, it discards information such as the order in which the terms appear, where in the document the terms appear, how close the terms are to each other, and so forth. By keeping this kind of structural information we could possibly improve classification accuracy. The problem is that traditional classification
methods are often restricted to working on purely numeric feature vectors due to the need to compute distances between the data items, which is easily accomplished with numerical feature vectors. Thus either the original data needs to be converted to a vector of numeric values by discarding possibly useful structural information (which is what we are doing when using the vector model to represent documents) or we need to develop new, customized algorithms for representations that include structural information. In order to overcome this problem, we have introduced an extension of classical approaches to classification that allows us to work with graphs as fundamental data structures instead of being limited to vectors of numeric values. Our approach has two main benefits: (1) it allows us to keep the inherent structure of the original documents by modeling each document as a graph instead of a vector, and (2) we extend existing classification algorithms rather than create new algorithms from scratch. In this paper we compare the traditional vector model representation to our new graph model in the context of document classification accuracy. We introduce a graph-based extension of the k-Nearest Neighbors classification algorithm. The leave-one-out approach will be used to compare classification accuracy over three document collections. We will select several values for the number of nearest neighbors, k, and will also look at the performance as a function of the size of the graphs representing each document. Traditional methods for performing text or document classification and categorization, such as rule induction [1] and Bayesian methods [10], are based on the vector model of document representation (see [14]) or an even simpler Boolean model. Only recently have a few papers appeared in the literature that deal with graph representations of documents. In [8] Lopresti and Wilfong use a graph representation for web documents that primarily utilizes HTML parse information, in addition to hyperlink and content order information. In their approach they use graph probing, which extracts numerical feature information from the graphs, such as node degrees or edge label frequencies, rather than comparing the graphs themselves. In contrast, our approach uses graphs created solely from the content, and we use the graphs themselves
Proceedings of the Seventh International Conference on Document Analysis and Recognition (ICDAR 2003) 0-7695-1960-1/03 $17.00 © 2003 IEEE
to determine document similarity rather than a set of extracted features. In [7], Liang and Doermann represent the physical layout of document images as graphs. In their layout graphs nodes represent elements on the page of a document, such as columns of text or headings, while edges indicate how these elements appear together on the page (i.e. spatial relationships). Matching between graphs is accomplished though a sub-optimal approximation approach. The method of [7] is based on the formatting and appearance of the documents when rendered, not the textual content (words) of a document as in our approach. In addition to the graph-based methods of document representation mentioned above, graphs are sometimes employed for other information retrieval tasks. The conceptual graph [9] is a type of semantic network (knowledge representation) [13] sometimes used in information retrieval. With conceptual graphs, terms or phrases related to documents appear as nodes. The types of relations (edge labels) include synonym, part–whole, antonym, and so forth. Conceptual graphs are used to indicate meaning-oriented relationships between concepts expressed in a document or document collection (i.e. domain knowledge), whereas our method indicates structural relationships that exist between the terms in a single document (i.e. document content). Our method of document representation is somewhat similar to that of directed acyclic word graphs (DAWGs) [4], which is most commonly used for compact dictionary representation. However, in our representation nodes represent words rather than letters, we allow for cycles and multiple edges between nodes, and the edges in our graphs are labeled. Classification of graphs in domains outside of information retrieval has largely been reported under the topic of graph matching. Under this model there exists a database of graphs and an input (or query) graph; the goal is to find the graph in the database that most closely matches the input graph [6]. In many applications the input graph is not expected to be an exact match to any database graph since the input graph is either previously unseen or assumed to be corrupted with some amount of noise. Thus we sometimes refer to this area as errortolerant or inexact graph matching. A number of graph matching applications have been reported in the literature, including the recognition of characters, graphical symbols, and two-dimensional shapes. For a recent survey see [2]. We are not aware, however, of any graph matching applications that deal with categorization and classification of web or text documents. This paper is organized as follows. In Section 2 we describe the extension of the k-NN algorithm that allows the use of graphs instead of numerical vectors. In Section 3 we give the details of our experimental setup and the results of our experiments. Conclusions and future work are presented in Section 4.
2. A graph-based extension of the k-Nearest Neighbors method In this section we will describe the k-Nearest Neighbors (k-NN) algorithm and how we can easily extend it to work with graph-based data. The basic k-NN algorithm is given as follows [12]. First, we have a database of training examples (instances). In the traditional k-NN approach these will be numerical vectors in some real-valued feature space. Each of these instances is associated with a label which indicates to what class the instance belongs. Given a new, previously unseen instance, called a query or input instance, we attempt to estimate which class it belongs to. Under the k-NN method this is accomplished by looking at the k training instances closest (i.e. with least distance) to the input instance. Here k is a user provided parameter and distance is usually defined to be the Euclidean distance: dist EUCL (x, y) =
n
∑ (x
i
− y i )2
(1)
i=1
where xi and yi are the ith components of vectors x=(x1, x2, ..., xn) and y=(y1, y2, ..., yn), respectively. However, for applications in text and document classification, the cosine similarity measure [14] is often used due to its length invariance property. We can convert this to a distance measure by the following:
distCOS (x, y) = 1−
x•y x ⋅ y
(2)
Here • indicates the dot product operation and ||...|| indicates the magnitude (length) of a vector. Once we have found the k nearest training instances using some distance measure, we examine them and determine what class is held by the majority of those instances. This class is then assigned as the predicted class for the input instance. In order to extend the k-NN method to work with graphs instead of vectors, we need a distance measure that can compute the distance between two graphs. Such a measure has been proposed in [3]:
distMCS (G1,G2 ) = 1−
mcs(G1,G2 ) max(G1 , G2 )
(3)
where G1 and G2 are graphs, mcs(G1,G2) is their maximum common subgraph, max(...) is the standard numerical maximum operation, and |...| denotes the size of the graph. The size of a graph can be taken as the number of nodes and edges contained in the graph. In the general
Proceedings of the Seventh International Conference on Document Analysis and Recognition (ICDAR 2003) 0-7695-1960-1/03 $17.00 © 2003 IEEE
case the computation of mcs is NP-Complete [11], but for our graph representation the computation of mcs can be accomplished in polynomial time due to the existence of unique node labels in the considered application. As we will see in the next section, the graph method outperformed the vector method in terms of execution time in some cases. Other distance measures which are also based on the maximum common subgraph have been suggested. For example, Wallis et al. have introduced a different metric which is not as heavily influenced by the size of the larger graph [16]. Fernández and Valiente combine the maximum common subgraph and the minimum common supergraph in their proposed distance measure [5]. However, Eq. 3 is the “classic” version and the one we will use in our implementation.
3. Experiments and results In order to evaluate the performance of our proposed method of using graphs with the k-NN algorithm, we performed several experiments on three different collections of web documents, called the F-series, the Jseries, and the K-series.1 Each collection contains documents in HTML format (i.e. the documents are web pages). The F-series originally contained 98 documents assigned to one or more of 17 sub-categories of four major category areas: manufacturing, labor, business & finance, and electronic communication & networking. Since there are multiple sub-category classifications from the same category area for many of these documents, we have reduced the categories to just the four major categories mentioned above in order to simplify the problem. There were five documents that had conflicting multiple classifications (i.e., they were classified to belong to two or more of the four major categories) which we removed, leaving 93 total documents. The J-series contains 185 documents and ten classes: affirmative action, business capital, information systems, electronic commerce, intellectual property, employee rights, materials processing, personnel management, manufacturing systems, and industrial partnership. We have not modified this data set. The K-series consists of 2,340 documents and 20 categories. In order to keep execution time reasonable for both the vector and the graph methods, we have selected a subset of 335 documents (roughly every 7th document) that represent 19 classes from this collection. For the vector-model representation experiments there were already several pre-created term–document matrices available for our experiments at the same location where we obtained the three document collections (see footnote 1). We selected the matrices with the smallest number of 1
The data sets are available under these names at: ftp://ftp. cs.umn.edu/dept/users/boley/PDDPdata/
dimensions. For the F-series documents there are 332 dimensions (terms) used, while the J-series has 474 dimensions and the K-series has 1,458. We performed some preliminary experiments and observed that other term-weighting schemes (i.e., tf⋅idf, see [14]) improved the accuracy of the vector-model representation for these datasets either only very slightly or not at all. Thus we have left the data in its original format. TI YAHOO
L NEWS
TX
TX
REPORTS
SERVICE
MORE
REUTERS
TX
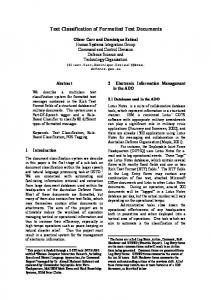
Figure 1. Example of a graph representation of a document For our graph-based experiments we created graph representations from the original documents using the following method. First, each term (word) appearing in the document, except for stop words such as “the”, “of”, and “and” which convey little information, becomes a node in the graph representing that document. This is accomplished by labeling each node with the term it represents. Note that we create only a single node for each word even if a word appears more than once in the text. Thus each node in the graph represents a unique word and is labeled with a unique term not used to label any other node. Second, if word a immediately precedes word b somewhere in a “section” s of the document, then there is a directed edge from the node corresponding to a to the node corresponding to b with an edge label s. We take into account certain punctuation (such as a period) and do not create an edge when these are present between two words. Sections we have defined are: title, which contains the text related to the document’s title and any provided keywords; link, which is text appearing in clickable hyperlinks on the document; and text, which comprises any of the readable text in the document (this includes link text but not title and keyword text). Next, we perform a simple stemming method and conflate terms to the most frequently occurring form by re-labeling nodes and updating edges as needed. Finally, we remove the most infrequently occurring words on each document by deleting their corresponding nodes, leaving at most m nodes per graph (m being a user provided parameter). This is similar to the dimensionality reduction process for vector representations but with our method the term set can be different for each document. An example of this type of graph representation is given in Figure 1. The ovals indicate nodes and their corresponding term labels. The edges are labeled according to title (TI), link (L), or text (TX). The document represented by the example has the title “YAHOO NEWS”, a link whose text reads
Proceedings of the Seventh International Conference on Document Analysis and Recognition (ICDAR 2003) 0-7695-1960-1/03 $17.00 © 2003 IEEE
“MORE NEWS”, and text containing “REUTERS NEWS SERVICE REPORTS”. Note also there is no restriction on the form of the graph and that cycles are allowed. While this appears superficially similar to the bigram, trigram, or N-gram methods [15], those are statisticallyoriented approaches based on word occurrence probability models. Our method does not require or use the computation of term probabilities. We used a varying number of maximum graph sizes to examine the effect of graph size on performance. For both the vector model and our graph approach it is generally not desirable, due to reasons of processing time reduction and noise removal, to represent the entire document in the model, only the most useful parts. Classification accuracy is measured by the leave-one-out method. In this method we iterate over all n documents, using n–1 documents as training instances and then testing whether the remaining instance is classified correctly. Accuracy is reported as the number of documents classified correctly divided by n.
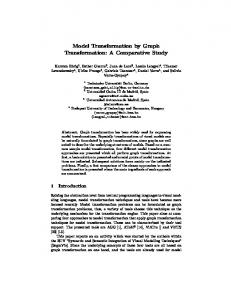
indicates the performance of the vector model approach when using the cosine distance measure (Eq. 2), which we take here to be a benchmark against which our novel graph-based method is compared. We see that when we allowed for graphs of 10 nodes or more for the F and Jseries our method outperforms the standard method in most cases. We also see that the performance continued to improve as we created larger graphs, with graphs using up to 20 or 30 nodes outperforming the standard method in all cases. The K-series, however, needed larger graph sizes to attain an improvement in accuracy over the vector model. We attribute this to the greater number of classes used in this data set (nearly twice as many as the J-series): in order to properly differentiate between classes a larger number of terms is necessary. For the K-series we used graph sizes of 30, 50 and 70 nodes per graph maximum; at 30 nodes per graph our method performed similarly to the vector approach, but with the larger graphs (50 and 70 nodes per graph) it outperformed the vector method for all values of k.
Results for F-series Data Set
Results for K-series Data Set
100% 80%
75% 90% Classification Accuracy
Classification Accuracy
95%
85%
80%
75%
70%
65%
60%
55% 70% 1
2
3
4
5
6
7
8
9
10
Number of Nearest Neighbors (k)
Vector model (cosine)
Graphs (5 nodes/graph)
Graphs (20 nodes/graph)
Graphs (30 nodes/graph)
50% 1
2
3
Graphs (10 nodes/graph)
Figure 2. Experimental results for the F-series
4
5
6
7
8
9
10
Number of Nearest Neighbors (k)
Vector model (cosine)
Graphs (30 nodes/graph)
Graphs (50 nodes/graph)
Graphs (70 nodes/graph)
Figure 4. Experimental results for the K-series Results for J-series Data Set
For both the vector and graph approaches we select the predicted class randomly from amongst the tied classes based on the order the training instances are processed. Consequently, the results will be identical each time we perform our experiment with the data presented in the same order.
90%
Classification Accuracy
85%
80%
75%
70%
65%
60% 1
2
3
4
5
6
7
8
9
10
Number of Nearest Neighbors (k)
Vector model (cosine)
Graphs (5 nodes/graph)
Graphs (20 nodes/graph)
Graphs (30 nodes/graph)
Graphs (10 nodes/graph)
Figure 3. Experimental results for the J-series The results for the F-series, the J-series, and the Kseries are given in Figures 2, 3, and 4, respectively. The graph shows the classification accuracy as a function of k, the number of nearest neighbors to use. We used values of 1, 3, 5, and 10 for k. The dotted line in the figures
Table 1. Classification time comparison for the K-series data set (k=10) Method vector graphs, 30 nodes/graph graphs, 50 nodes/graph graphs, 70 nodes/graph
Avg. time for one classification 6.5 seconds 3.7 seconds 6.4 seconds 8.1 seconds
We also measured the execution times needed to perform the classification for the documents of the Kseries data set, which was the most time-consuming, for both the vector model approach and our graph-based
Proceedings of the Seventh International Conference on Document Analysis and Recognition (ICDAR 2003) 0-7695-1960-1/03 $17.00 © 2003 IEEE
approach. Both methods were timed for k=10, and the experiments were carried out on the same system under the same operating conditions. The results are shown in Table 1 as the average time to classify one document. For the case of a graph size of 30 nodes we see that not only was the graph-based approach slightly more accurate (Figure 4), it was also faster by a margin of over 40%. This is likely due to that fact that the distance computation between two graphs with 30 nodes each is faster to perform than the distance computation of two vectors each with 1,458 elements. It is interesting to note the trade-off between time and performance: as graph sizes become larger the performance increases but so does the time needed to perform the classification.
4. Conclusions In this paper we gave an extension of the k-Nearest Neighbor classification algorithm that allows the method to work with data represented using graphs rather than numerical feature vectors. We described an application of this approach by representing web documents with graphs and then using a graph-theoretical distance measure for the distance computation in the k-NN algorithm in order to classify the documents. We showed the effectiveness of our approach by measuring classification accuracy using the leave-one-out method over three data sets for both our method and the standard vector model approach with cosine similarity. The experimental results showed that our method outperformed the vector model in terms of accuracy (strongly in several cases) and is even able to attain significant savings in terms of execution time. For future work we would like to extend other classification methods to the graph domain, such as the distance weighted k-Nearest Neighbors method [12]. We will also perform experiments for finding the optimal number of nodes to use for each graph. We saw from our experiments in this paper that there is a trade-off between performance and execution time as we vary the graph size, and we would like to find the optimal number of nodes to use for each individual graph. Since graphs can be of varying sizes we do not necessarily need to use the same size for every graph as we did in our experiments here. For example, it may be that some documents require a graph with 20 nodes while other documents need a graph with only 8 nodes. Selecting a suitable size would optimize both performance and execution time.
5. Acknowledgments This work was supported in part by the National Institute for Systems Test and Productivity at the University of South Florida under U.S. Space and Naval Warfare Systems Command grant number N00039–01–1– 2248.
6. References [1] C. Apte, F. Damerau, and S. M. Weiss, “Automated Learning of Decision Rules for Text Categorization”, ACM Transactions on Information Systems, Vol. 12, No. 3, 1994, pp. 233–251. [2] H Bunke, “Recent developments in graph matching”, Proceedings of the 15th International Conference on Pattern Recognition, Barcelona, Vol. 2, 2000, pp. 117–124. [3] H. Bunke and K. Shearer, “A graph distance metric based on the maximal common subgraph”, Pattern Recognition Letters, Vol. 19, 1998, pp. 255–259. [4] M. Crochemore and R. Vérin, “Direct construction of compact directed acyclic word graphs” in CPM97, A. Apostolico and J. Hein (eds.), Springer–Verlag, 1997. [5] M.–L. Fernández and G. Valiente, “A graph distance metric combining maximum common subgraph and minimum common supergraph”, Pattern Recognition Letters, Vol. 22, 2001, pp. 753–758. [6] M. Lazarescu, H. Bunke, and S. Venkatesh, “Graph matching: fast candidate elimination using machine learning techniques”, Advances in Pattern Recognition, Joint IAPR International Workshops SSPR and SPR 2000, Lecture Notes in Computer Science, Vol. 1876, 2000, pp. 236–245. [7] J. Liang and D. Doermann, “Logical labeling of document images using layout graph matching with adaptive learning”, in Document Analysis Systems V, D. Lopresti, J. Hu, R. Kashi (eds.), Springer–Verlag, LNCS 2423, 2002, pp. 224–235. [8] D. Lopresti and G. Wilfong, “Applications of graph probing to web document analysis”, Proceedings of the 1st International Workshop on Web Document Analysis (WDA2001), 2001, pp. 51–54. [9] X. Lu, “Document retrieval: a structural approach”, Information Processing and Management, Vol. 26, No. 2, 1990, pp. 209–218. [10] A. McCallum and K. Nigam, “A comparison of event models for Naive Bayes text classification”, AAAI–98 Workshop on Learning for Text Categorization, 1998. [11] B. T. Messmer and H. Bunke, “A new algorithm for errortolerant subgraph isomorphism detection”, IEEE Transactions on Pattern Analysis and Machine Intelligence, Vol. 20, 1998, pp. 493–504. [12] T. M. Mitchell, Machine Learning, McGraw–Hill, Boston, 1997. [13] S. Russell and P. Norvig, Artificial Intelligence: A Modern Approach, Prentice–Hall, Upper Saddle River, 1995. [14] G. Salton, Automatic Text Processing: the Transformation, Analysis, and Retrieval of Information by Computer, Addison– Wesley, Reading, 1989. [15] C.-M. Tan, Y.-F. Wang, and C.-D. Lee, “The use of bigrams to enhance text categorization”, Information Processing and Management, Vol. 38, 2002, pp. 529–546. [16] W. D. Wallis, P. Shoubridge, M. Kraetz, and D. Ray, “Graph distances using graph union”, Pattern Recognition Letters, Vol. 22, 2001, pp. 701–704.
Proceedings of the Seventh International Conference on Document Analysis and Recognition (ICDAR 2003) 0-7695-1960-1/03 $17.00 © 2003 IEEE