Classifying Papers from Different Computer Science Conferences Yaakov HaCohen-Kerner1, Avi Rosenfeld2, Maor Tzidkani1, and Daniel Nisim Cohen1 1
Dept. of Computer Science, Jerusalem College of Technology, 9116001 Jerusalem, Israel
[email protected], {maortz,sdanielco}@gmail.com 2 Department of Industrial Engineering, Jerusalem College of Technology, 9116001 Jerusalem, Israel
[email protected]
Abstract. This paper analyzes what stylistic characteristics differentiate different styles of writing, and specifically types of different A-level computer science articles. To do so, we compared various full papers using stylistic feature sets and a supervised machine learning method. We report on the success of this approach in identifying papers from the last 6 years of the following three conferences: SIGIR, ACL, and AAMAS. This approach achieves high accuracy results of 95.86%, 97.04%, 93.22%, and 92.14% for the following four classification experiments: (1) SIGIR / ACL, (2) SIGIR / AAMAS, (3) ACL / AAMAS, and (4) SIGIR / ACL / AAMAS, respectively. The Part of Speech (PoS) and the Orthographic sets were superior to all others and have been found as key components in different types of writing. Keywords: Classification and regression trees, Conference classification, Decision tree learning, Document classification, Feature sets, Text classification.
1
Introduction
Academic conference papers from different research domains are differ in their content and can be classified according to suitable content words. However, we intuitively feel that additional stylistic elements exist that differentiate writing styles in different research domains. The goal of this research is to quantify elements of stylistic characteristics that differentiate different types of different A-level computer science articles. To create this model, this study uses text classification (TC) and supervised machine learning (ML) to create this automated classifier. TC is the supervised learning task of classifying natural language text documents to one or more predefined categories from training data [21]. The main difficulty with this learning task is that a large number of features exist in the training data, and some, if not many, are redundant and can be ignored. Additionally, having too many features can lead to the “curse of dimensionality” whereby the model’s accuracy is reduced as H. Motoda et al. (Eds.): ADMA 2013, Part I, LNAI 8346, pp. 529–541, 2013. © Springer-Verlag Berlin Heidelberg 2013
530
Y. HaCohen-Kerner et al.
more features are considered [26]. Thus, an important question is identifying which features are necessary for building an accurate model. To date, TC approaches typically focused on the content within a paper to identify these features in sentiment analysis [23, 24, 28], spam filtering [1, 39]; genre [3, 14, 29, 19] and gender [15, 2, 13]. For instance, economical texts use inherently different content words and phrases than political texts. In contrast, this work does not consider the actual content within the paper or any keywords, yet strives to build an accurate model nonetheless. Instead, we model writing differences based on four general feature sets: orthographic, quantitative, vocabulary richness, and part of speech. Other works have taken aspects of this approach within other problems. These include use of linguistic features in classifying news stories [2], work on gender identification [15, 2, 13], work on classifying documents according to their author [29, 6, 22, 4, 32, 16, 17], and work on identifying the historical period and ethnic origin of different documents [10, 11]. The key contribution of this paper is its finding that a paper’s vocabulary richness (variation) and use of certain parts of speech can accurately classify what type of writing it is. Specifically, we studied full papers from three leading computer science conferences from different research areas: SIGIR (Special Interest Group of Information Retrieval), ACL (Association for Computational Linguistics), and AAMAS (Autonomous Agents and Multi-Agent Systems) from the past 6 years. As each of these conferences studies different aspects of computer science, we wished to ascertain what characteristics differentiate the writing in these venues. We found that different conferences exhibited strong differences based on the average part of speech usage, suggesting that stylistic differences between venues can be quantified along the lines presented in this paper. A general overview of systems that automatically evaluate and score written prose can be found in [7]. Dikli describes several Automated Essay Scoring (AES) systems. The systems check various aspects of the essay, e.g.: spelling, grammar, redundancy, ideas and content, organization of the essay, essay length, plagiarism, sentence structure, coherence, focus and unity (coherence), and development and elaboration. These systems use various techniques such as (1) Latent Semantic Analysis (LSA) [9]. Latent Semantic Analysis (LSA) is defined as “a statistical model of word usage that permits comparisons of the semantic similarity between pieces of textual information” [18, p. 2]; (2) empirical natural language methods that employ statistical or machine learning techniques, and (3) Bayesian text classification. This paper is organized as follows: Section 2 describes four feature sets for classification used in related works. Section 3 presents the classification model. Section 4 describes the results of the experiments and analyzes them. Section 5 presents a summary and proposals for research directions.
2
Feature Sets
Various feature sets have been proposed and applied in many research domains, such as authorship attribution [21, 29, 31], genre-based text classification and retrieval [3, 14, 29, 19], and sentiment analysis [23, 28].
Classifying Papers from Different Computer Science Conferences
531
In this paper, we consider 103 features divided into four categories of feature sets: 10 Orthographic features (O), 3 Quantitative features (Q), 18 Vocabulary Richness features (V), and 72 Part of Speech (PoS) features. (1) The O features focus on the special characters needed for correct language usage. These features typically focus on spelling and include: capitalization, word breaks and punctuation marks. We then normalized these features both by the number of characters and words (thus creating two normalized values per symbol) to account for differences in article length. For example, we checked the number of “ ’ ” in the document and then normalized this value by the number of characters in the document. The implemented O set contains the frequencies for 10 common symbols used to write grammatically correct English. These 10 symbols are: " ’ ", " " ", ":", ";", ".", ",", "!", "?", "-", and "/". (2) The Q features present statistical measures that generally describe a document, e.g., average number of characters in a word/sentence/document; average number of word tokens in a sentence/document. Such features were first proposed by Yule [38]. The implemented Q set contains 3 normalized features: average number of characters in a word, average number of characters in a sentence, and average number of words in a sentence. We did not apply features such as the number of characters in the document, the number of word tokens in the document, and number of sentences in the document. This was done to prevent the model from focusing on trivial differences between different types of papers (e.g. their length). (3) The V features capture the richness or the diversity of the vocabulary of a text. They have mainly been applied to authorship attribution research [35]. The most popular feature of this category is the type-token ratio S/N where S is the size of the vocabulary of the document, and N is the number of tokens of the document. Additional similar features are the hapax legomena/N where hapax legomena are words occurring once in the sample text and the dis legomena / N where dislegomena are words occurring twice in the sample text. Additionally, we considered the variations of this rule for words that appear only 3, 4, or 5 times. We considered two variations of the V features - those that first stemmed the words (VRS), and those that did not (VRN). To implement VRS, we used the established Porter stemmer [27]. Using a stemmer would reduce the number of unique words in VRS compared to VRN. For example, if previously “boy” and “boys” had appeared once each, a stemmer would identify these words as the same word, and thus are no longer unique. The V set was broken into the VRN and VRS variations. The implemented VRN contains 6 features: the number of different words in the tested document normalized by the number of words (Diff) (i.e., the type-token ratio), the number of unique words (One), words with two, three, four and five appearances. The implemented VRS contains 12 features, which are variations of the following 6 features: the number of different stems in the tested document normalized by the number of words (Diff), and the number of stems with only one, two, three, four and five appearances, respectively. Each one of these 6 features was normalized twice: one by the total number of words and one by the number of stems. (4) The PoS features were created via the established Stanford Part-of-Speech tagger [34], which was used to identify the part of speech for every term in the
532
Y. HaCohen-Kerner et al.
documents. We again normalized each one of the 36 parts of speech by N the number of tokens of the document, and by the total parts of speech within the document. Hence, the implemented PoS set contains 72 normalized frequencies of tagged types.
3
The Classification Model
Current-day text classification presents challenges due to the large number of features present in the text set, their dependencies and the large number of training documents. Effective feature selection is essential to make the learning task efficient and more accurate. Our general methodology is as follows: We first created a varied corpus with full articles from three A-level conferences: SIGIR, ACL, and AAMAS from the following 6 years: 2007-2012. We then used a commercial, off-the-shelf conversion program (www.abbyy.com) to convert the PDF files of the source articles into text files that could be analyzed for the four feature sets described above. In order to remove the potential influence the different lengths of these papers had on this analysis, we considered only the first 500 words for each paper. Our consideration is supported by the Heaps' law (also known as Herdan's law). This is an empirical linguistic law, discovered by Gustav Herdan in 1960 [8]. This law describes the number of distinct words in a document as a function of the document length in words. The Heaps' law means in general that as higher is the number of the words in the document as lower is the proportion of unique words in the document. The V features are considered unreliable to be used alone; however, they can be useful in combination with other feature types [33, 20]. In the typical format of these conferences, 500 words, probably include the title, abstract, and part of the introduction section. While this may remove important content from body of the paper from our analysis, success with such a small number of words only strengthens the significance of the approach we present. The feature sets from these text files were then used to create an input file for use with the recognized ML Weka Package [36, 12]. We then analyzed the output from the classification algorithms found within Weka applying the test mode of 10-fold cross-validation. The success of this classification approach is clearly based on the features entered into the model. While many ML algorithms exist within the Weka package, we intentionally chose decision tree methods as the base of our classifier. Comparing other classification methods (e.g., Support Vector Machines, Bayesian learners and Neural Networks), decision trees have many advantages: (1) people are able to understand the produced trees quickly relatively to other ML methods, (2) they handle both numerical and categorical data, (3) having interpretable models instead of black boxes, in order to know which features constitute the stylistic difference, and (4) require little data preparation; i.e., no need for data normalization and production of dummy variables [37, 27].
Classifying Papers from Different Computer Science Conferences
533
Decision tree learning methods are used in various applications such as: classification, clustering, machine learning, pattern matching, and text mining [27]. These methods use a decision tree as a predictive model, which maps features' values of an item to decisions concerning the item's target value. In the produced decision trees, leaves represent class labels and branches represent conjunctions of features that lead to those class labels. Specifically, we focus primarily on the results achieved by the Classification And Regression Tree (CART) machine learning (ML) method, implemented as SimpleCart in Weka [36, 12]. CART has been applied in our experiments since it is a ML method particularly suitable for classification tasks that use categorical or numeric features. CART refers to a non-parametric decision tree learning technique that produces either classification or regression trees, depending on whether the dependent variable is categorical or numeric, respectively. This ML method was first introduced by Breiman [5].
4
Experimental Results
We created a study of differences between accepted papers of three top rated (A) computer science conferences from the past 6 years (2007-2012). The three conferences are: SIGIR - Special Interest Group of Information Retrieval, ACL Association of Computational Linguistics, and AAMAS - International Conference on Autonomous Agents and Multiagent Systems. These three conferences belong to three different research domains: autonomous agents and multiagent systems, computational linguistics (CL), and Information Retrieval (IR), respectively. We wished to ascertain if there are features that can consistently differentiate between different types of research papers, with even a limited fixed amount of 500 words from each conference. This corpus contains a total of 2082 full papers of which 565 are SIGIR papers, 714 are ACL papers, and 803 are AAMAS papers. As all of these conferences are A-level conferences, we assumed that with very few exceptions, all writing in all conferences was grammatically correct English. Using the SimpleCart ML method, we performed four classification experiments representing all possible combinations between these conferences: (1) SIGIR / ACL, (2) SIGIR / AAMAS, (3) ACL / AAMAS, and (4) SIGIR / ACL / AAMAS. The measure of accuracy in all experiments is the fraction of the number of documents correctly classified to the total number of possible documents to be classified. The results of these four experiments are summarized in Tables 1-4 and Figures 1-4, respectively. The baseline classifier (row 1) in tables 1-4 naively assumes that the paper belongs to the largest category. Rows 2–6 present the classification results using each one of the O, Q, VRN, VRS and PoS feature sets, respectively. Row 7 (All) presents the accuracy using all features. Table 1 presents the results of the SIGIR / ACL experiment, and Fig. 1 presents the produced CART decision tree for this classification task.
534
Y. HaCohen-Kerner et al. Table 1. Classifying full SIGIR / ACL papers, based on feature sets
Row
Accuracy in %
1
Majority
55.82
2
O
94.37
3
Q
63.57
4
VRN
73.89
5
VRS
74.28
6
PoS
90.15
7
ALL Sets
95.86
8
Weighted average F-Measure (ALL)
0.959
9
Mean absolute error (ALL)
0.0585
10
Root mean squared error (ALL)
0.1912
/_in_letters (O)< 0.000829: ACL (636/10) /_in_letters (O)>= 0.000829 | PoS-normalized_by_ sentences_count (PoS)< 0.005435 | | /_in_words (O)< 0.0057915: SIGIR(16/0) | | /_in_words (O)>= 0.0057915: ACL (48/5) | PoS- normalized_by_ sentences_count (PoS) >= 0.005435: SIGIR (534/30) Fig. 1. The decision tree developed for the SIGIR / ACL classification
Several general conclusions can be drawn from Table 1 and Fig. 1: 1.
2. 3. 4. 5.
The improvement rates presented in Table 1 are significant improvements from the majority baseline (row 1) in all cases (rows 2-7). The best improvement rate (from the majority baseline to the combination of all sets) is 40.4%. The Orthographic (row 2) and the PoS (row 6) sets were superior to all other sets. The low values of the mean absolute error (row 9), and the root mean squared error (row 10) indicate that the classification results are stable. The F-measure result was also almost optimal and indicates that this classification task was highly successful. The produced CART decision tree presented in Fig. 1 is very simple and contains only three features represented in 7 nodes including 4 leaf nodes. On the right side of the tree's root we have "(636/10)", which means that 636 ACL papers were successfully recognized as ACL papers, while 10 SIGIR papers were wrongly recognized as ACL papers.
Classifying Papers from Different Computer Science Conferences
6.
7.
535
Much more ACL's full papers (than SIGIR's full papers) contain less than 0.000829 of appearances of '/' divided by the number of letters contained in the first 500 words. Much more SIGIR's full papers contain more or equal to 0.005435 of appearances of PoS_normalized_by_sentences_count (the number of Possessive endings such as "system's" divided by the number of sentences that contain the first 500 words)
From the initial analysis of these results, it seems clear that the Orthographic and the PoS feature sets were the most important feature sets in differentiating between different types of research articles. One possible explanation for these findings is that different conferences have different styles. Certain elements of these styles can be quantified via analyzing that writing’s frequency (normalized) for part of speech usage. It is important to note that the best result for the preformed experiments has been achieved using only three features: (1) "/_in_letters" (the number of '/' divided by the number of letters contained in the first 500 words), (2) PoS_normalized_by_ sentences_count (the number of Possessive endings such as "system's" divided by the number of sentences that contain the first 500 words), and (3) "/_in_words" (the number of '/' divided by 500, which is the number of the words that are taken into account). This result confirms other ML results that a “curse of dimensionality” can exist when adding even seemingly important features [26]. Table 2 presents the results of the SIGIR / AAMAS experiment, and Fig. 2 presents the produced CART decision tree for this classification task. Table 2. Classifying full SIGIR / AAMAS papers, based on feature sets
Row
Accuracy in %
1
Majority
59.21
2
O
95.67
3
Q
78.27
4
VRN
59.86
5
VRS
59.64
6
PoS
86.21
7
ALL Sets
97.04
8
Weighted average F-Measure (ALL)
0.97
9
Mean absolute error (ALL)
0.0483
10
Root mean squared error (ALL)
0.1634
536
Y. HaCohen-Kerner et al.
/_in_letters (O)< 0.0008705 : AAMAS(770/10) /_in_letters (O)>= 0.0008705 | NNPS_normalized (PoS)< 0.004654 : SIGIR(537/17) | NNPS_normalized (PoS)>= 0.004654 | | CC_normalized (PoS)< 0.03256 : AAMAS (27/2) | | CC_normalized (PoS)>= 0.032536 : SIGIR(16/6) Fig. 2. The decision tree developed for the SIGIR / AAMAS classification
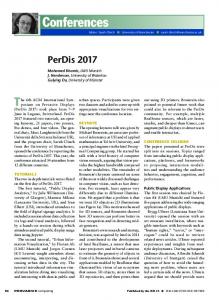
The general conclusions that can be drawn from Table 2 and Fig. 2 are rather similar to those concluded from Table 1 and Fig. 1. The main differences between the two experiments are that two features integrated in the decision tree have been changed. The "/_in_letters" feature remains in the root node. The two new features are taken from the PoS set: (1) "NNPS_normalized (PoS)", which means the number of plural proper nouns (e.g., Americans) divided by 500, the number of the words that are taken into account, and (2) "CC_normalized", which means the number of coordinating conjunctions (e.g., and, but, or, nor, for, yet, so) divided by 500. The ACL' full papers contain relatively less appearances of '\' than the SIGIR's full papers. The results of the last two classification experiments: ACL / AAMAS, and SIGIR / ACL / AAMAS are shown in Tables 3-4 and Figures 3-4, respectively. The produced CART decision trees for these experiments are much larger and complicated than the previous two decision trees. Due to space limitations, we do no present the analysis of these results in detail. The results again demonstrate the success of the presented approach, and the general conclusions are rather similar, except for minor differences, e.g., in the third experiment the best set was the PoS set and the feature at the root node was a PoS's feature (NNPS_normalized) and not an orthographic feature. Table 3. Classifying full ACL / AAMAS papers, based on feature sets
Row
Accuracy in %
1
Majority
53.46
2
O
83.90
3
Q
79.47
4
VRN
76.34
5
VRS
69.95
6
PoS
92.96
7
ALL Sets
93.22
8
Weighted average F-Measure (ALL)
0.934
9
Mean absolute error (ALL)
0.0988
10
Root mean squared error (ALL)
0.2452
Classifying Papers from Different Computer Science Conferences
537
NNPS_normalized (PoS)< 0.002793 | LS_normalized_by_sentences_count (PoS)< 0.0066665 | | averageCharacterPerWords (Q)< 4.7439275 | | | averageCharacterPerSentences (Q)< 43.436955: ACL(6/0) | | | averageCharacterPerSentences (Q)>= 43.436955: AAMAS(16/3) | | averageCharacterPerWords (Q)>= 4.7439275 | | | FW_normalized (PoS)< 0.003861 | | | | averageCharacterPerWords (Q)< 5.187702 | | | | | averageCharacterPerSentences (Q)< 50.46679: ACL(19/3) | | | | | averageCharacterPerSentences (Q)>= 50.46679: AAMAS(15/3) | | | | averageCharacterPerWords (Q)>= 5.187702: ACL(89/4) | | | FW_normalized (PoS)>= 0.003861: ACL(515/6) | LS_normalized_by_sentences_count (PoS)>= 0.0066665 | | averageWordsPerSentences (Q)< 9.574204 | | | oneWordsNormalized (V)< 0.348445: ACL(28/1) | | | oneWordsNormalized (V)>= 0.348445 | | | | VBN_normalized (PoS)< 0.018228: ACL(8/1) | | | | VBN_normalized (PoS)>= 0.018228 | | | | | comma_in_letters (O)< 0.008367: ACL(4/0) | | | | | comma_in_letters (O)>= 0.008367: AAMAS(15/2) | | averageWordsPerSentences (Q)>= 9.574204 | | | FW_normalized_by_sentences_count (PoS)< 0.3156025 | | | | VBP_normalized_by_sentences_count (PoS)< 0.5138995: AAMAS(112/5) | | | | VBP_normalized_by_sentences_count (PoS) >= 0.5138995: ACL(5/1) | | | FW_normalized_by_sentences_count (PoS)>= 0.3156025: ACL(7/1) NNPS_normalized (PoS)>= 0.002793 | JJ_normalized_by_sentences_count (PoS)< 1.646307: AAMAS(643/11) | JJ_normalized_by_sentences_count (PoS)>= 1.646307: ACL(9/2) Fig. 3. The decision tree developed for the ACL / AAMAS classification Table 4. Classifying full SIGIR / ACL / AAMAS papers, based on feature sets
Row
Accuracy in %
1
Majority
39.07
2
O
84.04
3
Q
61.17
4
VRN
53.69
5
VRS
50.98
6
PoS
82.66
7
ALL Sets
92.14
8
Weighted average F-Measure (ALL)
0.921
9
Mean absolute error (ALL)
0.0812
10
Root mean squared error (ALL)
0.2159
538
Y. HaCohen-Kerner et al.
/_in_letters (O)< 8.705E-4 | NNPS_normalized (PoS)< 0.002793 | | LS_normalized_by_sentences_count (PoS)< 0.0066665 | | | averageCharacterPerWords (Q)< 4.7439275 | | | | averageCharacterPerSentences (Q)< 43.436955: ACL(6/0) | | | | averageCharacterPerSentences (Q)>= 43.436955: AAMAS(15/3) | | | averageCharacterPerWords (Q)>= 4.7439275: ACL(553/29) | | LS_normalized_by_sentences_count (PoS)>= 0.0066665 | | | averageWordsPerSentences (Q)< 9.574204 | | | | oneWordsNormalized (V)< 0.348445: ACL(27/2) | | | | oneWordsNormalized (V)>= 0.348445 | | | | | LS_normalized (PoS)< 0.003799: AAMAS(14/5) | | | | | LS_normalized (PoS)>= 0.0037990: ACL(9/1) | | | averageWordsPerSentences (Q)>= 9.574204 | | | | FW_normalized_by_sentences_count (PoS)< 0.3156025: AAMAS(109/12) | | | | FW_normalized_by_sentences_count (PoS)>= 0.3156025: ACL(6/0) | NNPS_normalized (PoS)>= 0.002793 | | JJ_normalized_by_sentences_count (PoS)< 1.646307: AAMAS(604/10) | | JJ_normalized_by_sentences_count (PoS)>= 1.646307: ACL(9/2) /_in_letters (O)>= 8.705E-4 | POS_normalized_by_sentences_count (PoS)< 0.005435 | | NNPS_normalized_by_sentences_count (PoS)< 0.0370745 | | | /_in_words (O)< 0.0057915: SIGIR(15/2) | | | /_in_words (O)>= 0.0057915: ACL(48/9) | | NNPS_normalized_by_sentences_count (PoS)>= 0.0370745: AAMAS(22/1) | POS_normalized_by_sentences_count (PoS)>= 0.005435 | | CC_normalized (PoS)< 0.0301605 | | | NNPS_normalized (PoS)< 0.004654 | | | | ;_in_words (O)< 0.0038135 | | | | | oneStemsNormalized (V)< 0.2607845: ACL(7/2) | | | | | oneStemsNormalized (V)>= 0.2607845: SIGIR(24/2) | | | | ;_in_words (O)>= 0.0038135: ACL(12/1) | | | NNPS_normalized (PoS)>= 0.004654: AAMAS(9/2) | | CC_normalized (PoS)>= 0.0301605: SIGIR(505/22) Fig. 4. The decision tree developed for the SIGIR / ACL / AAMAS classification
5
Summary and Future Work
In this paper, we present a methodology for quantifying different types of writing based on orthographic, quantitative, vocabulary richness, and part of speech. This methodology achieves high accuracy results of 95.86%, 97.04%, 93.22%, and 92.14% for the following classification experiments: (1) SIGIR / ACL, (2) SIGIR / AAMAS, (3) ACL / AAMAS, and (4) SIGIR / ACL / AAMAS, respectively.
Classifying Papers from Different Computer Science Conferences
539
This paper represents a study of papers from six years of three A-level CS conferences, which belong to different research domains. We found that different conferences could be differentiated with more than 92% accuracy based on the feature sets, mentioned above. The PoS and the Orthographic sets were superior to all others. These initial results suggest that stylistic differences between venues can be quantified along the lines presented in this paper. In ongoing work, we are considering several directions based on these results. We have begun to consider different types of writing – both within additional scientific conferences and within generalized (real-world) writing. As the methodology we present is general, we are confident that we will be find similar distinctions between other corpora. Our longer-term goal is to facilitate an application to automatically review papers: both scientific and general. We envision that this result will allow conference organizers and editors to automatically recommend rejecting, accepting, or other consideration (e.g. poster). An equally interesting application is for authors themselves to understand how to write better papers through our model. We believe that this research direction is exciting and presents a fascinating approach for quantifying writing styles.
References 1. Androutsopoulos, I., Koutsias, J., Chandrinos, K., Paliouras, G., Spyropoulos, C.D.: An Evaluation of Naive Bayesian Anti-spam Filtering. CoRR, cs.CL/0006013 (2000) 2. Argamon, S., Shimoni, A.R.: Automatically Categorizing Written Texts by Author Gender. Literary and Linguistic Computing 17, 401–412 (2003) 3. Argamon, S., Koppel, M., Avneri, G.: Style-based Text Categorization: What Newspaper am I Reading? In: AAAI Workshop on Learning for Text (1998) 4. Argamon, S., Koppel, M., Pennebaker, J.W., Schler, J.: Mining the Blogosphere: Age, Gender and the Varieties of Self-expression. First Monday 12(9) (2007) 5. Breiman, L., Friedman, J.H., Olshen, R.A., Stone, C.J.: Classification and Regression Trees. In: Monterey, C.A. (ed.) Wadsworth & Brooks/Cole Advanced Books & Software (1984) ISBN 978-0-412-04841-8 6. Diederich, J., Kindermann, J., Leopold, E., Paass, G.: Authorship Attribution with support vector machines. Applied Intelligence 19(1-2), 109–123 (2003) 7. Dikli, S.: An Overview of Automated Scoring of Essays. Journal of Technology, Learning, and Assessment 5(1), 1–35 (2006) 8. Egghe, L.: Untangling Herdan’s Law and Heaps’ Law: Mathematical and Informetric Arguments. Journal of the American Society for Information Science and Technology 58(5), 702–709 (2007) 9. Foltz, P.W.: Latent Semantic Analysis for Text-based Research. Behavior Research Methods, Instruments and Computers 28(2), 197–202 (1996) 10. HaCohen-Kerner, Y., Beck, H., Yehudai, E., Mughaz, D.: Stylistic Feature Sets as Classifiers of Documents According to their Historical Period and Ethnic Origin. Applied Artificial Intelligence 24(9), 847–862 (2010a) 11. HaCohen-Kerner, Y., Beck, H., Yehudai, E., Rosenstein, M., Mughaz, D.: Cuisine: Classification using Stylistic Feature Sets and/or Name-Based Feature Sets. JASIST 61(8), 1644–1657 (2010b)
540
Y. HaCohen-Kerner et al.
12. Hall, M., Frank, E., Holmes, G., Pfahringer, B., Reutemann, P., Witten, I.H.: The WEKA Data Mining Software: an Update. ACM SIGKDD Explorations Newsletter 11(1), 10–18 (2009) 13. Hota, S.R., Argamon, S., Chung, R.: Gender in Shakespeare: Automatic Stylistics Gender Character Classification using Syntactic, Lexical and Lemma Features. In: Digital Humanties and Computer Science (DHCS) (2006) 14. Karlgren, J., Cutting, D.: Recognizing Text Genres with Simple Metrics using Discriminant Analysis. In: Proceedings of the 15th International Conference on Computational Linguistics, pp. 1071–1075 (1994) 15. Koppel, M., Argamon, S., Shimoni, A.R.: Automatically Categorizing Written Texts by Author Gender. Lit. Linguist Computing 17(4), 401–412 (2002) 16. Koppel, M., Schler, J., Argamon, S.: Computational Methods in Authorship Attribution. JASIST 60(1), 9–26 (2009) 17. Koppel, M., Schler, J., Argamon, S.: Authorship Attribution in the Wild. Language Resources and Evaluation 45(1), 83–94 (2011) 18. Lemaire, B., Dessus, P.: A System to Assess the Semantic Content of Student Essays. Educational Computing Research 24(3), 305–306 (2001) 19. Lim, C., Lee, K., Kim, G.: Multiple Sets of Features for Automatic Genre Classification of Web Documents. Information Processing Management 41(5), 1263–1276 (2005) 20. Luyckx, K.: Scalability Issues in Authorship Attribution. Ph.D. Dissertation, Universiteit Antwerpen. University Press, Brussels (2010) 21. Meretakis, D., Wüthrich, B.: Extending Naive Bayes Classifiers using Long Itemsets. In: Proceedings of the Fifth ACM SIGKDD International Conference on Knowledge Discovery and Data Mining (KDD), pp. 165–174. ACM (1999) 22. Novak, J., Raghavan, P., Tomkins, A.: Anti-aliasing on the Web. In: Proceedings of the 13th International Conference on World Wide Web (WWW), pp. 30–39. ACM (2004) 23. Pang, B., Lee, L.: Seeing Stars: Exploiting Class Relationships for Sentiment Categorization with Respect to Rating Scales. In: Proceedings of the 43rd Annual Meeting on Association for Computational Linguistics, pp. 115–124. Association for Computational Linguistics (2005) 24. Pang, B., Lee, L., Vaithyanathan, S.: Thumbs up?: Sentiment Classification using Machine Learning Techniques. In: Proceedings of the ACL 2002 Conference on Empirical Methods in Natural Language Processing (EMNLP 2002), vol. 10, pp. 79–86 (2002) 25. Porter, M.: An Algorithm for Suffix Stripping. Program 14(3), 130–137 (1980) 26. Rosenfeld, A., Zuckerman, I., Azaria, A., Kraus, S.: Combining Psychological Models with Machine Learning to Better Predict People’s Decisions. Synthese 189, 81–93 (2012) 27. Rokach, L., Maimon, O.: Data Mining with Decision Trees: Theory and Applications. World Scientific Pub. Co. Inc. (2008) ISBN 978-9812771711 28. Snyder, B., Barzilay, R.: Multiple Aspect Ranking using the Good Grief Algorithm. In: Proceedings of the HLT-NAACL, pp. 300–307 (2007) 29. Stamatatos, E., Kokkinakis, G., Fakotakis, N.: Automatic Text Categorization in Terms of Genre and Author. Comput. Linguist. 26(4), 471–495 (2000) 30. Stamatatos, E., Fakotakis, N., Kokkinakis, G.: Computer-based Authorship Attribution without Lexical Measures. Computers and the Humanities 35(2), 193–214 (2001) 31. Stamatatos, E.: Authorship Attribution based on Feature Set Subspacing Ensembles. International Journal on Artificial Intelligence Tools 15(5), 823–838 (2006) 32. Stamatatos, E.: Author identification: Using Text Sampling to Handle the Class Imbalance Problem. Inf. Process. Manage. 44(2), 790–799 (2008)
Classifying Papers from Different Computer Science Conferences
541
33. Stamatatos, E.: A Survey of Modern Authorship Attribution Methods. Journal of the American Society for information Science and Technology 60(3), 538–556 (2009) 34. Toutanova, K., Klein, D., Manning, C.D., Singer, Y.: Feature-rich Part-of-speech Tagging with a Cyclic Dependency Network. In: Proceedings of the 2003 Conference of the North American Chapter of the Association for Computational Linguistics on Human Language Technology (NAACL 2003), vol. 1, pp. 173–180. Association for Computational Linguistics (2003) 35. Tweedie, F.J., Baayen, R.H.: How Variable a Constant Be? Measures of Lexical Richness in Perspective. Computers and the Humanities 32(5), 323–352 (1998) 36. Witten, I.H., Frank, E.: Data Mining: Practical Machine Learning Tools and Techniques, 2nd edn. Morgan Kaufmann Series in Data Management Systems. Morgan Kaufmann (2005) 37. Yuan, Y., Shaw, M.J.: Induction of Fuzzy Decision Trees. Fuzzy Sets and Systems 69, 125–139 (1995) 38. Yule, U.: On Sentence Length as a Statistical Characteristic of Style in Prose with Application to Two Cases of Disputed Authorship. Biometrika 30, 363–390 (1938) 39. Zhang, L., Zhu, J., Yao, T.: An Evaluation of Statistical Spam Filtering Techniques. ACM Transactions on Asian Language Information Processing (TALIP) 3(4), 243–269 (2004)