Classroom sound can be used to classify teaching practices in college science courses Melinda T. Owensa,1, Shannon B. Seidelb,1, Mike Wongc,1, Travis E. Bejinesb, Susanne Lietza, Joseph R. Perezb, Shangheng Sita, Zahur-Saleh Subedara, Gigi N. Ackerd,e, Susan F. Akanaf, Brad Balukjiang, Hilary P. Bentona,h, J. R. Blaira, Segal M. Boazi, Katharyn E. Boyera,j, Jason B. Bramd, Laura W. Burrusa, Dana T. Byrda, Natalia Caporalek, Edward J. Carpentera,j, Yee-Hung Mark Chana, Lily Chena, Amy Chovnicki, Diana S. Chua, Bryan K. Clarksonl, Sara E. Cooperh, Catherine Creechm, Karen D. Crowa, José R. de la Torrea, Wilfred F. Denetclawa, Kathleen E. Duncanh, Amy S. Edwardsh, Karen L. Ericksonh, Megumi Fusea, Joseph J. Gorgan, Brinda Govindana, L. Jeanette Greeno, Paul Z. Hankampp, Holly E. Harrisa, Zheng-Hui Hea, Stephen Ingallsa, Peter D. Ingmirea,q, J. Rebecca Jacobsh, Mark Kamakear, Rhea R. Kimpoa,s, Jonathan D. Knighta, Sara K. Krauset, Lori E. Kruegeru,v, Terrye L. Lighta, Lance Lunda, Leticia M. Márquez-Magañaa, Briana K. McCarthyw, Linda J. McPheronx, Vanessa C. Miller-Simsa, Christopher A. Moffatta, Pamela C. Muicku,y, Paul H. Nagamia,g,z, Gloria L. Nussea, Kristine M. Okimuraaa, Sally G. Pasiona, Robert Pattersona, Pleuni S. Penningsa, Blake Riggsa, Joseph Romeoa, Scott W. Roya, Tatiane Russo-Taitbb, Lisa M. Schultheish, Lakshmikanta Senguptap, Rachel Smallcc, Greg S. Spicera, Jonathon H. Stillmana,j, Andrea Sweia, Jennifer M. Wadedd, Steven B. Watersw, Steven L. Weinsteina, Julia K. Willsiel, Diana W. Wrighte,ee, Colin D. Harrisonff, Loretta A. Kelleygg, Gloriana Trujillohh, Carmen R. Domingoa, Jeffrey N. Schinsked,h, and Kimberly D. Tannera,2 Department of Biology, San Francisco State University, San Francisco, CA 94132; bDepartment of Biology, Pacific Lutheran University, Tacoma, WA 98447; Center for Computing for Life Sciences, San Francisco State University, San Francisco, CA 94132; dDepartment of Biology, De Anza College, Cupertino, CA 95014; eNutrition, Food Science, and Packaging Department, San Jose State University, San Jose, CA 95192; fBiology Department, City College of San Francisco, San Francisco, CA 94112; gBiology Department, Laney College, Oakland, CA 94607; hDepartment of Biology, Foothill College, Los Altos Hills, CA 94022; iBiology Department, Las Positas College, Livermore, CA 94551; jRomberg Tiburon Center for Environmental Studies, San Francisco State University, Tiburon, CA 94920; kDepartment of Neurobiology, Physiology, and Behavior, University of California, Davis, CA 95616; lDepartment of Biological Science, Diablo Valley College, Pleasant Hill, CA 94523; mDepartment of Biology, Portland Community College, Portland, OR 97219; nMath and Sciences Department, Diablo Valley College, San Ramon, CA 94582; oScience and Technology Division, Cañada College, Redwood City, CA 94061; pBiology Department, College of San Mateo, San Mateo, CA 94402; qDivision of Undergraduate Education and Academic Planning, San Francisco State University, San Francisco, CA 94132; rLife Science Department, Chabot College, Hayward, CA 94545; sScience/Mathematics/Technology Division, Skyline College, San Bruno, CA 94066; tLife Sciences Department, Palomar College, San Marcos, CA 92069; uBiology Department, Solano Community College, Fairfield, CA 94534; vDepartment of Biological Sciences, California State University, Sacramento, CA 95819; wBiology Department, Los Medanos College, Pittsburg, CA 94565; xScience Department, Berkeley City College, Berkeley, CA 94704; yBiological Sciences Department, Contra Costa College, San Pablo, CA 94806; zDepartment of Biological Science, Holy Names University, Oakland, CA 94619; aaDepartment of Earth and Climate Sciences, San Francisco State University, San Francisco, CA 94132; bbDepartment of Curriculum and Instruction, STEM Education, University of Texas at Austin, Austin, TX 78712; ccDepartment of Chemistry and Biochemistry, San Francisco State University, San Francisco, CA 94132; ddDepartment of Biology, University of San Francisco, San Francisco, CA 94117; eeBiological, Health & Environmental Sciences Division, DeAnza College, Cupertino, CA 95014; ffSchool of Biological Sciences, Georgia Institute of Technology, Atlanta, GA 30332; ggKelley, Petterson, and Associates, Inc., San Francisco, CA 94127; and hhOffice of the Vice Provost for Teaching and Learning, Stanford University, Stanford, CA 94305 c
Edited by Bruce Alberts, University of California, San Francisco, CA, and approved January 31, 2017 (received for review November 20, 2016)
Active-learning pedagogies have been repeatedly demonstrated to produce superior learning gains with large effect sizes compared with lecture-based pedagogies. Shifting large numbers of college science, technology, engineering, and mathematics (STEM) faculty to include any active learning in their teaching may retain and more effectively educate far more students than having a few faculty completely transform their teaching, but the extent to which STEM faculty are changing their teaching methods is unclear. Here, we describe the development and application of the machine-learning–derived algorithm Decibel Analysis for Research in Teaching (DART), which can analyze thousands of hours of STEM course audio recordings quickly, with minimal costs, and without need for human observers. DART analyzes the volume and variance of classroom recordings to predict the quantity of time spent on single voice (e.g., lecture), multiple voice (e.g., pair discussion), and no voice (e.g., clicker question thinking) activities. Applying DART to 1,486 recordings of class sessions from 67 courses, a total of 1,720 h of audio, revealed varied patterns of lecture (single voice) and nonlecture activity (multiple and no voice) use. We also found that there was significantly more use of multiple and no voice strategies in courses for STEM majors compared with courses for non-STEM majors, indicating that DART can be used to compare teaching strategies in different types of courses. Therefore, DART has the potential to systematically inventory the presence of active learning with ∼90% accuracy across thousands of courses in diverse settings with minimal effort.
C
urrent college STEM (science, technology, engineering, and mathematics) teaching in the United States continues to be lecture-based and is relatively ineffective in promoting learning (1, 2). Undergraduate instructors continue to struggle to engage, effectively teach, and retain postsecondary students, both generally and particularly among women and students of color (3, 4). Federal analyses suggest that a 10% increase in retention of undergraduate STEM students could address anticipated STEM workforce shortfalls (5). Replacing the standard lecture format with more active teaching strategies has been shown to increase
Author contributions: M.T.O., S.B.S., M.W., J.N.S., and K.D.T. designed research; M.T.O., S.B.S., M.W., T.E.B., S.L., J.R.P., S.S., Z.-S.S., G.N.A., S.F.A., B.B., H.P.B., J.R.B., S.M.B., K.E.B., J.B.B., L.W.B., D.T.B., N.C., E.J.C., Y.-H.M.C., L.C., A.C., D.S.C., B.K.C., S.E.C., C.C., K.D.C., J.R.d.l.T., W.F.D., K.E.D., A.S.E., K.L.E., M.F., J.J.G., B.G., L.J.G., P.Z.H., H.E.H., Z.-H.H., S.I., P.D.I., J.R.J., M.K., R.R.K., J.D.K., S.K.K., L.E.K., T.L.L., L.L., L.M.M.-M., B.K.M., L.J.M., V.C.M.-S., C.A.M., P.C.M., P.H.N., G.L.N., K.M.O., S.G.P., R.P., P.S.P., B.R., J.R., S.W.R., T.R.-T., L.M.S., L.S., R.S., G.S.S., J.H.S., A.S., J.M.W., S.B.W., S.L.W., J.K.W., D.W.W., C.D.H., L.A.K., G.T., C.R.D., J.N.S., and K.D.T. performed research; M.T.O., S.B.S., M.W., J.N.S., and K.D.T. contributed new reagents/analytic tools; M.T.O., S.B.S., M.W., T.E.B., S.L., J.R.P., S.S., Z.-S.S., J.N.S., and K.D.T. analyzed data; and M.T.O., S.B.S., M.W., T.E.B., J.R.P., J.N.S., and K.D.T. wrote the paper. Conflict of interest statement: K.D.T., J.N.S., M.W., S.B.S., and M.T.O. have filed a provisional patent on the subject of this report, DART (US Provisional Patent Application No. 62/398,888). This article is a PNAS Direct Submission. Freely available online through the PNAS open access option. 1
M.T.O., S.B.S., and M.W. contributed equally to this work.
2
active learning assessment
| evidence-based teaching | science education | lecture |
www.pnas.org/cgi/doi/10.1073/pnas.1618693114
To whom correspondence should be addressed. Email:
[email protected].
This article contains supporting information online at www.pnas.org/lookup/suppl/doi:10. 1073/pnas.1618693114/-/DCSupplemental.
PNAS Early Edition | 1 of 6
PSYCHOLOGICAL AND COGNITIVE SCIENCES
a
Significance Although the United States needs to expand its STEM (science, technology, engineering, mathematics) workforce, United States postsecondary institutions struggle to retain and effectively teach students in STEM disciplines. Using teaching techniques beyond lecture, such as pair discussions and reflective writing, has been shown to boost student learning, but it is unknown what proportion of STEM faculty use these active-learning pedagogies. Here we describe DART: Decibel Analysis for Research in Teaching, a machine-learning–derived algorithm that analyzes classroom sound to predict with high accuracy the learning activities used in classrooms, and its application to thousands of class session recordings. DART can be used for large-scale examinations of STEM teaching practices, evaluating the extent to which educators maximize opportunities for effective STEM learning.
retention, and hundreds of millions of dollars have been invested by national and federal agencies to this end (2). Even for those students retained in STEM, active-learning pedagogies have been repeatedly demonstrated to produce superior learning gains with large effect sizes compared with lecture-based pedagogies (6–9). All of the evidence suggests that shifting large numbers of STEM faculty to include even small amounts of active learning in their teaching may retain and more effectively educate far more students than having a few faculty completely transform their teaching (10). The extent to which large numbers of STEM faculty are changing their teaching methods to include active learning is unclear. What proportion of United States STEM faculty use anything but lecture with question/answer (Q/A) of individual students? What is the probability that a student would encounter any active learning across all STEM courses in a single department or institution? To address these questions, one would need a measurement tool that could systematically inventory the presence and frequency of active learning not only in one course but also across dozens of departmental courses, multiple STEM departments, and thousands of colleges and universities. Currently available classroom observation tools [e.g., Teaching Dimensions Observation Protocol (TDOP), Reformed Teaching Observation Protocol (RTOP), Classroom Observation Protocol for Undergraduate STEM (COPUS), Practical Observation Rubric To Assess Active Learning (PORTAAL)] (11–14) require trained human observers and are not feasible for addressing questions at this scale. Previous research into using automatic classification of classroom activities largely focuses on K–12 education and has either required special recording equipment (15, 16), analyzed small numbers of teachers (17–19), or did not focus on active-learning pedagogies (17), making these methods insufficient for large-scale analysis of the presence of active learning in college classrooms. To meet this need, we developed DART: Decibel Analysis for Research in Teaching. DART is a machine-learning–based algorithm that can rapidly analyze thousands of audio-recorded class sessions per day, with minimal costs and without need for human observers, to measure the use of teaching strategies beyond traditional lecture in undergraduate STEM courses. Below we describe the development and validation of DART and report results from over 60 STEM courses drawn from community colleges and a 4-y university. Results Our key insight from observations of classroom environments was that nonlecture activities are typically associated with either unusually high noise levels (e.g., pair discussions, small group discussions) or unusually low noise levels (e.g., individual clicker question response, minute paper writing). This suggests that 2 of 6 | www.pnas.org/cgi/doi/10.1073/pnas.1618693114
variation in the sound level of a classroom may indicate variation in teaching strategies. To test this hypothesis, an initial 45 audio recordings from 8 instructors teaching different courses (Table 1, pilot group) were analyzed by extracting audio decibel levels at a 2-Hz sampling rate (every 0.5 s) and graphing sound waveforms. To analyze DART’s performance in diverse teaching settings, these instructors were purposefully drawn from an atypical pool consisting of people from many different institutions who had undergone over 40 h of professional development in scientific teaching. To determine if patterns of variation in waveforms correlated with activity types, a three-person team listened to all recorded class sessions and individually annotated them using six emergent annotation codes (lecture with Q/A, discussion, silent, video, transition, and other) (Table S1). Sound-level patterns in class sessions primarily using lecture with Q/A were visibly different from the patterns in class sessions with varied learning activities (Fig. 1 A and C). Developing an Algorithm to Automate the Classification of Classroom Noise. To develop DART, human annotations were used to design
and optimize a machine-learning–based algorithm that reports what types of activities are going on in a classroom based on sound waveforms. To do this task, we applied methods from the field of audio segmentation, which applies machine learning to classify sound into different categories based on statistical characterizations (20). Because some of the human annotation categories yielded waveforms that were statistically similar to each other, we collapsed the six human annotation categories into four activity prediction modes with distinct waveform profiles: single voice, multiple voice, no voice, and other. Lecture with Q/A and video were aggregated into the mode “single voice”; discussion and transition were aggregated into the mode “multiple voice”; silent was assigned to the mode “no voice”; and other was assigned to the mode “other” (Table S1). To prepare the classroom audio-recording waveforms for the optimization procedure, we tagged each 0.5-s sample of sound from each recording from the pilot group (640,152 samples in total) with three pieces of data: its label from human annotation (S for single voice, M for multiple voice, or N for no voice), the normalized mean volume of the 15-s window of audio around it, and the normalized SD in that window’s volume (Fig. S1A). Both the mean volume and the SD of the volume of each sample were normalized with respect to their class session. Then, to sort the samples into the four prediction modes (single voice, multiple voice, no voice, and other), we used an ensemble of binary decision trees comprised of four nodes connected serially. A binary decision tree is a series of decisions to either sort or not sort a given input into a certain category based on the values of the input. Here, the inputs were the 0.5-s samples of classroom audio, and the sorting decisions were based on each sample’s normalized mean volume and SD of the volume. In our tree, each node represented one activity prediction mode, and the nodes for each mode were connected in order of decreasing frequency from the pilot data, so Table 1. Overview of DART study participants Group Pilot group Community college Large-scale analysis Community college Four-year university All
Instructors Courses
Class sessions
Recorded hours (h)
8
8
45
65
27 22
35 32
712 774
970 750
49
67
1,486
1,720
Total number of instructors, courses, class sessions, and hours recorded in each group.
Owens et al.
Class session with only lecture and question/answer Human annotation Sound level (dB)
A
Sound level (dB)
B
Lec= Lecture with Question/Answer
90
Other
Lec
80 70 60 50
Sound level
DART prediction 90 80 70 60 50
Time (min)
Sound level
Single Voice
Multiple Voice
No Voice
Class session with varied learning activities Sound level (dB)
C
Lec
90
Silent Lec Transition=T
T Lec
Discussion
Video T
80 70 60 50
90 80 70 60 50
Time (min)
Sound level Sound level (dB)
E
Sound level (dB) Sound level (dB)
Single Voice
Multiple Voice
No Voice
(15 students) 90 80 70 60 50
F
G
PSYCHOLOGICAL AND COGNITIVE SCIENCES
Sound level (dB)
D
rge class (287 students) 90 80 70 60 50 Time (min)
DART learning activity footprints Thinking, writing, Pair or group Lecture with clicker response: discussion: question/answer:
Think (T)-Pair (P)-Share (S): T P S T P S
90 80 70 60 50
Time (min)
that the dominant class activity (single voice) was detected first, and less-frequent class activities follow (multiple voice, no voice, and other, in that order) (Fig. S1B). This ordering emphasized the importance of predicting the common activities correctly while allowing some prediction flexibility for the less-frequent activities. Next, we optimized the selection parameters that would determine which audio samples were sorted into which activity modes. To accomplish this, we used machine learning, specifically grid search (Fig. S1 C and D). Grid search is a brute-force method to select the optimal selection parameters for each mode by first evaluating each possible combination of the two selection parameters, the normalized average volume and the normalized average SD, and then choosing the pair of parameter values that yielded the model with the best match to human annotation, defined as the fewest number of errors. This grid search process was conducted three times—once Owens et al.
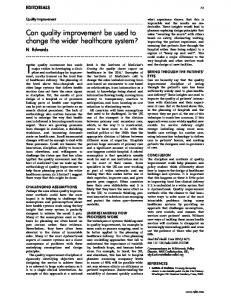
Fig. 1. Sound analysis can differentiate lecture and nonlecture classroom activities. All: Sound levels over time sampled at 2 Hz, with each tickmark indicating 2 min. Typical results are shown. (A) Class session with mostly lecture (94 min) with human annotation codes indicated above the waveform. (B) Background color indicates DART prediction for the recording shown in A. (C) Class session with varied learning activities (108 min) with human annotation codes indicated. (D) Background colors indicate DART predictions for recording in C. (E ) DART prediction, small class (n = 15 students; 98 min). (F) DART prediction, large class (n = 287 students; 49 min). (G) Examples of DART learning activity footprints from different class sessions: thinking, writing, or clicker response; pair or group discussion; lecture; think-pair-share.
each for single voice, multiple voice, and no voice—to find the optimal parameters for each activity prediction mode. For more details of the development of the DART algorithm, refer to SI Methods, Development of DART Algorithm with Machine Learning. We found that the resulting algorithm, DART, is able to classify each 0.5-s sample of a recording into one of three DART prediction modes: single voice, multiple voice, or no voice. (The final algorithm never categorizes samples as other, probably because the human annotation “other” was assigned only 0.9% of the time to a variety of instances that were difficult to categorize in the pilot data.) Single-voice samples, characterized by one person speaking at a time (e.g., lecture, question/answer, and so forth), were of average volume but high variance. Single voice typically indicated nonactive teaching strategies given that only a single active voice was heard, with all other individuals passively listening. In contrast, PNAS Early Edition | 3 of 6
multiple-voice samples, characterized by many people speaking simultaneously (e.g., pair discussions), were of high mean volume and low variance. No-voice samples, characterized by quiet throughout the classroom (e.g., silent writing), were of low mean volume and low variance. As verified by human annotations, multiple and no voice generally indicated active learning because many or all students actively were engaged in a task. DART Classifies Classroom Noise with High Accuracy. To assess the accuracy of DART, we compared DART’s classifications of classroom noise to the human annotations in various ways, both in the original dataset of 45 class sessions collected from 8 instructors and a new, larger dataset comprised of 1,486 class sessions collected from 49 instructors, representing 67 courses taught across 15 community colleges and a 4-y university, a total of 1,720 h of recordings (Table 1). Qualitatively, we saw that DART was able to differentiate between lecture and nonlecture classroom activities. For example, DART predicted a class session that was annotated as 98% lecture with Q/A to be solely single voice (Fig. 1 A and B) and a class session with varied activities, like silent writing and discussion, to have a variety of modes (Fig. 1 C and D). DART identification of varied learning activities was robust in both small and large classes (Fig. 1 E and F). Its predictions reveal that waveform “footprints” are indicative of specific teaching techniques (Fig. 1G). For example, the common active learning technique “think-pair-share” actually consists of three distinct activities in response to an instructor’s question to the class: first students silently think or write about the answer, then they discuss it in pairs or small groups, and finally some students share their responses individually with the class. A human would annotate these three phases, in order, as silent, discussion, and lecture with Q/A. Similarly, DART assigns no voice (think), multiple voice (pair), and single voice (share) (Fig. 1G). We also assessed DART’s accuracy quantitatively by measuring how often DART predictions matched the human annotations. In the original dataset used for optimizing the algorithm, DART classification matched the human annotations 90% of the time across all modes. In comparison, human annotators agreed with each other only 93% of the time, showing that DART was almost as accurate at identifying classroom activities as human annotators were. To see if this high rate of accuracy was retained in a new context, we randomly chose one class session from each of the 67 courses recorded as part of the new, larger dataset, performed human annotation, and compared DART’s classifications to the human annotation. We again obtained a very high accuracy of 87%, suggesting that DART can accurately applied to many different classroom contexts. To further assess DART’s ability to discern the presence of activities that may indicate active learning or traditional lecture, we used signal-detection theory to analyze DART’s accuracy by mode. In the original dataset, we used signal-detection theory to discriminate for each mode (single voice, multiple voice, and no voice) between correct inclusions (hits) and incorrect exclusions (misses) (21). We also used this method to determine the rates of correct exclusions (correct rejections) and incorrect inclusions (false alarms) for each of the three modes (21). The results are given in Fig. 2. DART correctly identifies nearly all instances of lecture and Q/A as single voice (hit rate = 98.0%) (Fig. 2A). In addition, the false-alarm rates for multiple voice and no voice are low (2.3% and