educationally purposeful activities is the single best predictor of their learning and ..... Later in the course, I pose the following question: âSuppose I could buy Banana .... software program on the instructor's laptop would then bundle student ...
Clickenomics: Using a Classroom Response System To Increase Student Engagement In a Large-Enrollment Principles of Economics Course Michael K. Salemi1 Department of Economics CB 3305, Gardner Hall University of North Carolina at Chapel Hill Chapel Hill, NC 27599-3305 This Draft: June, 2008, Original Draft: February, 2008
Abstract One of the most important challenges facing college instructors of Economics is helping students engage. Engagement is particularly important in the large enrollment Principles of Economics course where it can help students achieve a long-lived understanding of how economists use basic economic ideas to look at the world. In this paper, I report on how instructors can use Classroom Response Systems (clickers) to promote engagement in the Principles course. I draw heavily on my own experience in teaching a one semester Principles course at the University of North Carolina at Chapel Hill but also report on how others have used clickers to promote engagement. I conclude with evidence that students find clickers very beneficial and with an assessment of the costs and benefits of adopting a clicker system.
The image is cliché common. Hundreds of students, bored to the point of distraction, amuse themselves while their instructor drones on about topics that may be important but seem dreadfully dull. The picture of bored students contrasts sharply with George Kuh’s definition of effective education.2 “What students do during college counts more in terms of desired outcomes than who they are or even where they go to college. That is, the voluminous research on college student development shows that the time and energy students devote to educationally purposeful activities is the single best predictor of their learning and personal development.” (Kuh, p. 1) The dictionary definition of “engage” is to hold the attention of someone or to induce them to participate in something (Merriam Webster Online). For Kuh, “engage” means to hold the attention of students on course material and induce them to devote time and energy to educationally purposeful activities. In this paper, I define engage and engagement as Kuh does. One of the most important challenges facing college instructors of economics is implementing strategies that induce students to undertake activities through which they master course material at deep levels and in lasting ways. The challenge is especially difficult in large enrollment courses where students perceive that they have little or no opportunity to interact with the instructor. The challenge is particularly important in the Principles of Economics course because the majority of principles students will take no other economics course (Hansen, Salemi, and Siegfried, 2002, p. 469). Failing to meet the challenge results in students who gain a shortlived and shallow understanding of course concepts, one just sufficient to survive the final examination. Meeting the challenge can result in students who achieve a long-lived understanding of how economists use basic economic ideas to look at the world. For the past two years, I have taught a 425-student section of Principles of Economics at the University of North Carolina at Chapel Hill with a course plan that targets literacy (Hansen, Salemi and Siegfried (2002), Salemi (2005)). In the course, I use clickers as the cornerstone of my engagement strategy.3 In this paper, I explain how I use clickers to induce students to devote time and energy to educationally purposeful activities, that is, in ways that improve their understanding. Section 2 explains what clickers are, what other educators mean by engagement, and what educators have to say about the connection among learning, engagement and the use of clickers. Section 3 is the heart of the paper. It provides examples of clicker-based educational
2
strategies and explains why and how they induce students to work on course concepts in educationally constructive ways. Section 4 provides evidence that clickers have improved my course. The last section outlines the benefits and costs of using clickers.
CLICKERS AND ENGAGEMENT
The first order of business is to explain what clickers are, what other educators mean by engagement, and the connection among learning, engagement and clicker use. Clickers are handheld radio senders that students use as part of a classroom response system (CRS). Students use clickers to respond to prompts given by the instructor. The instructor collects student responses with a radio receiver connected through a USB port to the instructor’s computer. A CRS also includes software that organizes responses and stores them in a data base.4 The typical CRS allows the instructor to query students in either anonymous or identified modes and, in either mode, quickly produces histograms that show how students responded to the query. In the anonymous mode, specific student responses are neither identified nor retained. In the identified mode, the score deriving from each student’s response is stored in an electronic grade book. In the education literature, engagement has meant different things at different times. In the 1980's, educators used engagement to describe student willingness to participate in routine school activities (Chapman, 2003). Later, Skinner and Belmont (1993, p.14) defined an engaged student as one who “show(s) sustained behavioral involvement in learning activities accompanied by a positive emotional tone.” Pintrich and DeGroot (1990) expanded the definition to include student use of cognitive, meta-cognitive and self-regulatory strategies to guide learning. By the Pintrich and DeGroot definition, engaged students make conscious decisions to use their abilities and resources to improve their understanding of educational materials. Ahlfeldt, Mehta and Sellnow (2005) explicitly adopt the Kuh definition of engagement in that they use a selection of questions from the National Survey of Student Engagement to measure how fully physics students engage. The questions fall into three groups. The first group of questions asks students how frequently they participated in voluntary learning strategies such as asking questions in class and working with other students outside of class to complete
3
assignments. The second group asks students to what extent their course emphasized learning at different levels of Benjamin Bloom's (1956) taxonomy. Students who work at higher cognitive levels are judged to be more engaged. The third group of questions asks to what extent a course has contributed to life-learning skills such as the ability to write clearly, think critically and learn on one's own. Ahlfeldt, Mehta and Sellnow find that higher levels of student engagement can be achieved by implementation of problem based learning. They also find unsurprisingly that larger enrollment classes tend to be negatively correlated with student engagement. Carini, Kuh and Klein (2006) study the linkages between student engagement and student learning. They measure engagement with the National Survey of Student Engagement and learning with the RAND test (Klein et al, 2005), essay prompts on the Graduate Record Examination and college GPA. They use a data for 1058 students enrolled in 14 colleges and evenly distributed across all four college class levels. They find “…small but statistically significant positive correlations between student engagement and scores on the RAND and GRE tests….” both before and after controls for student characteristics and SAT scores were accounted for (p. 11). They conclude that student engagement, as measured by the National Survey, is linked positively to learning outcomes such as critical thinking. They also find that college students with the lowest SAT scores appear to benefit more from student engagement than students with the highest SAT scores. What does the literature say about the connection between clicker use and engagement? Wieman and Perkins (2005, p. 36) define effective physics instruction to be instruction that “…changes the way students think about physics and physics problem solving and causes them to think more like experts—practicing physicists.” They document that traditional lecture approaches are not effective because students quickly forget the important points. They explain that a better approach focuses each class session on fewer concepts, provides students with a structure that helps them organize the key concepts, and recasts problems into a form where students can appreciate their value. Wieman and Perkins argue that clickers “…can have a profound impact on the students’ educational experience” (p.42). In the Wieman and Perkins framework, clickers are effective because they induce students to talk to one another about common confusions or difficult ideas that are uncovered when the instructor prompts the class with well chosen multiple choice questions. When instructors use clickers correctly, they induce students to investigate their own
4
thinking about physics concepts by asking one another “Why does this make sense?” or “How could we test this?” Because Wieman and Perkins consider engaged students to be those who work actively with course concepts, I conclude that they too adopt the Kuh definition. Pollock and Perkins (2004) describe a revision of undergraduate physics education at the University of Colorado at Boulder. The reform has involved many different instructors and classroom settings. All implementations, however, have used clickers to induce collaborative learning in which students work together to answer questions. The curriculum revision has increased student learning. Students taught with the new curriculum record post-test gains of between 33 and 45 percent of pre-test scores where a traditional lecture approach results in gains of about 25 percent. Thus, Pollock and Perkins agree that using clickers appropriately both increases student engagement in Kuh’s sense and increases student learning of physics. Trees and Jackson (2007) report the results of a survey of 2637 students enrolled in six large enrollment courses in which clickers were used. Three courses were in astronomy, two in communication studies, and two in physics. Students answered the surveys in the last week of the course. The survey included 18 statements and students responded using a five-point Likert scale. A review of the survey items and consideration of the authors’ interpretation of their findings makes clear that their definition of student engagement agrees with that of Kuh. Five items asked students about their attitudes toward learning while six asked students whether the use of clickers led them to be more engaged in class. The first group included questions such as: “By using clickers in this class, I got feedback on my understanding of class material.” and “I pay attention to whether or not my answer to the clicker questions was right or wrong.” The second group included questions such as “Clicker questions encouraged me to be more engaged in the classroom process.” and “Sometimes during a class, students were asked to discuss material with each other. Because the class used clickers, we discussed the material more seriously.” The average response (on a five point scale) computed across students and questions in the first category was 3.7 with a standard deviation of 0.95 which Trees and Jackson interpret as student appreciation and approval of educational practices that promote active student involvement. The average response for the second category was 3.28 (0.82). Trees and Jackson show that students whose scores on learning attitudes were higher also had higher scores on the second group of questions. For example, the belief that feedback contributes to learning was a
5
“…significant positive predictor of students’ perception that clickers created an engaged, active learning environment” (p. 32). Students also agreed that “earning clicker points motivate me to come to class” (3.96, 1.23). The Trees and Jackson findings suggest that students approve of the use of clickers when instructors use clickers to create opportunities where students work actively with course material. Trees and Jackson report that one interpretation of their findings is that “…students see beyond the technology, to recognize the deeper issue of an instructor’s pedagogical commitments. Students may not respond positively if they do not see the use of clickers as necessary to an instructor’s pedagogical style” (p. 35). Fies and Marshall (2006) provide a review of the literature on classroom response systems and conclude that there is great agreement that use of a CRS promotes learning when coupled with appropriate pedagogical methodologies, in particular methodologies that lead students to be engaged in the sense of Kuh. Beatty (2004) concludes that use of a classroom response system can transform student learning. In particular, he says “By engaging their minds in class, (CRS) based instruction makes students active participants in the learning process…Students develop a more solid, integrated, useful understanding of concepts and their interrelationships and applicability” (Beatty, p. 5). Clearly, Beatty concludes that proper use of clickers leads to increased student engagement in the sense of Kuh. Should we expect that the use of clickers can enhance the Principles of Economics course? Hansen, Salemi and Siegfried (2002) argue that the Principles of Economics course should target economic literacy. Salemi (2005) suggests several specific strategies for converting the standard Principles course to one that targets literacy. Both papers argue that students will gain a more robust understanding of basic economic ideas if instructors focus their Principles courses on a shorter list of topics and use the recovered instructional and study time for exercises where students practice using economic ideas. To the extent that clickers help students apply economic concepts during class, gain feedback which helps them correct their misunderstandings, and combine with their peers in a discussion of economic ideas, there is every reason to believe that the appropriate use of clickers will be as successful in promoting engagement in the Principles of Economics course as it appears to have been in physics and astronomy.
6
Wieman and Perkins (2005, p. 36) argue that the science community should make science education “...relevant for a much larger fraction of the student population than in the past” because citizens who understand science will make better decisions about issues such as climate change and genetic modification. What Nobel Laureate Wieman desires for students of physics is similar to what many economists want when they say that the goal of economic education, especially in the Principles course, is to help students learn to “think like economists” about issues that are likely to be important in their lives.
CLICKER STRATEGIES FOR THE PRINCIPLES COURSE
In this section, I provide examples, in most cases from my own course, of strategies that use clickers to increase student engagement. I organize clicker strategies under five headings: Sampling Student Opinion, Asking Are-You-With-Me Questions, Acquiring Economic Data from Students, Peer Instruction Activities, and Games and Simulations.
Sampling Student Opinion In an educational context, sampling student opinions can be a useful tool for motivating student interest and for gauging the impact of a presentation. I devote the first lecture of my Principles course to opportunity cost and the benefit-cost principle. I begin the lecture by asking the students whether the aphorisms listed in Table 1 are true or false.5
Table 1 Sampling Student Opinion Percent Responding “True” Start of Class
End of Class
The best things in life are free.
52
32
The biggest part of the cost of college is tuition and fees.
44
12
Anything worth doing is worth doing well.
78
34
Life should be sustained at any cost.
42
19
Statement
7
The purpose of asking students whether “the best things in life are free” is, of course, to introduce them to “opportunity cost” and to make them sensitive to the special meaning of the word “free” in economics. It is heartening to learn that at the end of the lecture, the fraction of students who thought the best things in life were free fell from 52 to 32 percent. The purpose of asking students whether tuition and fees count for the biggest share of the cost of attending college is to make them aware of the opportunity cost of their time. For most students who pay in-state tuition and fees at UNC-CH, the opportunity cost of time is larger than the direct costs of college. Asking students whether anything worth doing is worth doing well helps introduce the benefit-cost principle which implies that for most activities marginal costs rise above marginal benefits before all possibilities are exhausted. Finally, asking students whether life should be sustained at any cost makes them aware that opportunity cost is relevant even when making decisions about preserving life. I point out to them that the opportunity cost of providing an expensive surgery to a poster-child patient may be withholding malaria treatment from thousands of other children. There are several reasons why using a survey like the above increases student engagement. First, the survey grabs attention because students are curious as to how their colleagues will respond. Second, the survey demonstrates that the instructor is interested in whether or not the subject matter of the course has an impact on how students think. Finally, use of the survey shows that economic concepts can be used to address problems and answer questions that students are interested in. It demonstrates that economic ideas are relevant. For all these reasons, my use of surveys is likely to induce students to work with the concepts of opportunity cost and the benefit cost principle. It is also valuable for me and for my students to learn how the lecture on opportunity cost and the benefit-cost principle changed the opinions of members in the class. I learn that I changed some, but not all, opinions which tells me that it is important to continue explaining these two basic concepts and illustrating their use. Students learn that many of their peers changed their opinion which signals that they judged the arguments presented in class to be convincing. Students also learn that the instructor cares what they think. What students learn from the opinion survey promotes their engagement in the course because it increases their motivation and signals that the course content is judged by other students to be relevant.
8
Displaying data on student opinions like that reported in Table 1 also creates teachable moments. Instructors can ask students who changed their minds why they did so. They can ask students who did not change their minds why they are holding on to their original view. Instructors can then decide whether to address concerns raised by the holdouts or underscore arguments made by the converts. Displaying the histogram also provides the instructors with an opportunity to show that they tolerate dissent. I use a variation on opinion sampling in the part of my course devoted to externalities and pollution. Students read Eight Great Myths of Recycling by Daniel Benjamin in which the author makes an economic case against mandatory recycling. To motivate interest and demonstrate the applicability of Benjamin's arguments, I hold a “town hall meeting” during class where students may speak for or against a proposition that was passed by the town of Carrboro, North Carolina, a nearby neighbor of Chapel Hill where many UNC students live. The proposition states: "Now, therefore, be it resolved by the Board of Alderman of the Town of Carrboro: The Board of Alderman supports the creation of a Zero Waste Plan in order to eliminate waste and pollution in the manufacture, use, storage, and recycling of materials" (Carrboro, 1998). After the town hall meeting, students vote on the proposition with their clickers. During my 2007 course, 72 percent of students voted against the proposition. The town hall meeting and subsequent vote promote student engagement because they allow students to use course ideas to replicate an actual public policy debate and provide an opportunity for them to win over their colleagues with their arguments. It is important to note that I conduct the vote in CRS anonymous mode and explain to students that using economic concepts correctly does not imply that every student will vote in the same way. Another variation of opinion sampling can be used in the parts of the course devoted to economic policy. The big monetary policy story of autumn 2007 was the Fed's reaction to the so called sub-prime lending crisis. On September 18, 2007, the Fed cut the federal funds rate by a larger-than-expected one-half point. It then cut the funds rate again by one quarter point on October 30 saying that this cut balanced the risks of inflation and unemployment. On November 28, 2007, Donald Kohn, vice chairman of the Fed Board of Governors, said that recent turbulence in the credit markets had “partly reversed some of the improvement in market functioning” that was seen in the weeks after the October 30 cut (Reddy, 2007). Many
9
market analysts interpreted Kohn's statement to mean that the Fed was planning another rate cut for December, 2007. Not all economists agreed that rate cuts were appropriate. Janice Revell of Money Magazine warned that "The Fed's actions could very well be ushering in a new era of inflation - and that is horrible news for your retirement portfolio" (Revell, 2007). Instructors can use clickers to prompt students to analyze what is at stake in a policy decision. After students read the news article about Kohn's speech and the opposing opinion of Revell, an instructor could ask students what the Fed should do. For example, the instructor could ask the clicker question presented in Table 2.
Table 2 Sampling Student Opinion about a Policy Issue
At its meeting in December 2007, the Federal Open Market Committee should... A. Lower the federal funds rate by one-half percent. B. Lower the federal funds rate by one-quarter percent. C. Leave the federal funds rate unchanged. D. Raise the federal funds rate by one-quarter percent. E. Raise the federal funds fate by one-half percent.
The instructor could also ask students to write an explanation of their choice in their notes. Forcing students to take a stand on a soon-to-be made decision by the Federal Reserve is an excellent way to promote engagement with the material. Depending on the timing, the instructor may be able to return to the issue after the policy authority has made its decision. The instructor could then compare the actual decision with student recommendations and the explanations written by students with those appearing in the media after the decision. The ratecut controversy occurred too late for me to take advantage of it. But it put me on the lookout for policy issues that are relevant to the course and are being discussed in the media as the course goes on.
10
Asking Are-You-With-Me Questions The most common use of clickers in the classroom is asking questions that help the instructor and students judge whether they have understood recently presented material. Asking are-you-with-me questions provides educational benefits and increases engagement in the sense of Kuh. First, asking are you with me questions provides an opportunity for students to talk with one another about the meaning of the question and the relative merits of the various options. The questions induce students to use their knowledge of course material. The inducement is effective—after I put a question to the class, there is a hum of activity as most students take the opportunity to converse with their neighbors. Second, when the correct answer is displayed, students receive feedback on whether or not they have understood the target concepts. Third, when the histogram of responses is displayed, the instructor receives feedback on how well students have understood the target concepts. Instructors can adjust their presentations by re-teaching the concept or by explaining why a popular wrong option is wrong. In my experience, students who chose a wrong option often ask about it after class providing another opportunity for the instructor to help them. Fourth, asking are-you-with-me questions creates an incentive for students to come to lectures and pay attention while they are there.6 Since I allow students to work together to answer the questions, it also provides an incentive for students to ask one another why one answer makes sense while the others do not. As I document in the next section, my students responded in a positive way to this incentive. For now, I emphasize that my students earn points by answering questions correctly, not by simply showing up. Fifth, asking are-you-with-me questions during lecture breaks the lecture into chunks (Saunders, p.90). I allow students to discuss the question among themselves before sending their answers. The questions serve as breaks during which students switch from passive to active mode and refresh themselves. The are-you-with-me questions are another way in which the use of a CRS system promotes engagement. Students learn that they are expected to be thinking during the lecture, explaining their reasoning to their neighbors and translating their thoughts into responses. Sixth, asking are-you-with-me questions allows the instructor to illustrate, in a small stakes setting, the level of mastery that he expects students to develop. Table three shows an are-you-with-me question that I ask during the first class of the semester.
11
Table 3 An Are-you-with-me Question from the Opportunity Cost Lecture
Raleigh Politicians have proposed a new convention center. They suggest paying for it by raising the hotel tax. They argue that the project will be free to voters since out-of-town visitors will pay for it. Which of the following best explains why the convention center is not free to Raleigh citizens?
A. The tax increase will cause a reduction in visits to Raleigh. B. Cost overruns are common with public projects. C. The marginal benefit of the project exceeds the marginal cost. D. The tax funds could be used for other projects.
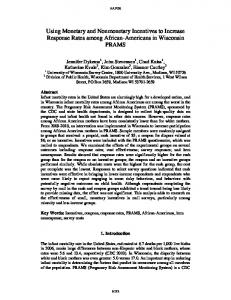
Students do not find this question easy. Only 52 percent answered correctly when I asked this question after explaining opportunity cost. Those who answered incorrectly distributed themselves evenly across the distracting options. The lesson here is that instructors can say that “decision makers face an opportunity cost when scarce resources have alternative uses” until they are blue in the face and some students will not be able to transfer these words into an understanding of what opportunity cost means in a new context. Asking are-you-with-me questions provides students an opportunity to practice using concepts in new settings. I invite readers interested in learning more about the are-you-with-me questions from my course to visit my web page. During Fall Semester 2007, I asked approximately ninety are-you-with-me questions during 25 lectures, an average of just under four questions per lecture. As a remedy for occasional response pad problems and student illness, I counted only the top 90 percent of each student's responses, summed those and scaled the total so that it accounted for ten percent of the course grade.7 Figure 1 gives the distribution of scaled scores.
[Insert Figure 1 about Here]
12
The figure shows that nearly 50 percent of students earned a grade between nine and ten (A) on the graded are-you-with-me questions while another 32 percent earned a score between 7.75 and 9 (B). I designed the rules so that a grade distribution like that in Figure 1 would result. In particular, I encouraged students to talk with their neighbors before deciding on their own response. I asked questions that were of medium difficulty as a way of encouraging students. And, I used the are-you-with-me scores as a measure of effort that would help students whose performance on examinations placed them near but below a grade cutoff.8
Acquiring Economic Data from Students In most economics courses, there is a disconnect between the examples used in class and applications of economics in real world settings. For example, in order to make demand and supply examples simple and diagrams easy to draw, text book authors typically assume linear relationships between the quantity demanded and price. An alternative is to conduct a market experiment using the CRS system that obtains student reservation prices and to use these data to derive a class demand schedule. Bergstrom (2007, p.7) describes a thought experiment in which he asks students: “What is the most you would be willing to pay to have an iPod if you didn't have one and couldn't get one any cheaper than this price?” While Bergstrom's thought experiment is useful, I believe students will report more accurately their reservation prices if they are confronted with an actual economic decision rather than a virtual one. Each semester I choose a good to auction off during the fifth class of the semester (when I first introduce demand and supply).9 This past semester I auctioned off a logo T-shirt from the University of California at Santa Cruz which displays the Banana Slug mascot of UC-SC. Most students recognize the shirt as one worn by John Travolta in the film Pulp Fiction. The shirt is not easily obtained in Chapel Hill. The auction is a second-price auction where the winner is the highest bidder but pays the second-highest bid to obtain the shirt. In a second price auction, it is rational to bid one's reservation price. Thus, using a second-price auction allows me to observe the reservation price of each student in the class. Before I conduct the auction, I explain the concept of “reservation price” and offer a number of examples. I also use a text, Frank and Bernanke (2007), which emphasizes that
13
reservation prices are the building blocks of demand and supply schedules. Students enter their bids (reservation prices) with their clickers.10 I have conducted this auction twice. The first time the winning bid was $35.50. The second time it was $32.00. Provided that no student wants more than one T-shirt, one can construct the class demand for a T-shirt from the collected bids. Figure 2 displays the demand schedule implied by the bids that students made in my course.
[Insert Figure 2 about Here]
The T-shirt auction is one of the most effective strategies I have ever used to teach economics.11 Every student in the class can see the price at which they entered the competition for the shirt. They can verify that the great majority of students in the class were willing to pay no more than $10.00 for the shirt but that a few valued it much more highly. At the end of the auction, once the winning bidder is identified and the shirt awarded,12 the time is ripe for a discussion about why reservation prices differ across students and whether the instructor somehow “ripped off” the winning bidder. When some students appear outraged that anyone would pay over $30.00 for the shirt, I ask the winning bidder why they bid so high and whether they would like to recant their bid. Invariably, the winner has a very good reason for their bid and does not want to recant. This discussion turns the auction into an opportunity to demonstrate that different students have different tastes and that “being different” is not the same thing as “being irrational.” The T-shirt auction data can also be used to illustrate price setting by a seller with market power. Later in the course, I pose the following question: “Suppose I could buy Banana Slug Tshirts for $12.00 each and face the demand schedule from the auction. What price should I set and how many shirts would I sell if I wanted to make as much profit as possible?” By assumption, the marginal cost of a shirt is $12.00. But what is the marginal revenue schedule implied by the class demand schedule displayed in Figure 2? The marginal revenue schedule is highly irregular in contrast to the straight line implied by the text-book linear demand schedule. In fact, it is folly to attempt to find the profit maximizing price by applying the first order condition. Instead, one can use excel to compute profit on a case by case basis. Doing so results in Figure 3. [Insert Figure 3 about Here]
14
A profit-maximizing shirt seller would charge $20.00 for a shirt, sell 18 shirts, and make a profit of $144.00. This extension to the T-shirt auction exercise is also valuable because it requires students to think outside the text-book box.13 Indeed, one student came up after class and questioned whether it made sense to use the demand schedule derived from the class auction as a basis for estimating the profitability of a multi-shirt sale. The student argued that the value of a shirt to members of the class would fall when they understood that the winner would not be the only student to acquire the shirt. The student said that the shirt came with “bragging rights” that would be lost with a multi-shirt sale. Clearly, at least one student was thinking deeply about the meaning of demand. Why does a data collection activity such as mine enhance student engagement? First, the data collection activity raises student interest in the concept of demand by showing that demand can be used to describe the preferences of the students in the class. Second, the irregular shape of the demand schedule provides opportunities for students to ask “What is going on?”
Peer Instruction Activities Mazur (1997) introduced peer instruction (PI), a teaching strategy designed to keep students engaged in a large enrollment lecture course. As clicker technology advanced, Mazur and others adapted PI so that it could be implemented with a classroom response system. In a CRS-PI classroom, lectures consist of short presentations on key concepts. Each presentation is followed by a concept test which asks multiple choice questions that students answer with clickers. After students record their initial answers to a question, the instructor displays the histogram of responses and invites students to discuss their answers with their neighbors and attempt to reach consensus as to the correct response. After several minutes, students re-answer the same question with their clickers and the instructor again displays the histogram of responses. The instructor then resumes the lecture with comments on the question and the responses. Crouch et al. (2007) report on what has been learned from teaching the non-majors introductory physics course with PI over the past ten years. They find that gains in student understanding are greatest when PI is combined with other strategies that increase student engagement and that most instructors have had success using PI. Lucas (2007) finds that the PI-
15
clicker combination is very effective in enhancing student engagement and learning in college calculus classes. Pollock and Perkins (2004) report similar finds for college physics classes. Ghosh and Renna (2007) describe a pilot project at the University of Akron in which clickers and PI were combined to teach courses in 23 departments by 45 instructors including one instructor who taught Principles of Microeconomics and another who taught Principles of Macroeconomics. Ghosh and Renna provide examples of concept test questions that they used and report that students responded to concept tests with enthusiasm. In an exit survey, over 70 percent of students agreed or strongly agreed that the concept tests reinforced important class concepts and increased their willingness to ask questions. Over sixty percent either agreed or strongly agreed that they would recommend continued use of the concept tests. Peer Instruction raises student engagement by inducing students to work together to figure out the answers to challenging questions. The use of peer instruction separates a class into mini-lectures separated by opportunities for students to work actively to master course concepts. How would an instructor implement PI with a classroom response system? The instructor would organize each lecture around several key concepts and write at least one multiple choice question that tests understanding of each concept. During class, the instructor would present the mini-lecture, ask one of the multiple choice questions and specify that students are to respond without discussing the question with others. The instructor would then display the histogram of responses and encourage students to discuss their answers with their neighbors in an attempt to reach consensus. After three to four minutes of discussion, the instructor would put the question again and students would again respond with their clickers. Finally, the instructor would display the new response histogram, preferably together with the original histogram, comment on the results, and resume the lecture. Ghosh and Renna report that the fraction of correct responses in their Principles courses typically increased between the first and second asking of a concept test question. When asked a question about shifts in aggregate demand and supply, 55 percent of students answered correctly in round one and 97 percent in round two. When asked a question about how to read profits from a schedule displaying price, marginal cost and average cost, 43 percent of students answered correctly in round one and 89 percent answered correctly in round two. What is the difference between peer instruction and are-you-with-me questions? There are two. First, PI questions should be more challenging than are-you-with-me questions. The PI
16
questions should target higher-order cognitive outcomes. For that reason, the questiondiscussion-question sequence is an essential part of PI activity but not an essential part of asking are-you-with-me questions. The Table 3 question is a good example of a PI concept test question targeted to "opportunity cost." Second, Mazur (1997) recommends that PI concept test questions not be graded. He argues that students are more willing to share ideas and learning is greater when grades are not involved in PI concept tests. Mazur's recommendation implies that instructors should separate concept tests from are-you-with me questions and use both during a typical lecture. By not grading the concept test questions, the instructor lessens the incentive for students to keep their understanding to themselves. By grading the are-you-with-me questions, the instructor provides an incentive for students to attend regularly and pay attention.14 Peer instruction activities increase student engagement precisely because they provide regular, structured opportunities for students to work actively on problems that use course concepts. In a small enrollment course, it would be desirable to use activities where students construct responses in written or oral form. In a large enrollment course, constructed response activities are not feasible but asking students to discuss the correct response to a well constructed multiple choice question induces them to work actively.
Games and Simulations Bergstrom (2007) suggests conducting classroom games, simulations and experiments with a CRS. He describes a traffic congestion game in which commuters drive between their homes in a factory town and the factory by one of two routes. Route A is shorter but subject to congestion as the number of commuters using it grows. Route B is longer and capable of handling unlimited users without an increase in travel time. Students are told to minimize their travel time and then are allowed to choose their route using their clickers. The game is calibrated so that travel time on route A is less than or equal to travel time on route B as long as 150 or fewer students choose route A. The game takes place over several trips. After each trip, the instructor observes the number of students who chose each route, computes travel times, reports these, and allows time for reflection. The instructor then allows students to choose their routes for the next trip.
17
Bergstrom finds that the number of students choosing the shorter but congestion prone route does not converge to 150 but oscillates around that value. When students learn that taking the shorter route leads to a shorter commute time, they are more likely to choose the shorter route. When they learn that choosing the congestion-prone route leads to a longer commute time, the number choosing the longer, constant-time route eventually increases. Bergstrom notes that this result is similar to results obtained by others who have run the traffic congestion game. While there is not yet available a mechanism for easily conducting games and simulations with a CRS, research is underway that is likely to provide one. The National Science Foundation recently funded a proposal by Charles Holt to extend “...clicker technology to classroom experiments by developing a web-based platform for clicker experiments” (Holt, 2007). In a clicker experiment, students would record their game plays with their clickers. A software program on the instructor's laptop would then bundle student responses and send them over the internet to a server. The server would use the data to compute outcomes, update the state of the game, and send relevant information back to the instructor's laptop. Finally, the instructor would report outcomes and the new state values to students and initiate a new round of the experiment. Adapting games and simulations to a classroom response system will further enhance the ability of clickers to increase student engagement. Games and simulations increase student interest and induce them both to figure out how to play the game and to make sense of the aggregated results of the game. Before concluding this section, I should point out that it is possible to administer in-class examinations with a classroom response system. I have not chosen to use CRS for examinations for two reasons. First, I can achieve all of the economies of grading a fixed response examination by having students mark their answers on a bubble sheet. Second, use of bubble sheets provides a written record of each student’s responses. I value a written record and ask students to also circle the correct answer on their question sheet. Having written records allows me to double check a student’s score at low marginal cost if the student claims that the electronically reported score is wrong.
18
DO CLICKERS INCREASE STUDENT ENGAGEMENT?
Fies and Marshall (2006) conduct a meta-study on the use of classroom response systems and conclude that there is great agreement that classroom response systems promote learning when coupled with appropriate pedagogies. Crouch et al. (2007, p.22) report that “...students grasp of the course material improves according to a number of different measures: two standard tests, the Force Concept Inventory and the Mechanics Baseline Test ...both during class and when tested for retention at the end of the semester.” The use of clickers in the Principles of Economics course is relatively new and I could find no studies that measure the impact of clicker use on student learning.15 My teaching assignment precludes me from teaching control and experimental sections of Principles. Readers may nevertheless be interested in less scientific evidence from my own course. Use of the clicker system raised attendance in my Principles course above the levels reported by colleagues who do not use the system. During Fall Semester 2007, I began the semester with 423 enrolled students enrolled. During the first week of classes, several students dropped the course while others added leaving the total at 423. I ended the semester with 406 students for a stick rate of 96 percent. I took attendance by clicker in 26 out of 29 class meetings. I did not take attendance with clickers on the first class day or on either of the two days when students sat for mid-semester exams. Of the students who stuck with the course, the average number of classes attended was 23.8 for an average attendance rate of 92 percent.16 In contrast, my colleagues at UNC who teach other sections of the large enrollment Principles course report average attendance rates of 70 to 75 percent on days without graded work. In my course, students receive no credit for attending class per se. They receive credit only for correctly answering are-you-with-me questions. It is clear that students responded to the attendance incentive implied by the small stakes quizzes. At UNC-Chapel Hill, Principles of Economics is taught as a one semester course. Students attend either two 75 minute or three 50 minute lectures and one 50 minute recitation per week. Graduate student teaching assistants (TA) teach recitations in sections of about 30 students each. One of the most difficult problems faced by TAs is coaxing students to participate in their recitations. Especially at the beginning of the semester, students are reluctant to talk and TAs
19
must work very hard to obtain any spoken contributions. The reality in the recitation sections of my Principles course is different. TAs report that students reach their first recitation meeting eager to talk about whether “life should be sustained at any cost” and whether “the best things in life are free.” I attribute the difference in student engagement in recitations primarily to the use of the CRS which encourages students to participate from the first day of class and signals to them that the instructor and TAs are paying attention to their views and performance.17 The willingness to speak is not limited to recitation. Students frequently ask questions during the lecture and are willing to repeat their questions when I bring the microphone to them. Students are also willing to respond to questions I put to them--even though they are answering in front of 400 other students. I do not contend that my 400 student course is as intimate as a 25 student seminar. I do believe that by using clickers I have created an environment in which students are more willing to discuss their ideas with their peers and speak out in front of the class. In the last class meeting, I asked students to complete the standard UNC-CH course evaluation. Our course evaluation allows the instructor to add questions and I asked students their views on the use of clickers in our course. I asked students to use a Likert scale to respond to four statements about engagement and the use of clickers. The pooled responses of my students for Fall 2006 and Fall 2007 are reported in Table 4. The number of responses ranged between 662 and 688.
Table 4 Student Evaluation of Clickers Numbers Are the Percent of Students Who Chose Each Response Statement The instructor effectively encouraged students to participate in this class. This course was designed to keep me engaged in learning. The use of clickers helped me to learn. The instructor should continue to use the clickers in the future.
20
SD
D
N
A
SA
2
8
15
49
26
4
11
16
49
20
2
6
7
48
36
3
5
8
44
40
Student support for the use of clickers is evident. Nearly 90 percent of students recommend their continued use and 69 percent agreed or strongly agreed that the course was designed to keep them engaged.
CONCLUSIONS
For many readers, the most important question about clickers will be: Does adoption of a classroom response system and the use of clickers pass a benefit-cost test? I conclude with an assessment of the costs and benefits for teaching Principles of Economics with clickers. Because I use the eInstruction system, I provide cost information for it. The costs of using a CRS are of two types: direct costs of the system and time costs for instructors and students. I assume that the instructor will use the CRS in a classroom with a projector that can be driven by a laptop computer.18 The direct costs of the system are the cost of the clickers themselves and the cost of registering them for use in the course. Students typically pay between $20.00 and $30.00 for their clickers. At UNC-CH, students purchase clickers at the campus bookstore for $21.35. Students may use clickers in multiple courses throughout their college career. For each clicker course, students pay a separate registration fee of between $6.00 and $15.00. Students may register clickers for an entire year or for four years at a flat rate. Typically, clicker companies provide the radio receiver and software for the CRS to instructors without charge. The larger costs are the time costs for instructors and students. In my view, a CRS system works best when the instructor is supporting lectures with PowerPoint presentations.19 The CRS system I use “sits” on top of my PowerPoint presentations. I engage a PowerPoint presentation from within the CRS and have available a CRS toolbar to initiate questions and display response histograms. Instructors who already use PowerPoint face two costs associated with the adoption of a CRS. First, instructors must design or redesign their lectures to allow for clicker activities. It is not sufficient simply to make space for clicker activities. It is necessary to organize or reorganize material in a way that exploits the educational benefits of using a CRS. For example, the auction
21
exercise described above has greater educational value if the instructor first presents “reservation prices” and explains the connection between reservation prices and a demand schedule. Second, instructors must create clicker activities. Here, I recommend a gradual approach. New users can begin by writing a few are-you-with-me questions for each lecture. They can next choose a few lectures where polling student opinion makes sense. They can then choose some lectures where peer instruction would help students better understand difficult but important concepts and write more challenging questions for peer instruction activities. Instructors who teach their courses without PowerPoint but want to adopt a classroom response system have two options. They can convert their lectures to PowerPoint or they can use the classroom response system solely for clicker activities. In the latter case, instructors switch between whatever display system they are using to support their lectures and the classroom response system each time they begin a clicker activity. Instructors who do not want to use PowerPoint would keep CRS minimized on their computer toolbar and bring it to the fore when they begin a clicker activity. Students face minimal time costs associated with the use of clickers. They must take the time to buy and register their clickers. They must take the trouble to bring their clickers to each class. Occasionally, they must trouble shoot problems with the clickers by replacing the batteries or visiting the CRS company web site. If they lose their clicker or if their clicker fails, students must take the time to replace it. One final cost is borne by both students and instructors—cheating. It is possible for a student to bring the clicker of an absent student to class and respond for that student as well as for himself. There is an honor code at UNC-CH and I carefully instruct students that using another student’s clicker is a violation of the honor code and that I will take action against any student I observe using more than one clicker. From time to time I ask my teaching assistants to count the number of students present and I compare the count to the number of clickers being used. So far, the counts have been in good agreement. Instructors are different and readers must decide for themselves whether the benefits of using clickers outweigh the costs. For me, the answer is “yes.” Indeed, it is my view that the current generation of CRS is the most important advancement in education technology to occur in the past 30 years. I hold this view because, unlike no other technology, the use of clickers allows the instructor to create two-way communication in a class of several hundred. With
22
clickers, it is possible to prompt students in ways that keeps them engaged. Before clickers, it might have been possible for a talented lecturer to hold student attention but it would have been difficult for that same lecturer to help students move from passively listening to actively thinking about the presented ideas.
NOTES 1
The author thanks and indemnifies W. Lee Hansen, Mark Maier, KimMarie McGoldrick, Michael Watts and the referees for helpful comments on an earlier draft. He thanks seminar participants at the Stavros Center, the University of Memphis, and the Teaching Innovations Program for helpful comments on presentations that gave rise to this paper. He also thanks his teaching assistants: Natta Akapaiboon, Basak Altan, Emanuel Bello, Gwen Clark, Michael Darden, Seth Glazer, Zhicheng Guo, Philip Jackson, David Jones, Zongqiang Liao, Rebecca Martin, Portia Obeng, Teresa Perez, Lauren Raymer, Sarah Simon and Nat Tharnpanich. 2
George Kuh is Director of Indiana University’s Center for Postsecondary Research which is home to the National Survey of Student Engagement. 3
Interested readers can view my syllabus, PowerPoint slides, and clicker exercises at www.unc.edu/~salemi/Econ101.html. 4
Classroom response systems are an educational adaptation of audience response systems. Firms use audience response systems to conduct sales meetings, hold focus groups, test new products, and conduct planning and team building sessions. Previous generations of classroom response systems used infrared technology which is generally regarded as inferior to the radio technology currently available. The author uses the Classroom Performance System offered by eInstruction. Other examples of classroom response systems are the Turning Point system offered by Turning Technologies, the H-ITT System offered by Hyper-Interactive Teaching Technology, and PRS Interwrite, which has recently merged with eInstruction. The Center for Teaching at Vanderbilt University publishes a particularly informative on-line guide to classroom response systems (Bruff). 5
I learned this strategy from Robert Reinke.
6
In a small enrollment section, instructors can take attendance manually at small cost. In large enrollment sections, the cost of manual attendance taking is huge.
7
At UNC, the add period for classes lasts only one week and I declined to extend it. Counting only the top 90 percent of each student’s responses allowed me to decline to be involved in occasional response pad problems or excused absences. I told students at the beginning of the course that they had ten percent “grace” and should use it carefully. Nevertheless, as I show in the next section, students overwhelmingly approved of the use of clickers in the course.
23
8
Econ 101 at UNC-CH requires students to attend two 75 minute lectures and one 50 minute recitation per week. Recitations are supervised by graduate teaching assistants. Each recitation section includes about 25 students. I based grades in my Principles course on a student's total score out of 100 possible points: 25 for each of two midterm exams, 30 for the final exam, and 10 each for recitation and CRS assessments. The recitation grade was based on two quizzes, a journal in which students explained how economics applied to several news articles, and a component that measured how often and well students contributed to discussion in their recitation sections. The course grade distribution was A (13%), B (51%), C (26%), D (8%) and F (2%). 9
Because I target my Principles course to improve the economic literacy of students, I devote four lectures to opportunity cost, the benefit cost principle and comparative advantage. A copy of my syllabus is available on my course web page.
10
The eInstruction CRS system allows students to enter floating point number responses.
11
I have used sealed bid auctions for many years in small enrollment courses to good effect. It is only via clickers that I have been able to use auctions in large enrollment courses. 12
I award the shirt to the winning bidder immediately at the conclusion of the auction. I accept the bidders promise to pay at the beginning of the next class if necessary. I always insist on payment for the shirt and make a show of receiving that payment. It is essential that everyone understands that the transaction is real.
13
In an honors section of principles or in an intermediate microeconomics course, I would give the data to the students and ask them to find the profit maximizing price and quantity. I judged that such an exercise was outside the curriculum for my literacy targeted course. 14
In my own class, I have yet to implement peer instruction but intend to do so when I next teach the course. I intend to assess the value added of peer instruction concept tests in a course that routinely asks graded are-you-with-me questions. 15
Calhoun and Barber (2007) study the impact on final course grade of using different clickerbased instructional strategies. In their study, both control and experimental groups use clickers. In the control group, students answered standard (are-you-with-me) multiple choice questions. In the experimental group, students answered standard questions, diagnostic questions where students assess their knowledge of a content area, and "think-pair-share" questions where students engage in PI. They find that a significant positive effect to participation in the experimental section. They also find that students who did better in clicker assessments did better in other graded work.
16
Absences were concentrated among a few students. The median number of classes attended was 25 of 26 and 83 percent of students were present at 23 classes or more. Only eight percent of students were marked present at fewer than 20 classes. As remarkably good as these attendance
24
data are, they slightly understate true attendance because students who forgot their clickers or had a clicker malfunction were not marked present by the CRS. 17
It could be argued that the enthusiasm observed by my teaching assistants is due to the questions themselves rather than the use of clickers. I disagree. I have been asking provocative questions for years but detected an increase in enthusiasm only when I began using clickers. It could also be argued that I have been blessed with extraordinary teaching assistants. But the teaching assistants themselves reported that students were more energetic in their recitations for my course than they were in recitation sections of other courses. 18
If the classroom projector is driven by a classroom CPU, it will be necessary for the instructor to install the CRS software on the classroom computer. Because the software will keep the grade book for the course on the computer where the software is installed, it will be essential for the instructor to password protect the CRS files and to download backup copies of the grade book via a flash drive. 19
Sosin et al. (2004) find that the use of PowerPoint presentations is negatively correlated with learning as measured by the Test of Understanding in College Economics but make no allowance for how PowerPoint is used. It may be that the use of PowerPoint is positively correlated with a “stand-and-deliver” approach to teaching. If that is so, one might expect that using clickers in conjunction with PowerPoint would reverse the negative correlation finding. None of the educational literature attributes the learning benefits of clickers to the fact that use of clickers is frequently combined with the use of PowerPoint and it bears repeating that one can use clickers independently of PowerPoint.
REFERENCES Ahlfeldt, Stephanie, Sudhir Mehta, and Timothy Sellnow (2005), “Measurement and Analysis of Student Engagement in University Classes Where Varying Levels of PBL Methods of Instruction Are in Use,” Higher Education Research and Development, 24 (1), 5-20. Beatty, Ian (2004), “Transforming Student Learning with Classroom Communication Systems,” EDUCAUSE Center for Applied Research, Boulder Colorado, Research Bulletin, 2004 (3). Benjamin, Daniel K. (2003), Eight Great Myths of Recycling, PERC, Bozeman, Montana. Bergstrom, Ted (2007), “Teaching Economics Interactively: A Cannibal's Dinner Party,” University of California eScholarship Repository, http://repositories.cdlib.org/ucsbecon/berstrom/2007c. Bloom, Benjamin S. (ed.) (1956), Taxonomy of Educational Objectives: The Classification of Educational Goals: Handbook I, Cognitive Domain, New York: Longmans Green.
25
Bruff, Derek, “Classroom Response Systems,” Vanderbilt University Center for Teaching, http://www.vanderbilt.edu/cft/resources/teaching_resources/technology/crs.htm. Calhoun, Joseph and Kimberly Barber (2007), “The Impact of Personal Response System Instructional Strategies on Student Performance,” Florida State University Working Paper. Carini, Robert, George Kuh, and Stephen Klein (2006), “Student Engagement and Student Learning: Testing the Linkages,” Research in Higher Education, 47 (1), 1-32. Carrboro, North Carolina (1998), “A Resolution Supporting Creation of a Zero Waste Plan,” http://www.grrn.org/zerowaste/CZWRes.html. Chapman, Elaine (2003), “Assessing Student Engagement Rates,” Eric Digest, ERIC Clearinghouse on Assessment and Evaluation, ED482269. Crouch, Catherine H., Jessica Watkins, Adam P. Fagen and Eric Mazur (2007), “Peer Instruction: Engaging Students One-on-one, All at Once,” in Redish, E. F. and P. Cooney (eds.), Research-Based Reform of University Physics, 1 (1), http://www.compadre.org/PER/per_reviews/volume1.cfm. Fies, Carmen and Jill Marshall (2006), “Classroom Responses Systems: A Review of the Literature,” Journal of Science Education and Technology, 15 (1), 2006, 101-09. Frank, Robert H. and Ben S. Bernanke (2007), Principles of Economics, McGraw-Hill/Irwin, New York. Ghosh, Sucharita and Francesco Renna (2007), “Using Electronic Response Systems in Economics Classes,” University of Akron Working Paper, September, 2007. Hansen, W. Lee, Michael K. Salemi and John Siegfried (2002), “Use It or Lose It: Teaching Literacy in the Economics Principles Course,” American Economic Review, Papers and Proceeding of the American Economic Association, 92 (2), 463-72. Holt, Charles (2007), “Using Clicker Technology for Large-Scale Classroom Experiments in Econommics,” Proposal 0737472, National Science Foundation. Klein, S.P., G. D. Kuh, M. Chun, L. Hamilton, and R. Shavelson (2001), “An Approach to Measuring Cognitive Outcomes Across Higher Education Institutions,” Research in Higher Education, 46 (3), 251-76. Kuh, George (2003), “The National Survey of Student Engagement: Conceptual Framework and Overview of Psychometric Properties,” NSSE Website, http://nsse.iub.edu/pdf/conceptual_framework_2003.pdf.
26
Lucas, Adam (2007), “Using Peer Instruction and I-Clickers to Enhance Student Participation in Calculus,” St. Mary's College of California Working Paper, http://dillgroup.ucsf.edu/~alucas/. Mazur, Eric (1997), Peer Instruction: A User's Manual, Prentice Hall, Englewood Cliffs, N. J. Pintrich, Paul R. and Elisabeth V. De Groot (1990), “Motivational and Self-regulated Learning Components of Classroom Academic Performance,” Journal of Educational Psychology, 82 (1), 33-40. Pollock, Steve and Kathy Perkins (2004), “Increasing Student Engagement in Large Classes: A Departmental Case Study,” Forum on Education of the American Physical Society, http://www.colorado.edu/physics/EducationIssues/pollock/FEDarticle_sp04.pdf. Reddy, Sudeep (2007), “Fed's Hints of a Rate Cut Cheers Markets,” Wall Street Journal, November 29, 2007, Page A1. Revell, Janice (2007), “Why the Fed's Rate Cut Should Scare You,” Money Magazine, November 2, 2007, http://money.cnn.com/2007/11/02/pf/retirement/revell.moneymag/ Salemi, Michael K. (2005), “Teaching Economic Literacy: Why, What and How,” International Review of Economics Education, 4 (2), 46-57. Sosin, Kim, Betty Blecha, Rajshree Agarwal, Robin Bartlett, and Joseph Daniel (2004), “Efficiency in the Use of Technology in Economic Education: Some Preliminary Results,” American Economic Review, Papers and Proceeding of the American Economic Association, 94 (2), 253-58. Saunders, Phillip (1998), “Learning Theory and Instructional Objectives,” in Walstad, William and Phillip Saunders (eds.), Teaching Undergraduate Economics: A Handbook for Instructors, Irwin/McGraw-Hill, New York. Skinner, Elizabeth A. and M. J. Belmont (1993), “Motivation in the Classroom: Reciprocal Effects of Teacher Behavior and Student Engagement across the School Year,” Journal of Educational Psychology, 85 (4), 571-81. Trees, April and Michele Jackson (2007), “The Learning Environment in Clicker Classrooms: Student Processes of Learning and Involvement in Large University-Level Courses Using Student Response Systems,” Learning, Media and Technology, 32(1), 21-40. Wieman, Carl and Katherine Perkins (2005), “Transforming Physics Education,” Physics Today, 58 (11), 36-41.
27
Figure 1 Are-you-with-me Question Score Distribution 0.50
0.40
0.30
0.20
0.10
0.00 0-6
6-6.5
6.5-7.75
28
7.75-9.00
9-10
Figure 2 Student Demand for UC-SC T-Shirt
32.00 28.00 24.00
Price
20.00 16.00 12.00 8.00 4.00 0.00 0
50
100
150
200
250
Quantity of T Shirts
29
300
350
400
Figure 3 Potential Profit from Econ 101 T Shirt Sale
$140.00
Q=18, P=20, Revenue=$360, Cost=$216, Profit=$144
$120.00 $100.00 $80.00 $60.00 $40.00 $20.00 $0.00 0
5
10
15
20
25
30
Quantity of T‐Shirts
30
35
40
45
50