Client Side Estimation of a Remote Service Execution Francesco Lelli, Gaetano Maron
Salvatore Orlando
Istituto Nazionale di Fisica Nucleare, Laboratori Nazionali di Legnaro (INFN-LNL) Legnaro (Padova), Italy [Francesco.Lelli Gaetano.Maron]@lnl.infn.it
Dipartimento di Informatica, Università Ca Foscari Venezia Venezia, Italy
[email protected]
Abstract— many use cases, concerning the monitoring and controlling of real physical instruments, demand deep interaction between users and services that virtualize the access to such instruments/devices. In addition, in order to realize high interoperable solutions, SOA-based Web/Grid Service technologies must be adopted. When the access to one of these services is performed via internet using a Web Service call, the remote invocation time becomes critical in order to understand if an instrument can be controlled properly, or the delays introduced by the wire and the serialization/deserialization process are unacceptable. This paper thus presents methodologies and algorithms, based on a 2k factorial analysis and a Gaussian Majorization of previous service execution times, which enables the estimation of a generic remote method execution time. Furthermore it suggests three different software architectures, where the developed algorithms and methodology could be integrated in order to automatically profile the end-toend service. It is worth noting that our proposals are validated using suitable benchmarks and extensive tests coming out from a real (not simulated) environment. In addition, the outcome of this paper have been used in the realization of a service for remote control, monitor, and manage of a pool of instruments/devices. Keywords-Web Servic, Quality of Service, Grid, Response Time
I.
INTRODUCTION
From a general point of view, the capability of correctly estimating the Response Time (RT) of a given task/job submission makes it possible to realize systems with Quality of Service (QoS) properties [9]. Our interest in investigating the RT of Web Services (WSs) come from several specific use cases [1], [6], dealing with the remote control of many real physical instruments and sensors. We aim at encapsulating these instruments and sensors in a service component with QoS properties, the Instrument Element (IE) [31], [32], to be integrated in a classical Computational/Data Grid. The IE has been successfully exploited to design several pilot applications of our GridCC project [10], and its implementation is based on SOA-based WS technologies, in order to fulfill the requirement for high interoperability with other Grid-based services. The same use cases raised the need for a deep interaction between users and the virtualization of physical devices, instruments and sensors, where users are not only humans, but also running programs. In particular, this often requires fast and predictable operations to monitor and control sensors, thus asking for some QoS guarantees in terms of service RT. Consider that when the access to a service is performed The GridCC project is supported under EU FP6 contract 511382.
remotely, e.g., via internet using Web Services calls, the correct prediction of the service invocation time becomes critical in order to understand whether an instrument can be controlled properly, or the delays introduced by the wire and the serialization/deserialization process [7] are unacceptable. In general, services with QoS properties, whose RT can be reliably predicted, can also be useful to realize self-organizing autonomic systems [8], where such estimations can be exploited by the clients of a bag of identical services to balance their workloads. Note that, since no real time Web Service engine has been so far produced, a Service Requester cannot negotiate a particular remote method execution, but we can still try to estimate the execution time of a remote method. As will be formalized in Section 3, this estimation is not trivial and quite more important in real time, near real time, as well as in interactive distributes application like ours. Even if all the issues and solutions presented and discussed have been and exploited during the design and implementation of our IE [31],[32] any application based on Web and Grid Services that exhibits the same requirements can benefit from them.The rest of this paper is organized as follows: Section 2 presents the state of the art in this open research topic. Section 3 formalizes the problem, while Section 4 describes a methodology based on 2k factorial analysis [30] and on a Gaussian approximation of the collected data, which enables the estimation of a remote method execution time. Section 5 validates the problem formalization of Section 3 with experimental results while Section 6 validates the proposed methodology in concrete scenarios. Section 7 suggests three different software architectures, where the developed algorithms and methodology could be integrated in order to automatically profile the end-to-end service. Finally in Section 8 we draw our conclusions. II.
RELATED WORK
In [11] Ran proposes a new Web services discovery model based on UDDI, in which the functional and non-functional requirements (e.g. QoS) are taken into account for ranking services during discovery. In [12] the authors propose a fault tolerant solution, and in [13] a performance prediction for distributed systems based on Web service technology by extending the UDDI. In [14] the authors address service selection coupled with a QoS ontology proposing architecture based on an agent framework. In [15] a QoS-based composition service and delivery framework, called QUEST, is presented, along with efficient approximate algorithms to optimally compose service paths under multiple QoS constraints. In [16] Chia et al. propose a service composition architecture that optimizes the aggregate bandwidth utilization
within an operator's network, while in [17] Cardoso et al. present a predictive QoS model that makes it possible to compute the QoS for workflows based on atomic task. Finally in [18] the authors study the Web Service end-to-end QoS, proposing a centralized broker that is responsible for coordinating individual service components to meet the quality constraint for the client. We need to note that all these researches focused their attentions on techniques and/or architectures that assume that the WS RTs are known, and they leave their estimation to future investigation. In addition, some works assume as instantaneous and costless the propagation of the QoS information between the systems peers [11], [15] [17], [18]. III.
CRITICAL TIMES IN A REMOTE PROCEDURE CALL
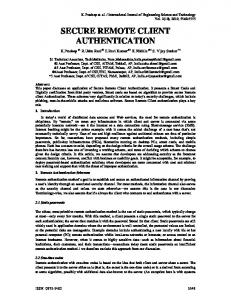
Most of the WS requests are performed across a LAN or internet. So the network channels have an important role during a remote WS method invocation, and it can deeply influence the Responce Time. Several projects [19], [20], [21], [22] tried to estimate the end to end network QoS between two remote devices. Unfortunately, as shown in [7], not only the wire influences the performance of a WS invocation, but also the serialization and deserialization process on both the server and client side. Finally, the cost of the method invoked on the server side has an important role too. From a generic point of view a remote method invocation can be split into 7 crucial parts [23], as explained in figure 1. During the interval t1-t0 the client serializes the invocation input in SOAP format and sends it during the interval t2-t1. The remote peer receives the serialized message at time t2 and starts the deserialization process that finishes at time t3. During the interval t4-t3 the remote method is executed and the output is produced. As its last operation, the remote services serialize the output in SOAP format during the interval t5-t4 and starts sending it. The invoker receives the serialized message at time t6 and during the interval t7-t6 starts deserializing the output message in the proper data structure. t0
t8
Proc
t7
Ser
Deser
Client side
t1
t6
Trans
Trans Net.
t2
t5
Deser
Ser
t3 Operation execution t4
Service side
Figure 1. Critical Intervals in a Web Service invocation
According to this time division presented in Figure 1, from the client QoS point of view, we can identify 3 critical times intervals, that are: (i) t7-t0 Remote Method Execution (tex), (ii) t4-t0 Remote Method Processing (tpt), (iii) t3-t0 Remote Method Invocation (One Way) (tow).The t7-t0 interval represents the total execution time of a remote invocation. In other words, in a synchronous method invocation, the time that the invoker waits before starting to process the output of the remote invocation. The t3-t0 represents the remote procedure execution delay that is introduced by the serializationdeserialization process. This is particularly important in OneWay [24] invocation method. Finally t4-t0 is the time needed
to complete the remote elaboration process. In Notification base systems [24], it represents the minimum time before the first reception of a notification. It is worth noting that no real time WS framework has been deployed so far. Therefore, even if a Service Requestors cannot negotiate a particular service, it still can try to estimate the execution time of a remote method invocation. In order to give an intuitive idea of the problems difficulty, we can note that all critical intervals (t3-t0, t4-t0, and t7-t0) depend on both server and client status. In addition, due to the clock synchronization problems [25], some intervals (t3-t0, t4-t0) cannot be estimated without allowing cooperation between these 2 peers. An additional remark is related to interval t4-t3, which represents the execution time of a remote method. In this study we assume that it is possible to access to a proper characterization, in terms of complexity and execution time, of these methods, as a function of the some factors [26] like input data and/or harware/software platform. Such characterization, i.e. its cost model, can be provided by the programmer of the method, or can be got by profiling the execution of the method. A. Factors that Influence a Remote Method Invocation Generally speaking, the execution time of a method depends on several factors. First of all, the algorithm complexity, particular input parameters that could modify its behavior and the hardware/software of the machines where either the service or the client runs. In addition, other important Parameter
Type
Label
Hardware Client Side
Static
A
Hardware Server Side
Static
B
Software Layers Client Side
Static
C
Software Layers Server Side
Static
D
Client Load
Dynamic
E
Server Load
Dynamic
F
Algorithm of the Method
Semantic
G
Semantic
H
Input Size
Run Time Static
I
Input Type
Run Time Static
L
Output Size
Run Time Static
M
Output Type
Run Time Static
N
Network channel bandwidth
Dynamic
O
Network channel delay
Dynamic
P
Key Factor that change the algorithm behavior
Table1. Factors That Influence a Remote Method Call
factors are the machines load, the software layers used, the actual network bandwidth available, and the network delay. Finally, other method parameters, like the input and output data, in particular its size and type, could have a crucial impact on the effective execution time of a method. The Table 1 summarizes the mentioned factors. Parameters like A, B, C and D can be considered static, since they depend on hardware and software change. Parameters G and H, as discussed above, are
associated with specific cost models. Factors like I, L, M and N can be considered known before starting the method execution even if, from a general point of view, M could be known only before time t4. Finally parameters like E, F, O and P can be considered fully dynamic and, in general, out of the program control. Section 5 validates this problem formalization and provides a Training Dataset that has been used in Section 4 in order to propose a methodology and an algorithm. These last are based on 2k factorial analysis and on a Gaussian Majorization (and not Estimation) of the collected data that enables the estimation of a remote method execution time. IV.
ESTIMATION OF A REMOTE METHOD EXECUTION
In this section we propose a method that predicts the execution time of a remote service invocation, while Section 6 validates the proposed methodology. Finally, Section 7 presents an algorithm that exploits this methodology. From a mathematical point of view, a remote method invocation represents a time interval during which the method will be executed with a given percentile (95th percentile, for example). In other words if h(x ) represents the probability distribution of the statistic variable x that describes the service invocation execution time, we can identify the minimum time interval [0, Y] that can ensure the execution time with a given probability X . Since we are trying to estimate a possible deadline, an upper bound estimation of Y is still an acceptable value while a lower bound cannot be considered. In other words, we can accept to try to predict a 95th percentile, when de facto the real number of deadline miss is 99th percentile. We cannot accept the opposite behaviour. An additional remark is that the probability function must take into account all the factors that are represented in table 1 of section 3.1, like client and server load, the input and output type and size etc. Finally we need to point out that the exact probability distribution h(x) depends on many factors and it is quite difficult to estimate, so we could try to give an upper bound (i.e. a Majorization) like the following:
P ( x < X ) ≤ P (k < X ) Where the probability distribution of k is described by a Gaussian ( N ( μ , σ ) ) distribution larger (see Section 4.2) than the x distribution, with a given average (Avg or µ) and standard deviation (sDev or σ)
N ( μ , σ ) μ = f (x) σ = g (x) We can note that µ and σ are deterministic functions of the key factors (marked as x) presented in Section 3.1. If we succeed in the estimation of the average and the standard deviation of the presented Gaussian we will be able to provide an upper bound of the remote method execution time, noting that:
Y = P(x < X) ≤ qX = g(x)ΦX + f (x) Φ
X represents the percentile of order X of a Where Gaussian distribution with Avg=0 and sDev=1. Considering that both f(x) and g(x) must be determinate in an empiric way,
we cannot ignore the experimental error due to this estimation, in particular.
μ = f e (x) ± ε μ σ = g e (x) ± ε σ Again, considering that we want to estimate an upper bound of a time, only positive errors must be considered. In addition, the errors ε μ and ε σ must follow a conservative approach because we want predict worst case functions, as explained at the beginning of this section. In conclusion the final dead line estimation will be:
Ye = g e ( x)Φ X + ε σ Φ X + f e ( x) + ε μ If the influence of some factors x cannot be considered under the client control (i.e. the server load), we need to substitute the worst case scenario into the just above equation. As final remark we need to consider factors like the algorithm of the method (G) and the key input that change the algorithm behaviour (H). They must be provided by the programmer of the remote method because, as discussed in Section 3 WS engines do not take into account the semantics of the remote methods. Assuming that the remote algorithm execution time is Ra(x) and that it will be provided by programmers [26], the final estimation of the critical intervals presented in Section 3.1 will be:
t 7 − t 0 = Tex = gex ( x)Φ X + ε μex Φ X + f ex ( x) + ε σ ex + Ra( x)
t 3 − t 0 = Tow = g ow ( x)Φ X + ε μ ow Φ X + f ow ( x) + ε σ ow t 4 − t 0 = Tel = g ow ( x )Φ X + ε μ ow Φ X + f ow ( x ) + ε σ ow + Ra ( x )
Of course, if Ra(x) will be known with a given error, it will need to be taken into account too [26]. The following Section (4.1) will present and discuss a methodology based on the 2k factorial analysis [30] for the estimation of the functions according to the collected experimental data. A. Empiric Function Estimation In order to allow the possibility to have different WS QoSenabled architectures, as explained in Section 8, we would like to consider two different approaches to the functions estimation problem. First, (1) we could directly estimate the needed functions from the QoS time factor t7-t0 (tex), t4-t0 (tpt) and t3t0 (tow) presented in section 3. As a second possibility, (2) we could derive the same functions as composition of functions that model the average and the standard deviation of each single interval presented in Section 3 (t1-t0, t2-t1, t4-t3 etc). In other words we have:
μ = f ( x )= f e ( x) ± ε μ = f cs ( x) + f cn ( x) + f sd ( x ) + f ss ( x) +
+ f sn ( x ) + f dc ( x ) ± ε μ cs ± ε μ cn ± ε μ sd ± ε μ ss ± ε μ sn ± ε μ dc
σ = g ( x)= ge ( x) ± εσ = gcs ( x) + gcn ( x) + g sd ( x) + g ss ( x) + + g sn ( x ) + g dc ( x ) ± ε σ cs ± ε σ cn ± ε σ sd ± ε σ ss ± ε σ sn ± ε σ dc
Table 2 describes the meaning of the functions. By the way, considering that we are estimating a deadline, the experienced error must follow a conservative approach in both cases. Finally, for t4-t0 (tpt) and t3-t0 (tow) we have
f ss ( x) = f sn ( x) = f dc ( x) = g ss ( x) = g sn ( x) = g dc ( x) = 0 because the output transmission do not influence the execution time. The second approach can allow (i) an interval composition simplifying the clock synchronization problems for one way messages and (ii) the possibilities to perform independent measures for the clients, servers and networks channels. In other words, following this approach the estimation of the execution time can be computed as a linear composition of factors. Unfortunately we need to remark that, as explained is Section 4 we need consider an upper bound of each real function so the deadline computed in this second way will be larger because of the presence of the experimental error of each function estimated. According to the test description presented in Section 5 we generate the full 26 factor design composed of 64 key tests [30] and we compute the Linear Regressions and the experimental errors in order to estimate the wanted functions [30]. The details of the calculation presented in this section can be found in [28] and [29]. In Section 6 we will show that this function can allow the prediction of a remote method execution time Function
f cs (x) , g cs (x) f cn (x) , g cn (x) f sd (x) , g sd (x)
f ss (x) , g ss (x) f sn (x) , g sn (x ) f dc (x) , g dc (x)
Meaning Avg and sDev of the Client Serialization Avg and sDev of the input message transmission Avg and sDev of the input deserialization Avg and sDev of the Server Serialization Avg and sDev of the output message transmission Avg and sDev of the output deserialization Table2. Function Break Down Meaning
B. Gaussian Upper Bound (Majorization) of a Sample Distribution As introduced in section 4, for each of the 64 tests samples of the factorial design described in Section 4.1, average and standard deviation have been computed using the standard estimators [30]. After that, we run the following hypothesis test:
H 0 = N ( μ + ε , σ + ξ ) “is a larger distribution than the one experience during the test” where ε , ξ are the minimum non negative numbers that allow the success of the hypothesis test. The just determinate values were used as tests values for the contrast analysis and the regression model estimation [30]. V.
ON VALIDATING THE PROBLEM FORMALIZATION
We decided to consider a single remote method invocation as a single test sample and, according to the model described in
the Section 3, we stored all possible WS crucial intervals in a so called Training Dataset. Such stored time intervals will be exploited to train/extract our predictive model of the WS RT. In addition, we computed the mentioned QoS crucial intervals (tex, tpt, tow) in a direct and independent way. In this first set of tests we prepared our testbed in order to maintain fixed the parameters that depend on the hardware and software layers on both the client and server sides, i.e. the factors A, B, C, and D of Table 1. Factors like G and H belong to the semantic of the method. Therefore we decided to leave these parameters out of the first test sets. Factors I, L, M, and N must be included in the data set because the exchanged message sizes have a big impact on the system performance, and thus on the method RT [7], [27]. Dynamic and unpredictable factors like E, F, O, and P pose some problem to our methodology. To prepare our training dataset, the tests were repeated by maintaining such dynamic factors under control, for example a single client and a single server where the machine loads were artificially kept fixed. However, due to the number of software layers and the lack of real time operative systems and WS-engine, we experienced some fluctuations in the measured times. In conclusion the variables that we consider in the tests are:(i) Input Type [none, String, double, String and Double] (ii) Output Type= [none, String, double, String and Double](iii) Input Size (number of elements) = [0, 100, 1000, 10000] (iv) Output Size (number of elements) = [0, 100, 1000, 10000] (v) CPU usage Server= [0%, 70%,80%](vi) CPU usage Client= [0%, 70%,80%]. The first four above parameters characterize a generic method input and output, while the last two correspond to percentage of CPU usage by processes that are not serving the remote invocation. In all tests conducted, client and server were running on a Dual Xeon 2.40GHz, 1.5GB RAM machines running the CERN Scientific Linux 3.0.4 Operating System, with Kernel 2.4.21-27.0.2.EL.cernsmp and Java 1.4.2-08-b03. The machines were interconnected to each other by a 100 MB switched Ethernet. Finally on top of this hardware and software layers we installed Tomcat 5.0.28 and Axis 1.4 as Web Service provider. For every single test (i.e for each combination of parameters), 1000 samples (i.e, remote single method invocation) were taken and a full test set consists of all possible combinations of the above mentioned parameters. In other words the dataset consists of 2304000 samples (of 9 significant values each) organized in 2304 different tests. In Section 6 we will show that the analysis of this preliminary set of samples can be sufficient for the developing of a prediction methodology that can allow service invoker to predict the execution time of the remote method. We also believe that an analysis of the Web Service performance varying the network load channel is the most important missing thing in this dataset. But, as pointed out in Section 3, different projects [19], [20], [21], [22] are currently studying this problem and are trying to provide a service oriented system for estimating the effective performance of a link connection across internet. So, considering that a web service call consists of exchanging 1 (in case of one way) or 2 messages with a given size, the result coming out from these projects could help in the network delay estimation.
been accomplished. As the intuition suggests, we can note that both the mentioned factors (CPU occupancy on the client and server sides) influence the raw data distributions; the more the machines are busy, the more the average and the standard deviation increase. We can also note that the CPU occupancy factor on the client side is more influent than the occupancy on the server side. Finally the remote method execution time increases remarkably when both the machines are busy. This set of plots demonstrates that the CPU load, on both the server and client sides, influences the remote method execution time.
A. Experimental Results The dataset consists of 2304000 samples (of 9 significant values each) organized in 2304 different tests. We believe that providing 20736 plots relative to the samples distribution of each significant value of the entire data set is meaningless. Therefore we show and discuss a subset of the collected raw data, in order to let the reader understand the effective potentialities of the produced dataset for performance prediction. However, we limit ourselves to present and comment just the raw data distribution, without any additional analyses that could be performed on top. Validations of the influence of each factor can be found in [28] and [29]. It worth nothing that next Section validates the methodology proposed in section 4 using a different set of tests. Finally these data were collected using a Tomcat+Axis as WS provider. Therefore, this section is related to a particular WS implementation. However, the methodology developed in section 4 can be used within every WS-engine implementation.
45 40 35
Frequency
30 25 20 15 10 5
27800
26900
26000
25100
24200
23300
22400
21500
20600
19700
18800
17900
17000
16100
15200
14300
13400
12500
9800
11600
10700
8000
0 8900
The tests sample collection was released by patching the Axis engine with a Peer to Peer (P2P) system that was running in parallel with the remote methods invocation. Before start acquiring the data, in order to measure the overhead introduced by this modification, a comparison test was performed. This test was a comparison between a standard web service and the same remote service equipped with the above presented software and the result was negligible. Detailed description on the testbed can be found in [28] and in [29].
time(mSec)
Figure 4. Sample distribution S-CPU 80% C-CPU 0% 25
Frequency
20
15
10
5
300
27800
26900
26000
25100
24200
23300
22400
21500
20600
19700
18800
17900
17000
16100
15200
14300
13400
12500
11600
10700
9800
8900
8000
0
250
time (mSec) Frequency
200
150
Figure 5. Sample distribution S-CPU 80% C-CPU 80%
100
50
VI. 27800
26900
26000
25100
24200
23300
22400
21500
20600
19700
18800
17900
17000
16100
15200
14300
13400
12500
11600
9800
10700
8900
8000
0
Time (mSec)
Figure 2. Sample distribution S-CPU 0% C-CPU 0% 25
Frequency
20
15
10
5
27800
26900
26000
25100
24200
23300
22400
21500
20600
19700
18800
17900
17000
16100
15200
14300
13400
12500
11600
10700
9800
8900
8000
0
time (mSec)
Figure 3. Sample distribution S-CPU 0% C-CPU 80%
In this set of plots we consider a remote method invocation with 10000 String (of 10 characters) and Doubles in input and output. Figures 2, 3, 4, and 5 show the probability distributions of the total invocation time (tex=t7-t0) when the CPU occupancy on both the client and server sides was varied between 0% and 80%. The remote method algorithm is empty; in other words the server immediately starts the serialization of a pre-generated output, once the deserialization of the input has
ON VALIDATING THE PROPOSED METHODOLOGY
In this Section we will show the prediction capability of the techniques discussed in Section 4. We validated the methodology with an additional set of tests in order to use different samples from the one used for building the deadline estimators. We used the same hardware and software presented in Section 5 but in these tests, clients continuously and randomly choose the input and the output of the remote method and then request the service. In addition, in order to validate the methodology in the worst case scenario, by looking the residual of the function [30], we will assume that the client CPU Load is always larger than 80%. With the developed methodology we are capable to tune the deadline estimation taking into account the remote CPU usage factor. By the way, in a real scenario, as pointed out in Section 3 and 4, it is impossible to maintain the server CPU usage constant during the entire remote method invocation. Therefore we decided to test our methodology in the case where the server is in the worst case scenario. In other words we consider the case where the server CPU usage from different processes is always 80%. In addition we analyze the behaviors of predictors in the case where the server is completely empty, in order to understand how much this wrong assumption impacts in this limit scenario. By the way,
invocation, we expect the service time to increase because the server is overloaded. Consequently the number of dead line miss will increase in an unpredictable way. With the testbed used for building this validation we succeed to handle more than 100 clients that perform parallel requests to the service, only if the total service throughput is less than the maximum of server capability [7]. A characterization of the server overloaded was not part of the Training Dataset. Therefore in order to be able to estimate the remote method execution time we should change factorial design region [30]. Finally we need to point out that a systematic server overload probably represents a mistake of the particular application deployment performed by a system administrator, and the adoption of this methodology can allow an easy detection.
20000 15000 10000 5000 0 1
20
Percentage
QoS End to End
25000
Time (mSec)
we need to point out that we could remove this assumption in case of an advanced reservation. With these assumptions, we performed 5000 remote method invocation with random input and output, in a scenario where only one client was invoking a loaded and unloaded server. We also repeated the previous tests when a variable number of clients (2, 4, 6,) were connected to the server. Figures 6 and 7 report the results. The "total95" and "total975" curves represent the dead line estimation for a remote method execution (t7-t0) using a direct computation of the linear regression with a quantile of 95. The "comp95" and "comp975" curves show the deadline estimations (t7-t0) using the interval decomposition technique. The “OneWay” curves have similar meaning but they refer to the prediction of t3-t0. As expected, in both cases less than the 5% and 2.5% of dead line misses were experienced, because of the upper bound that we were forced to consider in the dead line functions estimations. In addition Figure 8 reports a test snapshot for the Remote Method Execution (t7-t0) where 3 clients are concurrently requesting the service. We can note that the remote execution time prediction follows the “real” curve and that direct estimations are more accurate because of the minor experimental error.
4
Real
15
7 10 13 16 19 22 25 28 31 34 37 40 43 46 49 52 55 58 Total95
Samples Total975 Comp95
comp975
Figure 8. A Test snapshot with 3 clients, estimation of t7-t0
10 5 0 CpuSer0% CpuSer80%
2 Clients
3 Clients
4 Clients
6 Clients
% Deadline Miss Percentile 975 Total975
Figure 6.
OneWay975
Comp975
COneWay975
% of Deadline with expected Percentile 975
In addition, in order to reduce the experimental error, thus building more accurate predictors, the region of investigation could be split in two parts, or a 3k factorial design could be explored [30]. Additional details on the validation of the proposed methodology can be found in [28] and [29] where each single test scenario has been outlined with additional plots. VII. WEB SERVICE QOS ENABLED ARCHITECTURES
Percentage
25 20 15 10 5 0 CpuSer0% CpuSer80%
2 Clients
3 Clients
4 Clients
6 Clients
% Deadline Miss Percentile 95 Total95
Figure 7.
OneWay95
Comp95
COneWay95
% of Deadline with expected Percentile 95
Additional plots that validate the proposed methodology can be found in [28] and in [29]. We can conclude that the proposed methodology provides an upper bound of a remote method execution time. As we can note from Figures 6 and 7, the dead line estimation works only if the server is not overloaded, i.e. if the number of clients is three or less. According to [7], 3 concurrent clients that try to use the remote service as fast as they can, bring the server to the maximum request throughput that it can handle. In other words, if we try to increase the number of remote method
In this section we will discuss three possible high level software architectures that utilize the developed methodology in order to predict the remote method execution time. For each option we would like to provide an intuitive service orchestration and the advantages and disadvantages of each solution. The main goal of this architectures is to allow the automatic profile of the services in order to be able to determine the deadline function, thus being capable of predict a remote method execution time. Detailed description on the architectures can be found in [28] and in [29]. Since each proposed solution presents advantages and disadvantages, we believe that the adoption of a particular architecture depends on the particular use case. In the GridCC project [10] the “Server and Clients Factors Break Down” architecture presented in Section 7.2 has been adopted and integrated. A.
Full Client Side Logic In this approach each client will utilize the methodology presented in Section 4 in order to directly compute the dead line functions (see Figure 9). For each client the Tests Executor component reserves the remote service using the Reservation Engine and performs the needed tests. Then it computes the
deadline functions via the Deadline Function Computation component. The remote service provides also a method execution characterization via the Method execution provider.
Figure 9. Full Client Side Logic
Note that in this solution: (i) the server must provide a description of the remote methods execution time (t4-t3) for each method. (ii) The clock synchronization is not needed during the test procedure. (iii) During the client tests, the server needs to be totally dedicated to the client. (iv) Considering that all the tests will be computed on client side, the one way computation could be not trivial, because of the clock synchronization problem. Probably upper bound estimations will be the only possibility. (v) During the tests procedure the network channel properties must be kept constant or its control should be managed by the clients in order to allow the creation of the deadline functions in the proper way.
profiles itself to provide a characterization of the following intervals only: (i)t1-t0 input serialization,(ii) t7-t6 output deserialization In addition, the client has to compute the deadline functions retrieving the server characterization values via the Dead Line Function Computation component. Finally, if a network characterization channel is required, the client can retrieve it from a third party element. Note that in this solution: (i) the server must provide a description of the remote methods execution time (t4-t3) for each method. (ii) The server profile is built just once and does not change using different clients. (iii) The client can build its tests without asking the server cooperation. (iv) The testing procedure does not care about the network channel. (v) The clock synchronization is not needed during the test procedure. (vi) The estimate dead line will be larger than the one used for a direct estimation, because of the experimental errors introduced in each functions. (vii) A modification of the source code of the WS provider in both client and server side is mandatory since time like t1, t2, t5, t6 are internal part of the WS-Engine. C. Third Party QoS Enabler During the test procedure the server and the clients send the experienced times to a third party component, that build the dead line functions and send it to the client (see Figure 11). For each client the Tests Builder component reserves the remote service using the Reservation Engine and performs the needed tests. During the tests procedure both server and client send information related to the interval t3-t2, t4-t3, t5-t4, t1-t0 and t7-t6 to the QoS Enabler component that builds the dead line functions.
Figure 10. Server and Clients Factors Brake Down
Figure 11. Third Party QoS Enabler
B. Server and Clients Factors Break Down The key idea of this approach is to break the dead line function into several pieces and let the server and the client compute each part separately. Then the dead line function will be computed aggregating the functions of each factor (see Figure 10). In this case the servers build the characterization related to the intervals (i) t3-t2 input deserialization,(ii) t4-t3 remote method execution time and (iii) t5-t4 output serialization using the tests Builder component and making it public to the client through the Method Execution Provider component. Using to the test builder component, the client
Note that in this solution: (i) The server must provide a description of the remote methods execution time (t4-t3) for each method. (ii) The external component can directly build the functions, without the interval composition technique allowing a more accurate estimation. (iii) The testing procedure does not care about the network channel, since all the intervals are part of the server or of the client. (iv) The clock synchronization is not needed during the test procedure, since all the intervals are part of the server or of the client. (v) A centralized external component introduces a single point of failure and an additional software complexity. (vi) A modification of the source code of the WS-Engine in both client and server side is
mandatory since times like t1, t2, t5 and t6 are internal parts of the WS-Engine.
[8]
VIII. CONCLUSIONS This paper analyzes the state of the art on QoS in a WS scenario, and proposes a set of solutions that enable a remote service invocation time to be predicted in a general scenario. The contribution of this paper can be divided in three different parts: Section 3 formalizes the problem while Sections 5 and 5.1 validate this formalization by providing a dataset for web service QoS study. In particular, the dataset consists of 2304000 samples (of 9 significant values each) organized in 2304 different tests. In the second part of this paper (Section 4, 6, and 7) we analyze the collected dataset in a more exhaustive way. Two variants of a methodology that utilizes a Gaussian approximation of the dataset distributions, in combination with a regression model of the key factors that influence the average and the standard deviation, have been developed in Section 4. Then, in Section 6 our estimators are validated with experimental results in several scenarios. In the last part of this paper (Section 7), we propose three different software architectures that can utilize the developed methodologies and algorithms. It is worth noting that the presented solutions have been already adopted in a Grid context [10] during the design and implementation of our IE [31], [32]. We have also experienced that in case of server overload, the number of deadline misses increases. This suggests a possible approach for an automatic organization of the clients that balances the servers’ load, and that could be exploited to solve the use cases mentioned in the introduction of this paper. If the number of deadline misses is greater than the expected ones, the server machine is probably overloaded. So clients could/should decide to use a different machine, in which an identical copy of the invoked service is deployed. REFERENCES [1] [2]
[3]
[4] [5]
[6]
[7]
M. Irving, G. Taylor, and P. Hobson. Plug into Grid computing. IEEE Power & Energy Magazine, pages pp 40–44, March/April 2004. D.F. McMullen, T. Devadithya, and K. Chiu. Integrating Instruments and Sensors into the Grid with CIMA Web Services. Proceedings of the Third APAC Conference on Advanced Computing, Grid Applications and e-Research (APAC05), September 2005. C.K. Tham and R. Buyya. SensorGrid: Integrating Sensor Networks and Grid Computing. invited paper in CSI Communications, Special Issue on Grid Computing, Computer Society of India, July 2005. OGC SensorWeb Enablement: www.opengeospatial.org/functional/page=swe Grid Enabled Remote Instrumentation whit Distributed Controland Computation (GridCC) project annex I.Also available http://www.gridcc.org/getfile.php?id=1436e, 2005. GridCC Use Cases. also available at. https://ulisse.elettra.trieste.it/tutosgridcc/php/product show.php?id=1100. F. Lelli, G. Maron, and S. Orlando. Improving the Performance of XML Based Technologies by Caching and Reusing Information. in proc of
[9] [10] [11] [12]
[13]
[14]
[15]
[16]
[17]
[18]
[19] [20]
[21] [22] [23]
[24] [25] [26] [27] [28] [29]
[30] [31]
[32]
International Conference of Web Services (ICWS06), IEEE Computer Society volume 1:pag 689–700, september 2006. B Jacob, R. Lanyon-Hogg, D.K. Nadgir, and A.F. Yassin. A Pratical Guide to the IBM Autonomic Computing Toolkit. IBM Corp. Redbooks, April 2004. D.A. Menasc´e. QoS Issues in Web Services. IEEE Internet Computing, vol. 6, no. 6, pp. 72-75, 2002. GridCC Project web site: http://www.gridcc.org/, Ran Sh. A Model for Web Services Discovery With QoS. ACM SIGecom Exchanges, Vol. 4, No.1 pp. 1-10, 2003. Jeckle M. and Zengler B. Active UDDI - an Extension to UDDI for Dynamic and Fault-Tolerant Service Invocation. Web and DatabaseRelated Workshops on Web, Web-Services and Database Systems, LNCS pp. 91-99, 2003. Zhou C., Chia L.-T., and Lee B. QoS-Aware and Federated Enhancement for UDDI. International Journal of Web Services Research,Vol. 1, No. 2. Maximilien E.M. and Singh M.P. A Framework and Ontology for Dynamic Web Services Selection. IEEE Internet Computing,, May 2004. Gu X. and R Chang. QoS-Assured Service Composition in managed Service Overlay Networks. In Proc. of The IEEE 23rd International Conference on Distributed Computing Systems (ICDCS 2003), 2003. Gao X., Jain R., Ramzan Z. and Kozat U. Resource Optimization for Web Service Composition. International Conference on Service Computing (SCC2005), 2005. Cardoso J., Sheth A., Miller J., Arnold J., and Kochut K. Quality of Service for Workflows and Web Service Processes. Journal of Web Semantics, Vol. 1, No. 3, pp. 281-308, 2004. Yu T. and Lin K.J. Service Selection Algorithms for Web Services with End-to-End QoS Constraints. Journal of Information Systems and EBusiness Management, Volume n 3, Number 2, July 2005. INTERMON project. http://www.intermon.org/, MONitoring Agents using a Large Integrated Services Architecture (MonALISA). http://monalisa.caltech.edu/. California Institute of Technology, PlanetLab project. http://www.planet-lab.org/., PerfSonar Project. http://www.perfsonar.net/, S. Graham, S. Simeonov, T. Boubez, G. Daniels, D. Davis, and Y. Nakamura. Building, Web Services with Java: Making Sense of XML, SOAP, WSDL, and UDDI. Sams, December 2001. P. Th. Eugster, P. A. Felber, R. Guerraoui, and A. Kermarrec. The many faces of publish/subscribe. ACM Comput. Surv., 35(2):114–131, 2003. Network Clocks Synchronization. http://zone.ni.com/ devzone/conceptd.nsf/webmain G. Buttazzo, G. Lipari, L. Abeni, M. Caccamo. Soft Real-Time Systems: Predictability vs. Effciency. Springer, 2005. K. Chiu, M. Govindaraju, and R. Bramley. Investigating the Limits of SOAP Performance for Scientific Computing. HPDC, 00:246, 2002. F. Lelli, G. Maron. Report on QoS Implementation GridCC Project Deliverable 2.4, October 2006 also available at www.gridcc.org F. Lelli. “Bringing Instruments to a Service-Oriented Interactive Grid”, PhD Thesis, Dipartimento di Informatica, Università Ca’ Foscari di Venezia, March 2007 D. C. Montgomery. Design and Analysis of Experiments 5th edition. John Wiley & Sons Inc, December 2004. E. Frizziero, M. Gulmini, F. Lelli, G. Maron, A. Oh, S. Orlando, A. Petrucci,S. Squizzato, and S. Traldi. Instrument Element: A New Grid component that Enables the Control of Remote Instrumentation. in proc of International Symposium on Cluster Computing and the Grid (CCGrid), volume 2:page 52 IEEE Computer Society, 2006. F. Lelli, E. Frizziero, M. Gulmini, G. Maron, S. Orlando, A. Petrucci and S. Squizzato, (2007) ‘The many faces of the integration of instruments and the grid’, Int. J. Web and Grid Services, Vol. 4, No. 1 page-1-28.