Coding-Sequence Determinants of Gene Expression in Escherichia coli Grzegorz Kudla, et al. Science 324, 255 (2009); DOI: 10.1126/science.1170160 The following resources related to this article are available online at www.sciencemag.org (this information is current as of April 10, 2009 ):
Supporting Online Material can be found at: http://www.sciencemag.org/cgi/content/full/324/5924/255/DC1 This article cites 28 articles, 16 of which can be accessed for free: http://www.sciencemag.org/cgi/content/full/324/5924/255#otherarticles This article appears in the following subject collections: Molecular Biology http://www.sciencemag.org/cgi/collection/molec_biol Information about obtaining reprints of this article or about obtaining permission to reproduce this article in whole or in part can be found at: http://www.sciencemag.org/about/permissions.dtl
Science (print ISSN 0036-8075; online ISSN 1095-9203) is published weekly, except the last week in December, by the American Association for the Advancement of Science, 1200 New York Avenue NW, Washington, DC 20005. Copyright 2009 by the American Association for the Advancement of Science; all rights reserved. The title Science is a registered trademark of AAAS.
Downloaded from www.sciencemag.org on April 10, 2009
Updated information and services, including high-resolution figures, can be found in the online version of this article at: http://www.sciencemag.org/cgi/content/full/324/5924/255
and the magnitude of FCT. Because active torque is proportional to n2 and passive torque to n, the ratio of active to passive torque increases as n increases (Eq. 5), even while both quantities increase individually % t%Þ w˙ a Fn ðdϕ=d ¼ − ðg − 1Þ w˙ FCT 8w
ð5Þ
The increase in the ratio indicates an enhanced capability for active maneuvers and active stabilization, whereas the increase in FCT adds to passive stability. Thus, increasing wingbeat frequency enhances both maneuverability and stability. Hummingbirds provide an interesting example; males typically have greater wingbeat frequencies (21) and smaller body sizes as compared to females of the same species, potentially conferring a benefit in maneuverability and therefore an advantage in display flights (22) as well as greater stability when experiencing an external perturbation. These benefits are not without cost, because increasing wingbeat frequency increases the inertial and profile power requirements of flapping flight. Finally, the success of our FCT model in predicting yaw deceleration dynamics implies that passive damping may be important to flight control in flying animals across a wide range of body sizes. For example, if a steadily flapping animal experiences a brief perturbation in midstroke, by the time it is prepared to execute a corrective wingbeat, FCT will have eroded much of the effect of the perturbation, regardless of the wingbeat frequency employed by the animal. Thus, FCT provides open loop stability for some aspects of animal flight, reducing its neuromuscular and
neurosensory requirements. These are not eliminated, because FCT results in asymmetric forces from symmetric flapping, implying that the animal’s muscles must generate asymmetric forces and suggesting neural regulation to enforce symmetry. Furthermore, FCT does not address all the stability problems faced by flying animals. This study is limited to yaw dynamics in hovering or slow-speed flight; FCT is likely to be influential in fast forward flight, but no data are available to test such predictions. More important, a full description of body dynamics involves many factors beyond FCT and includes modes such as pitching and longitudinal dynamics known to be inherently unstable in open loop conditions (23, 24) and subject to active control (25, 26). Finally, yaw damping due to FCT is a feature of flapping flight that is not found in human-made fixed-wing or rotary-wing flyers and may lead to improvements in the stability and maneuverability of biomimetic micro–air vehicles. References and Notes 1. S. N. Fry, R. Sayaman, M. H. Dickinson, Science 300, 495 (2003). 2. D. R. Warrick, K. P. Dial, J. Exp. Biol. 201, 655 (1998). 3. M. F. Land, T. S. Collett, J. Comp. Physiol. A 89, 331 (1974). 4. J. W. S. Pringle, in Insect Flight, M. Abercrombie, P. B. Medawar, G. Salt, M. M. Swann, V. B. Wigglesworth, Eds. (Cambridge Monographs in Experimental Biology, Cambridge Univ. Press, London, 1957), pp. 86–118. 5. G. K. Taylor et al., J. Exp. Biol. 211, 258 (2008). 6. G. K. Taylor, Biol. Rev. Camb. Philos. Soc. 76, 449 (2001). 7. H. Wagner, Philos. Trans. R. Soc. London Ser. B 312, 527 (1986). 8. N. Boeddeker, M. Egelhaaf, J. Exp. Biol. 208, 1563 (2005). 9. T. Hesselberg, F.-O. Lehmann, J. Exp. Biol. 210, 4319 (2007). 10. T. L. Hedrick, A. A. Biewener, J. Exp. Biol. 210, 1897 (2007).
Coding-Sequence Determinants of Gene Expression in Escherichia coli Grzegorz Kudla,1* Andrew W. Murray,2 David Tollervey,3 Joshua B. Plotkin1† Synonymous mutations do not alter the encoded protein, but they can influence gene expression. To investigate how, we engineered a synthetic library of 154 genes that varied randomly at synonymous sites, but all encoded the same green fluorescent protein (GFP). When expressed in Escherichia coli, GFP protein levels varied 250-fold across the library. GFP messenger RNA (mRNA) levels, mRNA degradation patterns, and bacterial growth rates also varied, but codon bias did not correlate with gene expression. Rather, the stability of mRNA folding near the ribosomal binding site explained more than half the variation in protein levels. In our analysis, mRNA folding and associated rates of translation initiation play a predominant role in shaping expression levels of individual genes, whereas codon bias influences global translation efficiency and cellular fitness. he theory of codon bias posits that preferred codons correlate with the abundances of iso-accepting tRNAs (1, 2) and thereby increase translational efficiency (3) and accuracy (4). Recent experiments have revealed other effects of silent mutations (5–7). We synthesized a library of green fluorescent protein (GFP) genes that varied randomly in their codon usage, but encoded the same amino acid sequence (8). By placing these
T
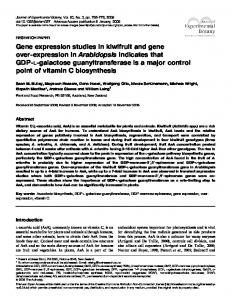
constructs in identical regulatory contexts and measuring their expression, we isolated the effects of synonymous variation on gene expression. The GFP gene consists of 240 codons. For 226 of these codons, we introduced random silent mutations in the third base position, while keeping the first and second positions constant (Fig. 1A). The resulting synthetic GFP constructs differed by up to 180 silent substitutions, with an
www.sciencemag.org
SCIENCE
VOL 324
11. S. P. Sane, J. Exp. Biol. 206, 4191 (2003). 12. J. R. Usherwood, C. P. Ellington, J. Exp. Biol. 205, 1565 (2002). 13. C. P. Ellington, Philos. Trans. R. Soc. London Ser. B 305, 41 (1984). 14. See supporting material on Science Online. 15. C. H. Greenewalt, Smithson. Misc. Collect. 144, 1 (1962). 16. R. Dudley, The Biomechanics of Insect Flight. Form, Function, Evolution (Princeton Univ. Press, Princeton, NJ, 2000). 17. M. Mayer, K. Vogtmann, B. Bausenwein, R. Wolf, M. Heisenberg, J. Comp. Physiol. A 163, 389 (1988). 18. H. H. Bülthoff, T. Poggio, C. Wehrhahn, Z. Naturforsch. C 35, 811 (1980). 19. G. K. Taylor, H. G. Krapp, in Insect Mechanics and Control, J. Casas, S. J. Simpson, Eds. (Academic Press, London, 2007), vol. 34, pp. 231–316. 20. G. Ribak, J. Swallow, J. Comp. Physiol. A 193, 1065 (2007). 21. T. A. Hunter, J. Picman, Condor 107, 570 (2005). 22. F. G. Stiles, D. L. Altshuler, R. Dudley, Auk 122, 872 (2005). 23. G. K. Taylor, A. L. R. Thomas, J. Theor. Biol. 214, 351 (2002). 24. M. Sun, J. K. Wang, J. Exp. Biol. 210, 2714 (2007). 25. G. K. Taylor, A. L. R. Thomas, J. Exp. Biol. 206, 2803 (2003). 26. X. Deng, L. Schenato, S. S. Sastry, IEEE Trans. Robotics 22, 789 (2006). 27. We thank A. Biewener of Harvard University and S. Swartz and K. Breuer of Brown University for providing the hummingbird and fruit bat data. This work was funded in part by NSF grant 0732267 (Division of Integrative Organismal Systems) to T.L.H. and NSF grant 0545931 (Division of Information and Intelligent Systems) to X.D.
Supporting Online Material www.sciencemag.org/cgi/content/full/324/5924/252/DC1 SOM Text Figs. S1 to S3 Table S1 References Appendices A to D 12 November 2008; accepted 20 February 2009 10.1126/science.1168431
average of 114 substitutions between pairs of constructs (Fig. 1B and figs. S1 and S2). The range of third-position GC content (GC3) across the library of constructs encompassed virtually all (99%) of the GC3 values among endogenous Escherichia coli genes, and the variation in the codon adaptation index (CAI) (9) contained most (96%) of the CAI values of E. coli genes (Fig. 1). We expressed the GFP genes in E. coli using a T7-promoter vector, and we quantified expression by spectrofluorometry. Fluorescence levels varied 250-fold across the library, and they were highly reproducible for each GFP construct (Spearman r = 0.98 between biological replicates) (fig. S3). Fluorescence variation was consistent across a broad range of experimental conditions (fig. S4). 1 Department of Biology and Program in Applied Mathematics and Computational Science, The University of Pennsylvania, Philadelphia, PA 19104, USA. 2Department of Molecular and Cellular Biology, Harvard University, Cambridge, MA 02138, USA. 3Wellcome Trust Centre for Cell Biology and Centre for Systems Biology, University of Edinburgh, Edinburgh EH9 3JR, UK.
*Present address: Wellcome Trust Centre for Cell Biology, University of Edinburgh, Edinburgh EH9 3JR, UK. †To whom correspondence should be addressed. E-mail:
[email protected]
10 APRIL 2009
255
Downloaded from www.sciencemag.org on April 10, 2009
REPORTS
An alternative plasmid with bacterial promoter reduced overall expression levels, but the correlation between the two expression systems remained high (r = 0.9) (fig. S4). A similar pattern of fluorescence variation was observed in fluorescence-activated cell sorting measurements (fig. S5). Because the encoded protein sequence was identical for all genes, we attributed fluorescence variation to differences in protein levels. This was confirmed by strong correlations between fluorescence and total GFP levels in Western blots (fig. S5) and Coomassie staining (r = 0.9, P < 10–15). To test the theory that E. coli translation rates and eventual protein levels depend on the concordance between codon usage and cellular tRNA abundances (10–12), we compared codon usage to fluorescence among the 154 synonymous GFP variants. Notably, neither of the two most common measures of codon bias, the CAI or the frequency of optimal codons (3), was significantly correlated with fluorescence levels (r = 0.14, P = 0.09, and r = 0.11, P = 0.16, respectively) (Fig. 2A). Moreover, some of the most highly expressed genes featured low CAI and vice versa. Although codon adaptation near the 5′ terminus is considered particularly important for expression (12, 13), the CAI value of the first 42 bases in a GFP gene was not significantly corre-
lated with the gene’s fluorescence intensity (r = 0.1, P = 0.2). Similarly, the number of rare codons (sites with CAI < 0.1) in a sequence was not significantly correlated with fluorescence (r = –0.02, P = 0.7), and neither was the number of pairs of consecutive rare codons (r = –0.14, P = 0.09). Although specific consecutive codon pairs have been proposed to influence translation (14, 15), the frequency of such rare pairs in a gene was not significantly correlated with its fluorescence (r = 0.07, P = 0.35) (8). Statistical analyses of which nucleotide positions influenced gene expression (fig. S6) indicated the importance of local sequence patterns, as opposed to global codon bias. This pattern is consistent with studies of base content (16, 17), which suggest that mRNA structure may shape expression levels (18–21). Therefore, for each GFP construct, we computed the predicted minimum free energy associated with the secondary structure of its entire mRNA or specific regions of its mRNA. The folding energy of the entire mRNA was not significantly correlated with fluorescence (r = 0.16, P = 0.051), but the folding energy of the first third of the mRNA was strongly correlated: mRNAs with stronger structure produced lower fluorescence (r = 0.60, P < 10–15). A moving window analysis identified a region,
Fig. 1. Synthetic library of GFP genes with randomized codon usage. (A) Degenerate oligonucleotides were mixed and assembled by polymerase chain reaction. Fragments were then cloned, sequenced, and assembled into complete GFP genes. Red indicates third-codon positions. Degenerate symbols are as follows: D (A or G or T); H (A or C or T); N (A or C or G or T); R (A or G);
256
10 APRIL 2009
VOL 324
from nucleotide (nt) –4 to +37 relative to start, for which predicted folding energy explained 44% of the variation in fluorescence levels across the GFP library (r = 0.66, P < 10–15) (Fig. 2B). The same folding energies explained 59% of fluorescence variation when constructs were expressed using a bacterial promoter (r = 0.77, P < 4 × 10–16) (fig. S7). mRNA folding also correlated with fluorescence in a separate analysis of GFP constructs differing by single mutations (8). The strong correlation between mRNA folding and fluorescence suggests the simple mechanistic explanation that tightly folded messages obstruct translation initiation and thereby reduce protein synthesis (22). Predicted mRNA structures for highly expressed GFPs characteristically contained many unpaired nucleotides near the start codon, whereas constructs expressed at low levels featured long hairpin loops (Fig. 2B and fig. S8), consistent with known obstructions to initiation (22). The region of strongest correlation between folding energy and expression did not overlap with the Shine-Dalgarno (SD) sequence, which suggested that SD occlusion by secondary structure (22, 23) did not play a major role in inhibiting expression, probably because our constructs contained no noncoding mutations. By contrast, the region of strongest effect overlapped
and Y (C or T). (B) Example alignment illustrating sequence diversity among 15 synthetic genes. Shaded boxes indicate first and second codon positions, which are conserved across the library. (C and D) The distribution of GC3 and CAI among the 154 synthetic GFP genes (C) is representative of the diversity among the 4288 endogenous E. coli genes (D).
SCIENCE
www.sciencemag.org
Downloaded from www.sciencemag.org on April 10, 2009
REPORTS
REPORTS ber of predicted transcription termination signals, the propensity for conformation changes into ZDNA, and the number of predicted ribonuclease (RNase) E cleavage sites (8). RNase E cleavage sites tended to reduce expression, as expected (24), and explained 4.7% of fluorescence variation. Although global GC content was not significantly correlated with fluorescence (r = –0.031, P = 0.7), GC content near the start codon was
Fig. 2. The determinants of gene expression. (A) Codon adaptation was not significantly correlated with fluorescence among the 154 GFP constructs (r = 0.14, P = 0.09). (B) Predicted 5′ mRNA folding energy was strongly correlated with fluorescence (r = 0.66, P < 10–15). For each construct, folding energy was calculated in a window spanning positions –4 to +37 relative to translation start; two sample structures are shown. (C) Sliding window analysis of mRNA folding and fluorescence. Local mRNA folding energies were calculated in a sliding window of length 42 nt. The significance of the correlation between local folding energy and fluorescence (negative log10 P value) is plotted as a function of window position along the sequence. Note the overlapping locations of the 30-nt ribosome–binding site (blue bar) and the window of strongest correlation between folding energy and fluorescence (partially overlapping red bar, nt –4 through nt +37).
Fig. 3. Expression levels of alternative GFP constructs. The distribution of log2 normalized fluorescence levels for (top) pGK8 (T7 promoter, no leader sequence), (middle) pGK14 (PBAD bacterial promoter, no leader sequence) and (bottom) pGK16 (trp-lac bacterial promoter, 28-codon leader sequence) expression vectors. Fluorescence varied substantially when expressed using T7 or bacterial promoter. The addition of a 28-codon leader sequence with low secondary structure produced uniformly high expression levels. www.sciencemag.org
SCIENCE
VOL 324
strongly correlated. But this was likely mediated by mRNA secondary structure; GC content was itself correlated with folding energy, and folding energy explained 10 times as much variation in fluorescence as was explained by GC content (8). GFP mRNA levels, as quantified by Northern blotting, varied across the library, but the extent of mRNA variation was three times smaller than that of corresponding fluorescence variation. We also observed 3′-truncated mRNA species that differed among GFP variants, which likely reflected different stabilities of mRNA degradation intermediates (fig. S9). mRNA levels were highly correlated with fluorescence (r = 0.53) and also with folding energy near the start codon (r = 0.33). These relations are consistent with the hypothesis that secondary structure influences both mRNA and protein levels through occlusion of ribosome subunit binding. Reduced ribosome binding increases mRNA exposure to nuclease digestion, which in turn decreases stability (25). Bacterial growth rates were strongly influenced by the codon usage of the expressed GFP construct (8). Elevated CAI was correlated with faster growth (r = 0.54, P < 9 × 10–13), whereas 5′ mRNA folding energy showed no significant correlation with growth (r = 0.12, P = 0.15). These results support the hypothesis that low codon adaptation in an overexpressed gene decreases cellular fitness (16), probably because retarded elongation sequesters ribosomes on the GFP mRNA and thereby hinders translation of essential mRNAs. The growth rate data could alternatively be explained by the hypothesis that high codon adaptation reduces the rate of deleterious protein misfolding (6, 26, 27). Although we do not rule out this possibility, in our experiments CAI was not correlated with the degree of misfolding, whether it was quantified by the ratio of Coomassie to fluorescence or by the ratio of mRNA to fluorescence (8). Our findings lead to the following prediction: Adding a stretch of codons with weak mRNA structure to the 5′ end of a gene with originally strong structure should increase expression, even if the additional codons have low CAI. To test this prediction, we fused a 28-codon tag to the 5′ terminus of 72 GFP constructs. The tagged constructs, which featured weak mRNA secondary structure and low CAI (8), produced consistently high expression, including those GFPs poorly expressed in nontagged form (Fig. 3). These results suggest that endogenous E. coli genes may have undergone selection for weak 5′ secondary structure. Consistent with this hypothesis, we found that the predicted secondary structures for the 4294 E. coli genes are significantly weaker near their start codons (nt –4 to +37) than immediately downstream (nt +38 to +79; Wilcoxon P < 10–15). Here, we have systematically quantified the effects of synonymous nucleotide variation on gene expression in E. coli, on the basis of unbiased sequences that control for regulatory context. The data reveal a predominant role for mRNA structure around the ribosomal binding site in shaping mRNA and protein levels. By contrast,
10 APRIL 2009
Downloaded from www.sciencemag.org on April 10, 2009
significantly with the 30-nt ribosome–binding site centered around the start codon (Fig. 2C). In a multiple regression, mRNA folding energy near the start codon (nt –4 through +37) explained nearly 10 times as much variation in expression levels as any other predictor variable, including the global GC content, CAI, the number of rare-codon sites or consecutive pairs, the length of the longest rare-codon stretch, the num-
257
neither local nor global codon bias had significant effects on mRNA or protein levels. This finding is consistent with the view that translation initiation, not elongation, is rate-limiting for gene expression (28), but it seems to contradict the well-known correspondence between codon bias and expression level for endogenous genes (11, 29). There is a simple explanation to this apparent contradiction, which reverses the arrow of causality between codon adaptation and gene expression. In one view, high CAI induces strong protein expression (10–12), whereas we argue that strong expression induces selection for high CAI. Unlike genome-wide correlations between CAI and expression levels [e.g. (11)], our analyses control for noncoding regulation and, thus, can distinguish between these two alternatives. We propose that the correspondence between codon adaptation and expression level among endogenous E. coli genes arises from selection to make translation efficient at a global level, rather than at the level of individual genes. High CAI increases the elongation rate, but because initiation is rate-limiting in translation, elongation rate does not significantly affect expression. On the other hand, rapid elongation sequesters fewer ribosomes on the message, thereby increasing the total rate of protein synthesis and accelerating cell growth. A similar model for codon preference has been proposed by Andersson and Kurland (16).
Well-adapted codons could also confer a metabolic advantage by reducing the load of misfolded proteins (26, 27). In either case, increasing a gene’s codon adaptation should not increase its expression. High codon adaptation in a gene should, however, improve cellular fitness to an extent that depends on its expression level. References and Notes 1. 2. 3. 4. 5. 6. 7. 8. 9. 10. 11. 12. 13. 14. 15. 16. 17. 18.
E. Zuckerkandl, L. Pauling, J. Theor. Biol. 8, 357 (1965). T. Ikemura, Mol. Biol. Evol. 2, 13 (1985). T. Ikemura, J. Mol. Biol. 151, 389 (1981). H. Akashi, Genetics 136, 927 (1994). J. L. Parmley, L. D. Hurst, Bioessays 29, 515 (2007). C. Kimchi-Sarfaty et al., Science 315, 525 (2007). A. G. Nackley et al., Science 314, 1930 (2006). Materials and methods are available as supporting material on Science Online. P. M. Sharp, W. H. Li, Nucleic Acids Res. 15, 1281 (1987). C. Gustafsson, S. Govindarajan, J. Minshull, Trends Biotechnol. 22, 346 (2004). G. Lithwick, H. Margalit, Genome Res. 13, 2665 (2003). A. H. Rosenberg, E. Goldman, J. J. Dunn, F. W. Studier, G. Zubay, J. Bacteriol. 175, 716 (1993). E. I. Gonzalez de Valdivia, L. A. Isaksson, Nucleic Acids Res. 32, 5198 (2004). S. Boycheva, G. Chkodrov, I. Ivanov, Bioinformatics 19, 987 (2003). J. R. Coleman et al., Science 320, 1784 (2008). S. G. Andersson, C. G. Kurland, Microbiol. Rev. 54, 198 (1990). A. Eyre-Walker, M. Bulmer, Nucleic Acids Res. 21, 4599 (1993). M. N. Hall, J. Gabay, M. Debarbouille, M. Schwartz, Nature 295, 616 (1982).
Leucine-Rich Repeat Protein Complex Activates Mosquito Complement in Defense Against Plasmodium Parasites Michael Povelones, Robert M. Waterhouse, Fotis C. Kafatos, George K. Christophides* Leucine-rich repeat–containing proteins are central to host defense in plants and animals. We show that in the mosquito Anopheles gambiae, two such proteins that antagonize malaria parasite infections, LRIM1 and APL1C, circulate in the hemolymph as a high-molecular-weight complex held together by disulfide bridges. The complex interacts with the complement C3-like protein, TEP1, promoting its cleavage or stabilization and its subsequent localization on the surface of midgut-invading Plasmodium berghei parasites, targeting them for destruction. LRIM1 and APL1C are members of a protein family with orthologs in other disease vector mosquitoes and appear to be important effectors in innate mosquito defenses against human pathogens. nopheline mosquitoes are the vectors of malaria that is caused by protozoan Plasmodium parasites and claims the lives of 1 to 3 million people annually (1). Parasites enter female mosquitoes during blood feeding and develop into ookinetes that on traversing the midgut epithelium and encountering the hemolymph are attacked by the mosquito immune system (2). A
A
Division of Cell and Molecular Biology, Department of Life Sciences, Imperial College London, Exhibition Road, London SW7 2AZ, UK. *To whom correspondence should be addressed. E-mail:
[email protected]
258
few survive to transform into oocysts, which generate sporozoites capable of reinfecting humans. The Anopheles gambiae leucine-rich repeat (LRR)–containing protein LRIM1 is a potent Plasmodium berghei antagonist that is also involved in phagocytosis of bacteria and melanization of parasites and Sephadex beads (3–5). Since the discovery of LRIM1, two other LRR proteins, APL1 (6) and LRRD7 (7), have been shown to limit Plasmodium infection. LRIM1 and APL1 (also called LRIM2) also mediate Plasmodium lysis and melanization in Anopheles quadriannulatus species A, contributing to the natural refractory phenotype of these mosquitoes
10 APRIL 2009
VOL 324
SCIENCE
19. K. E. Griswold, N. A. Mahmood, B. L. Iverson, G. Georgiou, Protein Expr. Purif. 27, 134 (2003). 20. G. Qing, B. Xia, M. Inouye, J. Mol. Microbiol. Biotechnol. 6, 133 (2003). 21. J. Duan et al., Hum. Mol. Genet. 12, 205 (2003). 22. M. Kozak, Gene 361, 13 (2005). 23. M. H. de Smit, J. van Duin, Proc. Natl. Acad. Sci. U.S.A. 87, 7668 (1990). 24. E. A. Mudd, H. M. Krisch, C. F. Higgins, Mol. Microbiol. 4, 2127 (1990). 25. I. Iost, M. Dreyfus, EMBO J. 14, 3252 (1995). 26. D. A. Drummond, J. D. Bloom, C. Adami, C. O. Wilke, F. H. Arnold, Proc. Natl. Acad. Sci. U.S.A. 102, 14338 (2005). 27. N. Stoletzki, A. Eyre-Walker, Mol. Biol. Evol. 24, 374 (2007). 28. N. Jacques, M. Dreyfus, Mol. Microbiol. 4, 1063 (1990). 29. S. Ghaemmaghami et al., Nature 425, 737 (2003). 30. We thank A. Helwak, J. Lucks, P. Sharp, L. Hurst, and members of the Plotkin and Tollervey laboratories for conceptual input; and A. Heath (Sigma), A. Aitken, J. Skerker, T. Shimizu, I. Iost, and J. Han for reagents, protocols, and equipment. Support provided by the Burroughs Wellcome Fund, James S. McDonnell Foundation, Penn Genome Frontiers Institute, and Defense Advanced Research Projects Agency “FunBio Program” HR0011-05-1-0057 (J.B.P.); Foundation for Polish Science and European Molecular Biology Organization (G.K.); Wellcome Trust/BBSRC grant BB/DO19621/1 (D.T.).
Supporting Online Material www.sciencemag.org/cgi/content/full/324/5924/255/DC1 Materials and Methods Figs. S1 to S9 References List of Oligonucleotides 23 December 2008; accepted 17 February 2009 10.1126/science.1170160
to parasites (8). The APL1 locus encompasses three distinct yet highly similar genes, which originate from recent duplications. Of these, APL1C is the sole P. berghei antagonist; APL1A and B do not influence infection intensities (9). We used single and double gene knockdowns (KDs) to compare the quantitative effects of LRIM1 and APL1 on P. berghei infections in susceptible A. gambiae and obtained an increase by a factor of ~50 in parasite infection intensities and no significant difference between double and single KDs (Fig. 1A). Quantitative real-time polymerase chain reaction confirmed equal and efficient silencing of LRIM1 and APL1 (using primers amplifying all three APL1 genes) and no detectable cross-silencing (fig. S1). The known role of LRIM1 in melanization (3, 4) prompted us to examine whether APL1 is also required in this immune reaction. We silenced LRIM1 and APL1 in A. gambiae L3-5 mosquitoes, which melanize virtually all invading P. berghei ookinetes (10). Indeed, both KDs produced identical phenotypes: no melanization and an increase by a factor of ~80 in live oocyst numbers (Fig. 1, B and C). Thus, in both Plasmodium-susceptible and -refractory mosquitoes, the effects of LRIM1 and APL1 are qualitatively and quantitatively indistinguishable, suggesting that the two genes function in a single genetic pathway that is disrupted by silencing either gene alone. Sequencing multiple LRIM1 and APL1C cDNA clones from adult female mosquitoes verified their strong similarities in gene architecture.
www.sciencemag.org
Downloaded from www.sciencemag.org on April 10, 2009
REPORTS
www.sciencemag.org/cgi/content/full/324/5924/255/DC1
Supporting Online Material for Coding-Sequence Determinants of Gene Expression in Escherichia coli Grzegorz Kudla, Andrew W. Murray, David Tollervey, Joshua B. Plotkin* *To whom correspondence should be addressed. E-mail:
[email protected] Published 10 April 2009, Science 324, 255 (2009) DOI: 10.1126/science.1170160
This PDF file includes Materials and Methods Figs. S1 to S9 References Other Supporting Online Material for this manuscript includes the following: (available at www.sciencemag.org/cgi/content/full/324/5924/255/DC1) List of Oligonucleotides
SUPPORTING ONLINE MATERIALS
METHODS
Gene synthesis In order to synthesize a library of genes with randomized codon usage, we reversetranslated the EGFP protein sequence (gi: 1543069) into a degenerate nucleotide sequence. Four reverse-translation methods were used to obtain degenerate sequences with varying GC content bias and E. coli codon adaptation index. The degenerate nucleotide sequences were split into three “thirds” of length approximately 240 nt each, and each third was further split into a set of 6 or 8 overlapping degenerate oligonucleotides (see Fig. 1). A text file containing these oligonucleotide sequences is included in the online supplement (1170160_SOM_oligos.txt). Desalted degenerate oligonucleotides were obtained from Sigma Genosys and assembled into thirds by two rounds of PCR using Phusion polymerase (Finnzymes) as described (1). Standard PCR conditions were: denaturation, 10 seconds, 98°C; annealing, 30 seconds, 45°C; elongation, 20 seconds, 68°C. PCR products were digested at both ends with BamHI and XbaI (1st third), XbaI and HpaI (2nd third) or HpaI and EcoRI (3rd third), sequentially cloned into a Gateway entry vector (pGK3, see below), and sequenced after each cloning stage. In addition, some GFP fragments were obtained by PCR from the pEGFP-N2 and pGFP-N2 constructs (2). We cloned and sequenced 122 1st-third fragments, 159 2nd-third fragments, and 65 3rd-third fragments, for a total of 84,774 sequenced base pairs. 56% of the synthetic fragments encoded the correct protein sequence. The average error rate of 1 per 458 basepairs was similar to error rates obtained in standard, non-degenerate gene synthesis (3). We obtained 154 synthetic GFP genes encoding the wildtype protein sequence, along with several frame-shift mutants later used as controls. Some genes shared one or two synthetic fragments in common.
Supplement Page 1
Bacterial strains and plasmids The E.coli strains used for library expression were BL21(DE3) [F– ompT hsdS(rB– mB–) dcm+ gal λ(DE3)] and DH5α [F'/endA1 hsdR17(rK-mK+) supE44 thi-1 recA1 gyrA (Nalr) relA1 D(laclZYA-argF)U169 deoR (F80dlacD(lacZ)M15)]. The DB3.1 strain (Invitrogen) was used for cloning and amplification of Gateway expression plasmids, and the DH5α strain was used for cloning and amplification of all other plasmids. pGK3 is a Gateway entry vector. It was obtained by partially digesting pENTR-2B (Invitrogen) with XbaI and NotI, and ligating the 2701-nt fragment with annealed 5’-phosphorylated oligos: ggccctgcacattcagactcgagc and ctaggctcgagtctgaatgtgcag. pGK8 is an IPTG-inducible Gateway expression vector with a T7 polymerase promoter. It was generated by inserting the Gateway cassette RfA (Invitrogen) into the pET15b vector (Novagen) digested with XbaI and XhoI. pGK14 and pGK16 are Gateway expression vectors with bacterial polymerase promoters. pGK14 is arabinose-inducible and was constructed by inserting the RfA cassette into pBAD33 (4) digested with SmaI, while pGK16 is IPTG-inducible and was generated by inserting the RfA cassette into pTRC99a (5) digested with EcoRI. To clone the GFP genes from the pGK3 entry vector to pGK8, pGK14 or pGK16 expression vectors, Clonase II (Invitrogen) was used according to manufacturer’s instruction. GFP genes cloned into pGK8 or pGK14 retained their original start codons, but recombination into pGK16 resulted in an in-frame fusion of 28 codons to the 5’ end of the GFP genes. The tagged constructs featured weak mRNA structure near the start codon (folding energy ΔG = -6.1 kcal/mol, as compared to an average energy -9.7 kcal/mol among non-tagged genes) and low codon adaptation (CAI 0.2, as compared to an average CAI 0.3 for codons 1-28 of non-tagged genes). RNA and protein measurements Bacteria were transformed using Gateway recombination reactions. Four replicate colonies for each GFP were inoculated into LB medium with 50 ug/mL ampicillin and grown overnight to saturation in roller drums. For fluorescence measurements, cells were diluted 1:15 into 150 uL fresh medium in a 96-well plate, grown on a vibrating platform shaker (Heidolph) for 1 hour at 37°C, and induced with 1 mM IPTG (pGK8 or pGK16 plasmids) or 2% L-arabinose (pGK14 plasmids). GFP fluorescence and OD were
Supplement Page 2
measured in a Spectramax microplate reader (Molecular Devices). Fluorescence variation was consistent across a broad range of experimental conditions (Fig. S3). To quantify GFP independently of its fluorescence activity, we used Coomassie staining and western-blotting. Nine GFP constructs were assayed by western blot, and 123 constructs by Coomassie. 50 uL samples of BL21(DE3) cells expressing GFP from the pGK8 plasmid were taken 3 hours after 1 mM after IPTG induction. The cells were centrifuged, re-suspended in 50 uL distilled water, mixed with 50 uL SDS-PAGE loading buffer with SDS and 2-mercaptoethanol, and boiled for 5 minutes. The samples were then separated on 4-12% acrylamide NU-PAGE Novex Bis-Tris gels. R-250 Coomassie stained gels were scanned and quantified with the Aida image analysis software. Selected bands from noninduced cells were used to normalize GFP staining intensity between gels. Western blotting was performed using a polyclonal anti-GFP antibody (#2555 Cell Signaling) and the AlexaFluor 647-labelled donkey anti-rabbit antibody (A31573, Invitrogen). Blots were scanned using a Fuji imager and analyzed with the Aida software. We analyzed mRNA expression by northern blotting 79 GFP constructs. For RNA measurements, overnight cultures were diluted 1:15 into 3 mL fresh medium, rotated for 1 hour at 37°C, induced with IPTG, rotated for 1.5 more hours, and 2 mL samples were centrifuged and frozen in liquid nitrogen. Cells were then lysed on ice in 0.5 mL lysis buffer (20 mM sodium acetate, 0.1% SDS, 1 mM EDTA, pH5.5), extracted twice with phenol (at 65°C) and once with chloroform (at room temperature). RNA was then precipitated with ethanol/sodium acetate, glyoxylated, separated on 1.2% agarose/BPTE gels and transferred to positively charged nylon membranes (Amersham Biotech) as described (6). 4 ug total RNA was loaded in each lane, and equal loading was confirmed by ethidium bromide staining and probing against 23S rRNA as described (7). For GFP mRNA quantification, fragments of the 5’ and 3’ UTRs were amplified from pGK8GFP008 using the following primers: 5’UTR_U, ggggaattgtgagcggataa; 5’UTR_L, gtcgactgaattggttccgg; 3’UTR_U, agtggtgatatcaagcttat; 3’UTR_L, tatgctagttattgctcagc. Random-primed Klenow probes were then prepared and hybridized as described (6). Blots were analyzed using a Fuji imager and Aida software.
Supplement Page 3
Bacterial growth rates We assessed growth rates by optical densities of cells subsequent to induction. The addition of 1 mM IPTG retarded growth in all clones, with effects ranging from a 2-fold decrease in growth rate to complete growth arrest for different GFP variants. At three hours post induction, cell densities varied 2-fold across the library.
The correlation
between CAI and fluorescence is even weaker after normalizing by optical density, i.e. fluorescence per cell; and the correlation between 5’ folding energy and fluorescence is even stronger after normalizing by optical density. Quantifying rates of protein mis-folding We used Coomassie measurements to analyze the possible influence of codon adaptation on rates of protein mis-folding in our experiments.
For this purpose, we
quantified the rate of mis-folding, per GFP protein, as one minus the ratio of fluorescence (i.e. functional protein) to Coomassie (i.e. total protein). The Coomassie staining method is insensitive to changes in native protein conformation (the protein is denatured prior to electrophoresis) or to minor sequence changes caused by occasional mis-translation. We first converted Coomassie and fluorescence intensities into the same scale, mg GFP per ml, based on standardization curves obtained from serial dilutions. Both Coomassie levels and fluorescence levels exhibited linear responses to protein concentration across the range of intensities observed in our experiments. The resulting correlation between CAI and one minus fluorescence/coommassie was not significant (r = -0.073, p = 0.42), indicating that codon adaptation did not correlate with mis-folding rate in our experiments. We alternatively quantified mis-folding rate as the ratio of mRNA (i.e. all message) to fluorescence (i.e. functional protein). CAI was not significantly correlated with this ratio either (r = 0.09, p = 0.42).
Fluorescence normalization We normalized fluorescence levels across experiments using a set of 12 control GFP constructs (including 2 non-fluorescent frame-shift mutants), grown in quadruplicate on every 96-well plate. A reference experiment was chosen arbitrarily, and fluorescence values from each subsequent experiment were compared to the reference. Least square
Supplement Page 4
linear fits were calculated, and the resulting slope and intercept values were used for normalization. Fluorescence values were highly reproducible across biological replicates. Comparing the 10 non-mutant control GFPs across 18 plates resulted in an average correlation coefficient of 0.979. Similarly, a non-parametric ANOVA indicated a significantly larger fluorescence variance across GFP constructs than across replicates (p < 1E-15).
Single-mutation GFP constructs We performed a separate silent mutagenesis experiment on the first five codons of one of the genes, GFP_020. We identified five cases in which a single silent mutation altered 5’ folding energy, by at least 3.9 kcal/mol. Among the mutants, the gene with weaker predicted 5’ structure had higher expression in four cases (by 18%, 35%, 49% and 83%), and lower expression in one case (by 9%). We also obtained a pair of genes that differed by two silent sites (nt 6 and 15). Again, these mutations had a substantial effect on the predicted 5’ folding energies (dG = -11.7 and dG = -7.7, respectively), and the construct with stronger structure exhibited a much lower protein level (fl = 2473 and fl = 8051, respectively). These results confirm that the relationship between folding energy and expression extends to constructs that differ by only a few mutations in their 5’ region. Pairs of GFP genes differing by a single mutation: nucleotides 1-15 (seq1) ATGGTGAGCAAGGGG ATGGTGAGCAAGGGA ATGGTGAGCAAGGGG ATGGTGAGCAAGGGG ATGGTGAGCAAGGGC
nucleotide substitution (seq1 → seq2) G6 -> T G6 -> T C9 -> T G6 -> C G6 -> T
energy change (seq2 - seq1) 6.2 kcal/mol 6.2 kcal/mol 3.9 kcal/mol 6.1 kcal/mol 4 kcal/mol
fl change (seq2-seq1)/seq1 35% 18% 49% -9% 83%
Statistical analyses All statistical analyses were performed in the R software package (8). Correlations reported in the main text are quantified by the Spearman rank correlation coefficient and its associated p-value. Supplement Page 5
We calculated the frequency of rare codon pairs using the CPB metric of Coleman et al. (14). The frequency of rare pairs was not significantly correlated with fluorescence (r = 0.07, p = 0.35). Similarly, the palindromic sequence CTAG is strongly underrepresented in the E. coli genome (16) , but the frequency of this motif in a GFP gene did not correlate with its fluorescence (r = -0.12, p = 0.16). For the multiple regressions, sequence-derived covariates associated with each GFP construct included: the codon adaptation index (9) calculated for the entire or partial coding sequence; the number of rare codons (sites with CAI < 0.1) in the coding sequence; the number of pairs of consecutive rare codons; the length of the longest stretch of consecutive rare codons; the GC3 content of the coding sequence; the number of predicted rho-independent transcription termination signals, calculated using the RNAMotif program (10); the propensity for conformation changes into Z-DNA, calculated using the Zhunt program (11); the number of potential RNAse E cleavage sites, calculated as in (12); the minimum free energy of predicted mRNA secondary structure, for the entire gene sequence or portions of the sequence, calculated using the hybrid-ss-min program (13) (version 3.4, NA = RNA, t = 37, [Na+] = 1, [Mg++] = 0, maxloop = 30, prefilter = 2/2); a categorical variable indicating whether or not the first third of the GFP was synthesized using the “optimized” EGFP sequence (gi: 1543069). We performed a multiple regression in order to quantify the relative importance of the various predictor variables in determining rank fluorescence levels. The output of this regression, shown below, highlights the predominant influence of mRNA folding energy near the start of the GFP sequence (nt -4 to +37): Multiple Regression Coefficients FreeEnergy-4to+37 CAI GC3 nsites_lowCAI npairs_lowCAI nstretches_lowCAI longeststretch_lowCAI FirstThirdEGFP Terminator.Predicted
Estimate 7.462 152.911 -56.326 2.575 -5.324 2.746 5.551 -17.627 0.729
Std Error 1.181 136.360 51.445 1.155 1.798 4.070 4.143 9.998 3.362
Supplement Page 6
T Pr(>|t|) 6.318 3.20E-09 1.121 0.26402 -1.095 0.27543 2.230 0.02731 -2.962 0.00358 0.675 0.501 1.340 0.18235 -1.763 0.08002 0.217 0.82868
zDNA.Predicted N_RNAaseE
1.269 -0.836
8.023 0.320
0.158 0.87453 -2.614 0.00991
Residual standard error: 29.42 on 142 degrees of freedom Multiple R-Squared: 0.5961, Adjusted R-squared: 0.5649 F-statistic: 19.05 on 11 and 142 DF, p-value: < 2.2e-16 In order to control for possible confounding effects arising from collinearity of predictor variables we also performed an analogous principal component regression. The four principal components that explained the most variance in rank fluorescence are shown below. The tables below indicate the loadings of the predictor variables on each of the four principal components, the amount of variance in fluorescence levels explained by each component, and the total amount of variance in fluorescence explained by each predictor variable, summed across all components (as in (15)): Principal Component Regression Loadings Comp1 FreeEnergy-4to+37 0.956 CAI 0 GC3 0 nsites_lowCAI 0.001 npairs_lowCAI 0.027 nstretches_lowCAI 0.008 longeststretch_lowCAI 0.001 FirstThirdEGFP 0.005 Terminator.Predicted 0.002 zDNA.Predicted 0 N_RNAaseE 0 % Variance Component Explained: Comp1 47.23 Comp2 4.99 Comp3 4.15 Comp4 1.55 Comp5 0.55 Comp6 0.37 Comp7 0.24
Comp2 0 0 0 0.249 0.07 0.003 0.001 0 0 0 0.676
Comp3 0 0 0 0.64 0.047 0.001 0 0 0 0 0.312
Comp4 0.005 0.001 0 0 0 0 0.014 0.977 0 0.002 0
Predictor Variable FreeEnergy-4to+37 CAI GC3 nsites_lowCAI npairs_lowCAI nstretches_lowCAI longeststretch_lowCAI Supplement Page 7
Total % Variance Explained 45.175 0.372 0.22 3.972 1.958 0.545 0.542
Comp8 Comp9 Comp10 Comp11
0.22 0.11 0.11 0.02
FirstThirdEGFP Termintor.Predicted zDNA.Predicted N_RNAaseE
1.755 0.282 0.114 4.68
We also performed multiple regressions of rank fluorescence against GC3, CAI, and free energy associated with mRNA folding, each calculated in a window from nt -4 through nt 37. (The “A” in ATG is assigned nt 0.) Both the standard and principal component versions of this regression indicate that mRNA folding energy is the dominant determinant of expression levels: Multiple Regression Coefficients
Estimate
Std Err T
Pr(>|t|)
FreeEnergy-4to+37 GC3-4to+37 CAI-4to+37
0.45472 -0.29785 0.1078
0.09016 5.043 0.09296 -3.204 0.06272 1.719
1.30E-06 0.001655 0.087684
Residual standard error: 31.48 on 150 degrees of freedom Multiple R-Squared: 0.5115, Adjusted R-squared: 0.5017 F-statistic: 52.35 on 3 and 150 DF, p-value: < 2.2e-16 Principal Component Regression LOADINGS FreeEnergy-4to+37 GC3-4to+37 CAI-4to+37
Component Comp1 Comp2 Comp3
% Variance Explained: 42.24 6.12 0.6
Comp1 0.997 0.003 0.000
Comp2 0.001 0.471 0.527
Comp3 0.002 0.526 0.473
Predictor Variable FreeEnergy-4to+37 GC3-4to+37 CAI-4to+37
Total Variance Explained 42.118 3.322 3.508
We also performed multiple regressions of fluorescence levels against mRNA levels, folding energy, and CAI. Folding energy explained significantly more variation in fluorescence levels than mRNA levels explained: Supplement Page 8
%
Multiple Regression Coefficients
Estimate
Std Err t
Pr(>|t|)
FreeEnergy-4to+37 Northern CAI
0.47425 0.37767 0.1469
0.08785 5.399 0.08723 4.33 0.08293 1.771
7.58E-07 4.56E-05 0.0806
Residual standard error: 16.68 on 75 degrees of freedom Multiple R-Squared: 0.4918, Adjusted R-squared: 0.4715 F-statistic: 24.19 on 3 and 75 DF, p-value: 4.693e-11 Principal Component Regression Loadings FreeEnergy-4to+37 Northern CAI
Comp1 0.54 0.401 0.059
Comp2 0.017 0.233 0.75
Comp3 0.443 0.366 0.191
Component
% Variance Explained
Predictor Variable
Total % Variance Explained
Comp1
38.46
FreeEnergy-4to+37 22.636
Comp2
11.23
Northern
19.41
Comp3
3.75
CAI
11.394
Sliding window analysis of local folding energy and fluorescence We analyzed the relationship between fluorescence intensity and folding energy in sliding windows across the GFP sequence. We chose a window of size 42 bases, and we slid the location of the window in increments of three bases across the gene sequence, including 5’ UTR. We calculated the Spearman correlation coefficient between predicted folding energy within each window and fluorescence intensity, across the library of GFP genes. We identified many regions of highly significant positive correlations, including the region from nt -4 to nt 37 for which folding energy explains nearly half of the variation in fluorescence intensity (r = 0.665, p < 1E-15, Fig 2b).
Supplement Page 9
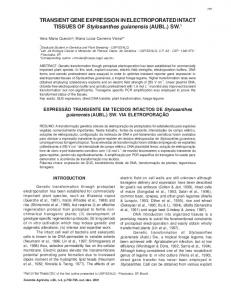
SUPPLEMENTARY FIGURE CAPTIONS SUPPLEMENTARY FIGURE 1. Distance tree of synthetic GFP genes. An un-rooted tree generated by neighbor-joining, based on the pairwise hamming distances among 168 synthetic GFP genes. SUPPLEMENTARY FIGURE 2. GC content. GC content in a moving window across three example GFP constructs. SUPPLEMENTARY FIGURE 3. Reproducibility of fluorescence measurements in standard experimental conditions. pGK8-GFP constructs were induced with 1 mM IPTG and grown for 3h at 37°C. (A) 24 different pGK8-GFP constructs were grown in a 96-well plate, each in 4 replicates. Groups of neighboring bars of same color represent independent replicate clones with the same GFP sequence. (B) Average fluorescence of a set of 12 pGK8-GFP constructs, including two non-fluorescent mutants (bars 11 and 12). Error bars represent one standard error, n = 14 to 18 experiments. SUPPLEMENTARY FIGURE 4. Reproducibility of fluorescence measurements across experimental conditions. (A) Fluorescence 3h after induction (diamonds) or 6h after induction (triangles) as a function of fluorescence 1.5h after induction. pGK8-GFP clones were induced with 1 mM IPTG and grown at 37°C. (B) Fluorescence in M9 (minimal) medium and LB (rich) medium. pGK8-GFP clones were induced with 1 mM IPTG and grown for 3h at 37°C. (C) Fluorescence from T7 promoter (pGK8) and bacterial promoter (pGK14). pGK14-GFP constructs were transformed into DH5a cells, induced with 2% L-Arabinose and grown for 3h at 37°C., while pGK8-GFP constructs were transformed into BL21-DE3 cells, induced with 1 mM IPTG and grown for 3h at 37°C. (D) Fluorescence as a function of inducer concentration. pGK8-GFP constructs were induced with 1 mM or 0.02 mM IPTG and grown for 3h at 37°C. SUPPLEMENTARY FIGURE 5. Western and FACS measurements. (A) Correlation between GFP fluorescence measured by FACS and by spectrofluorometer. (B) Western blot analysis of GFP protein levels. (C) Correlation between GFP protein levels and fluorescence. Protein levels were assessed from the western blot analysis shown in panel (B). pGK8-GFP constructs and standard experiment conditions were used in this figure. Supplement Page 10
SUPPLEMENTARY FIGURE 6. The site-specific influence of silent nucleotide variation on protein levels, across the GFP sequence. At each silent position we plot the statistical significance (negative log p-value) of a regression comparing nucleotide identity and fluorescence levels among the 154 GFP constructs. At the codon positions above the dashed line, the choice of G, C, A, or T in the third base-pair was significantly correlated with fluorescence, after Bonferroni correction for multiple hypotheses. SUPPLEMENTARY FIGURE 7. Free energy and gene expression under a bacterial promoter. The relationship between rank 5’ mRNA folding energy and rank fluorescence among pGK14-GFP constructs (Spearman r = 0.77 p < 4E-16). SUPPLEMENTARY FIGURE 8. Predicted mRNA secondary structures for representative examples of GFP constructs. The figure shows three GFP constructs with high fluorescence (top row), and three GFP constructs with low fluorescence (bottom row). Along with the secondary structure of region nt -4 through nt +37, the figure also indicates the free energy of each secondary structure (kcal/mol) and the fluorescence of the corresponding GFP construct. Note that GFP constructs expressed at low levels feature mRNA structures with large hairpin loops, whereas GFP constructs expressed at high levels feature structures with many unpaired nucleotides. SUPPLEMENTARY FIGURE 9. Northern blot analysis of GFP mRNA levels. mRNA from duplicate pGK8-GFP clones was isolated and analyzed by northern blotting, using probes against GFP 5'UTR and 3'UTR sequences common to all clones. Bottom panel, ethidium bromide staining of total cellular RNA. Note the variable degradation patterns of mRNAs across different GFP constructs. NI denotes no inducer.
Supplement Page 11
Supplementary References 1. 2. 3. 4. 5. 6. 7. 8. 9. 10. 11. 12. 13. 14. 15. 16.
J. S. Han, J. D. Boeke, Nature 429, 314 (May 20, 2004). G. Kudla, L. Lipinski, F. Caffin, A. Helwak, M. Zylicz, PLoS Biol 4, e180 (Jun, 2006). S. J. Kodumal et al., Proc Natl Acad Sci U S A 101, 15573 (Nov 2, 2004). L. M. Guzman, D. Belin, M. J. Carson, J. Beckwith, J Bacteriol 177, 4121 (Jul, 1995). E. Amann, B. Ochs, K. J. Abel, Gene 69, 301 (Sep 30, 1988). J. Sambrook, D. Russell, Molecular cloning (Cold Spring Harbor Laboratory Press, Cold Spring Harbor, New York, 2001), pp. A. El Hage, J. H. Alix, Mol Microbiol 51, 189 (Jan, 2004). R Development Core Team, R: A language and environment for statistical computing (R Foundation for Statistical Computing, Vienna, Austria, 2005), pp. P. M. Sharp, W. H. Li, Nucleic Acids Res 15, 1281 (Feb 11, 1987). E. A. Lesnik et al., Nucleic Acids Res 29, 3583 (Sep 1, 2001). P. S. Ho, M. J. Ellison, G. J. Quigley, A. Rich, Embo J 5, 2737 (Oct, 1986). J. A. Bernstein, A. B. Khodursky, P. H. Lin, S. Lin-Chao, S. N. Cohen, Proc Natl Acad Sci U S A 99, 9697 (Jul 23, 2002). N. R. Markham, M. Zuker, Nucleic Acids Res 33, W577 (Jul 1, 2005). J. R. Coleman et al., Science 320, 1784 (Jun 27, 2008). J. B. Plotkin, H. B. Fraser, Mol Biol Evol 24, 1113 (May, 2007). C. Burge, A. M. Campbell, S. Karlin, Proc Natl Acad Sci U S A 89, 1358 (Feb, 1992
Supplement Page 12
GF ... P8... ... ... ..G .. FP 21 1 . ... . .... ...G ...... .... FP .. G F 21 .... P25 9...... .. 2 .. . ..G .... ... ...... FP .... ... .... .G 16 ... .G FP 8.. ..G F 1 ... FP P16 67. ... .. ... 244 9.... ..... ... . . . . ... ... . ..G ... .. . . F .. ... ....G....G ... P2 ... F F ... 3 . . G P2 P 2 . . G 4.... FP 46 22. F P ... . . . 24 .... ... 23 . 0. ... .. 7. ... ... ... ... . .
. ...
F .G ... .. ..
........ G
........GFP22 6........
.. ... . ... . .. . . .. ... 256 0. ... 17 .. FP 5. .... F P ...... 16 ...G ... 7 .. .G .. . 1 . . FP ..... ..... ... 245 P2 0..... 4 .. . . . ..G . 25 FP GF P22 .... ... . . 5 .... .G FP .... GF ... . . 1 . . . . .... ........... P2 ..G ...... .... P3 ... GF 229 P ... .... GF .... .......GF .... . .... ....... . 43 P1 GF .... ... .... ..... 147 FP 148........ ...G P ..... ...GF ..... . .. . . . .. 4 P15 ..G F .... . ..... 99.... GFP ........ ........GFP151........
.... .... . . . . GF P .... 19 ... ... GFP 9.... ... ..G .. 21 ... F P 0 . . .. ..G ... ... 2 2 .. .. . FP ..G . 8 .. 24 ..... FP 3. ...G ...... 16 . ... ... 3. ... FP2 ... ... 41 ..G ... ... . FP .... . 25 3. ... ... ... . ... ..G FP 23 6.
2........ ........GFP10 ........GFP98........ ........GFP 14 9. ... ... . ...... ... ..GFP10 .. 6 . . .. . . .... . G FP1 57... .....
. ... ... . 4. ... 14 .... .. . FP P97 2..... 5 ..G F .... ... ..G FP1 .... . . . 6 . G ... 9 ..... .... .... .... FP 55. 6.... G .... FP1 .... P15 .. ............G ..GF P109...... ..............GF
.. 3...... GFP1 ... ........ P100..... ........GF
.... . ... 103 .. FP 6...... ..G P14 F .G ............G FP145........ ........ ...........G . 153 .. ........ .. GFFP P111 ........ ........ GFP ...... 104........ ..... ..GFP1 10.. ...G . .. . F . . P1 ... .. ..............G 58. . . ..... . .... .G FP1 . . .. G ..GF FP1 05..... ... FP P 5 1 0 0 ... 1 0 1. 8... ..... ... ... .. ... .
0.02
Supplementary Figure 1
...
...
.
.. . . . . ... ... 7... .. . 2 0 . 24 P2 ..... FP .GF 221 .... G . .. .. P ... ... ......GF 96. . .. ... P1 ... .... ... ... .GF 3.... ....... 47.. 2 . . P .. 1 9 9 .... FP FP23 ...GF ..... ... ..G...G ..... 33... 3..... . . . 2 P20 ..... ... ..... P GF GF 230... .... .... .... .......GFP ..... ... .... 05. ........ 2 P 4 GF P22 0........ 0 .....GF .... ... ...GFP2 ..... ....... ...... . 8 0 1. . FP2 G . . P16 .. . . . ... .. ..GF ...... FP181.... G ........ P182........ F ........G..GFP185........ ...... 84........ ..GFP1FP189........ ........... ...G ........GFP183........ ........GFP18 8. ........GF ....... P186.... .... .. .............GFP171 ........ .GFP ...... ....... 174....... . ..GF .GFP 1 P17 5.... 73........ . .... ............GF ...G P17 ... FP1 2...... .. .... ......G ...........G 87.... .. ... F ..G FP .... ...... .GF P17 FP1 178. .. ...... P1 9.. 8 60 ... 0... ..... ..G.G .... FFPP1 ...... ... . 16 59. .. 2. ..... ... . . ... .
. ... ... 4 . .. 16 ...... FP 76 .G P1 ... GF ....... .....
FP22 7...... ..
.... .
... ... ..... . ...G ... ....G GF FP ..... F P4 1 G P 1 .... 2..... FP2 51.. ..... ....G ... 5 .. .. ..... .... .... . ...G F ........ FP40.P22.. .... . . GFP ..... .... 2 . . ........GF 1........ P26...... .. ........GFP23........
.. ... .. ... ...... 0 2 0 . FPFP6 ..... . . . ..... ..G .G . . 4 . . . . 1 8.. ....... FPP1 ..... ...GGF 4... . . 3 .... ... . .GFP .. . . . ..
. . ..
.. ........G .......... ..GFPFP36........ ..... ........GFP 134....... ..............GF ..GFP73........ . . . P ............GGFP 55... 114... ..... ... ..G FP 44 ..... ..G F 58 ..... FP P1 ..... ... 45 26. ... ... .... ... ... ..
........GF P135..... ........GFP42 ........... .... ... .G F P 89........ ........GFP 84... ..... ..... ........GFP83... 85............ ........GFP .. FP941.............. . 9 .. . ........G GFP 86.. ..... ..........GFPP81....... ...... ....GF 87.. .......... ... .... .GFP P32............... F 7 0 .. ... .... .....G FP2 P3 9.. ... G F 2 . . . . ..G F P .... ...... ...G .. ...
.. ... ..... ... .....G.GF . .... ....G FPP31 2 .... ....G FP1 8........ .... FP 31 ... ... G . ..... ...... FP 129 .... .. ...G .G 1 .. .. ...... FP11FP6430... ........ ..GF 5.. ... ... P5 ... ... .. .. ........G ......GFP64........... .. 6.... FP142 ........GF ........ .... P68........ ........GFP79........ ........GFP65........ ........ ........GFP137 P78........ .. ........GF FP69....... ........G141............... GFP 70 ... ........ ....GFP74......... . . . . . GFP 3......... ..... 1 .. .. . ... ..... GFP1P37.P71 ........ F F .. .. ... .. ... ....G ...G P618... .... ..... .GF P3 . ... F ... .....G . ..
. 38 ... FP2 . . ... ..G 94 .... P1 ..
...
...
.
GC3
1
0.5
0 150
300
450
Position (bp)
Supplementary Figure 2
600
Supplementary Figure 3
6
53
GF P
P7
GF
42
GF P
38
GF P
7
6
P3
GF
GF P3
27
GF P
18
GF P
3
P1
2
GF P1
8
GF P
GF
0
P3
P3 GF P8 GF P1 2 GF P1 3 GF P1 8 GF P2 7 GF P3 6 GF P3 7 GF P3 8 GF P4 2 GF P7 6 GF P5 3 GF P2 0 GF P2 1 GF P2 2 GF P2 5 GF P2 6 GF P2 8 GF P2 9 GF P3 0 GF P3 1 GF P3 4 GF P4 1
GF
0
GF
A 10000
8000
6000
4000
2000
B 10000
9000
8000
7000
6000
5000
4000
3000
2000
1000
A
B 1500 R2 = 0.97
R2 = 0.86
15000
10000
R2 = 0.99
5000
fluorescence (M9)
fluorescence (3h or 6h)
20000
0
1000
500
0 0
1000
2000
3000
0
fluorescence (1.5h)
5000
10000
fluorescence (LB)
D
C
150000 fluorescence (1 mM IPTG)
4000 2
fluorescence (DH5a)
R = 0.67 3000
2000
1000
R2 = 0.83 100000
50000
0
0 0
5000
10000
0
50000
100000
fluorescence (0.02 mM IPTG)
fluorescence (BL21)
Supplementary Figure 4
A
B 30
fluorescence (FACS)
1500 R2 = 0.95
Western, anti-GFP
15
1000
500
0 0
2000
4000
6000
8000
10000
fluorescence (fluorometer)
C protein amount (western blot)
12000 10000
R2 = 0.97
8000 6000 4000 2000 0 0
5000
10000
fluorescence (fluorometer)
Supplementary Figure 5
Significance (-log10 p)
10
8
6
4
2
0 0
200
400
Position (nt)
Supplementary Figure 6
600
Rank fluorescence
r2 = 0.59 60
40
20
0 20
40
Rank free energy
Supplementary Figure 7
60
a 5’
a
c
c
g
g g
10
a
g
c
a
c
t
t
g
t
g
g
g
g
a
g g
30
40
g
c
g
GFP 61 Fl = 8740 dG = -4.3
a a
t
g c
a
t
g
g
g
c
c t
g
c
g
a
t
g
20
a
a
a
a 5’
t
t
20
10
a
g
a
g g
g
a t
t
c
a t
g
a a
t
t c
a
g
GFP 145 Fl = 278 dG = -15.4
a
a
a
a
30
g
g
t
g
t
t 40
g
20
g a
t
30
a
a
g g
g
c
t
a
c
t
5’
g t g g
t c
g
a
3’
a a
a
g
t
g
a
t
g
a
10
c
c
a g
g
c g
t
c
c t
g
a g
a g
a
c
c
t
g
g
g
GFP 205 Fl = 1513 dG = -14.7
c g
a
10
t
5’
a
3’
3’
40
20
g
a
a
GFP 51 Fl = 8565 dG = -5.5
g
c
c t
Supplementary Figure 8
30
g
a
t
t
c
t
t
t
t
g
a
g
g
a
a
c
t
a 40
20
g
a g
g
GFP 40 Fl = 8632 dG = -6.1
t
c
a
g
c
a
g
a
t
a
g
5’
g
g
3’
a
g
a
t
g
a
g
g
c
20
g
t
t
a
t
c
aa
a
t
t
a
c
g
g
a
t
g
g
g
a
g
t
a
t
g
a
a
c
g
t
g
c
c
a
t
t
g
g
t
g
t
3’
t
g
t
a
g
GFP 78 Fl=874 dG = -12.6
t
a
g
10
c
c
g
30
c
t
a
a
t
a
10
a
5’
40
40
3’
GFP_3’UTR
GFP_5’UTR
EtBr
2
3
8
12
13
25
27
34
36
Supplementary Figure 9
36 N.I.
51 54 GFP_ID