Coherence estimation in synthetic aperture radar data based on speckle noise modeling Carlos López-Martínez and Eric Pottier
In the past we proposed a multidimensional speckle noise model to which we now include systematic phase variation effects. This extension makes it possible to define what is believed to be a novel coherence model able to identify the different sources of bias when coherence is estimated on multidimensional synthetic radar aperture (SAR) data. On the one hand, low coherence biases are basically due to the complex additive speckle noise component of the Hermitian product of two SAR images. On the other hand, the availability of the coherence model permits us to quantify the bias due to topography when multilook filtering is considered, permitting us to establish the conditions upon which information may be estimated independently of topography. Based on the coherence model, two coherence estimation approaches, aiming to reduce the different biases, are proposed. Results with simulated and experimental polarimetric and interferometric SAR data illustrate and validate both, the coherence model and the coherence estimation algorithms. © 2007 Optical Society of America OCIS codes: 280.6730, 120.3180, 120.5410, 030.6140.
1. Introduction
In multidimensional synthetic aperture radar (SAR) imagery, the complex correlation coefficient has been revealed as an important source of information. In particular, the correlation coefficient amplitude, named coherence, apart from depending on the SAR system characteristics, is also influenced by the physical properties of the area under study. The complex correlation coefficient is the most important observable for SAR interferometry (InSAR).1 On the one hand, and considering the acquisition geometry, it has been demonstrated that its phase contains information about the Earth’s surface topography. Therefore, InSAR phase data are employed to derive digital elevation models (DEMs) of the terrain. On the other hand, despite there not being a complete understanding about the parameters and the physical processes affecting the interferometric coherence, it has been shown that this parameter may be successfully employed to characterize the properties and the dynamCarlos López-Martínez (
[email protected]) is with the Department of Signal Theory and Communications, Universitat Politècnica de Catalunya, Barcelona, Spain. E. Pottier is with the Institut d’Electronique et de Télécommunications de Rennes, the SAR Polarimétrie Holographie Interférométrie Radaargrammétrie Team, Université de Rennes 1, 35042 Rennes Cedex, France. Received 7 July 2006; accepted 28 August 2006; posted 29 September 2006 (Doc. ID 72787); published 17 January 2007. 0003-6935/07/040544-15$15.00/0 © 2007 Optical Society of America 544
APPLIED OPTICS 兾 Vol. 46, No. 4 兾 1 February 2007
ics of the Earth’s surface. In Ref. 2, interferometric coherence was employed to detect the descent paths of pyroclastic flows after the eruption of the Unzen volcano. Coherence has also been employed for the study and retrieval of stem volume over forested areas.3 In Ref. 4, techniques based on interferometric coherence were found to be a good alternative to optical techniques in forestry applications. Diverse studies have also demonstrated the usefulness of the interferometric coherence for the study of dry5 and wet6 snow covered areas, as well as for the analysis of ice covered rivers.7 The interferometric coherence is also helpful for the characterization of glaciers, valleys, and fjord ice, as shown in Ref. 8. Weydahl8 demonstrated that coherence is important for the detection of spatial details that are not visible in amplitude measurements. The coherence represents an important source of information when polarimetric SAR (PolSAR) data are addressed. In particular, the complex correlation coefficient parameter derived from circularly polarized data has been employed to characterize rough surfaces,9 to study the sea surface,10 or to discriminate sea ice types.11 When obtained from linearly polarized data, the coherence has been employed to characterize the forest cover in the Colombian Amazon.12 In conjunction with polarimetric techniques, i.e., polarimetric SAR interferometry (PolInSAR), the interferometric coherence is employed to retrieve the height of the forest vegetation13 or the crop plants.14 The coherence is also important in diverse aspects
related to the processing of InSAR data such as phase unwrapping,15 DEMs quality assessment,16 or assessment of the SAR system itself.17 All the techniques listed in the previous paragraph rely on a correct estimation of the coherence parameter. The estimated coherence values are overestimated, especially for low coherence values.18 Under the homogeneity hypothesis, the coherence accuracy and bias depend on the extent of the averaging or estimation process in such a way that the larger the number of averaged pixels, the higher the coherence accuracy and the lower the bias. Therefore since coherence accuracy is achieved at the expense of spatial resolution and spatial details, this point represents a clear trade-off for coherence estimation. Coherence estimation techniques also rely on the hypothesis that all the signals involved in the estimation process are stationary and, in particular, are locally stationary processes. When this is not the case, biased coherence values result.18 Hence a lack of signal stationarity can be considered as a second source of bias for coherence estimation. The departure of the stationarity condition may be induced by systematic phase variations mainly due to the terrain topography, but also to atmospheric effects or to deformation gradients. As demonstrated in Ref. 19, the most reliable technique to eliminate this bias is to compensate for the topography by means of external DEMs. Nevertheless, the DEM may not be available for the scene under study, or its quality may be rather low for coherence estimation purposes. Alternative coherence estimation techniques exist that aim to solve these problems with different levels of success.18 –21 Our objective is to employ some recent advances in speckle noise theory to improve coherence estimation, with special emphasis on InSAR applications. In Refs. 22 and 23, the authors derived a novel speckle noise model for characterization of the complex Hermitian product of two SAR images. On the basis of this noise model, coherence estimation by means of multilook techniques is considered analytically. Here we establish which conditions are necessary to obtain an unbiased coherence estimation. In Section 3 we present two alternatives to estimate interferometric coherence, which are analyzed in Section 4. Conclusions are presented in Section 5. 2. Synthetic Aperture Radar Coherence Model
An InSAR system acquires two SAR images from slightly different positions in space, denoted in the following as S1 and S2, respectively. These images can be jointly acquired (single-pass InSAR), or they may be obtained at different times (repeat-pass InSAR). Before generating the complex interferogram, it is necessary to coregister both SAR images and to range filter the noncommon parts of the spectra of S1 and S2 to increase coherence.24 Coherence is then defined as
ⱍE兵S S 其ⱍ * 2
ⱍⱍ ⫽ ⱍe ⱍ ⫽ 冑E兵 S1 2其E兵 S2 2其 , ⱍ ⱍ ⱍ ⱍ jx
1
(1)
where E兵x其 is the expectation value, |z| represents the absolute value of z, and the processes S1, S2, and S1S2* are assumed stationary and jointly stationary.18 To obtain coherence it is necessary to estimate the values of the different expectation values involved in Eq. (1) by means of the ensemble average. Nevertheless, since there are not multiple realizations of the SAR images S1 and S2, it is also required that S1, S2, and S1S2* be ergodic in mean to substitute the ensemble averages in the realizations space by the space averages in the image space. Hence it is possible to estimate coherence by means of
ⱍMLTⱍ ⫽
ⱍ兺
N S1共m, n兲S2* 共m, n兲ⱍ 兺n⫽1 M N M N 冑兺m⫽1 兺n⫽1 兺n⫽1 ⱍS1共m, n兲ⱍ2 兺m⫽1 ⱍS2共m, M m⫽1
, n兲ⱍ2 (2)
where m and n refer to the image dimensions and M and N are the number of averaged pixels in each dimension. |MLT| receives the name of the multilook coherence estimator and it corresponds to the maximum likelihood estimator of ||.25 Under the assumption that the SAR images S1 and S2 may be described by circular complex Gaussian probability density functions (pdfs), the statistics of |MLT| have been completely characterized.18,26 The main drawback of |MLT| is that it overestimates coherence, especially for low coherence values and for small values of MN, that is, small averaging windows. A second problem that may appear for large windows is that the processes S1, S2, and S1S2* can be nonstationary within the analysis window, resulting in meaningless estimated coherence values. A meaningful coherence estimation is restricted to those cases in which S1, S2, and S1S2* are stationary processes within the analysis window. Nevertheless, this hypothesis cannot be fulfilled if the SAR images S1 and S2 present a systematic phase variation. InSAR data represent the best example of this problem, since the SAR images differ by the topographic induced phase x. When the topographic phase component x is no longer constant within the averaging window, |MLT| results in biased coherence values. Other sources of signal nonhomogeneities can be atmospheric effects or terrain deformations. The topographic induced phase x can be derived by means of external DEMs making possible its compensation in Eq. (2):
ⱍ
PHCDEM
⫽
ⱍ
ⱍ兺
M m⫽1
N S1共m, 兺n⫽1
M N 冑兺m⫽1 兺n⫽1 ⱍS1共m,
n兲ⱍ
2
n兲S2* 共m, n兲e⫺jx
兺
M m⫽1
ⱍ
兺 ⱍS2共m, N n⫽1
. n兲ⱍ2 (3)
The main drawback of Eq. (3) is that the quality of the external DEM can be rather low, or there may be no DEM at all, making the phase compensation process 1 February 2007 兾 Vol. 46, No. 4 兾 APPLIED OPTICS
545
not possible. When such maps do not exist, there is still an alternative to estimate coherence without the topographic induced bias. In Ref. 27, the authors proposed to model topography by means of a plane and then to maximize coherence with respect to this plane. This methodology was improved in Ref. 19 by considering more complex phase models
ⱍ
ⱍ
PHCmodel
max ⫽
x
M N S1共m, 兺n⫽1 ⱍ兺m⫽1
M N 冑兺m⫽1 兺n⫽1 ⱍS1共m,
n兲S2* 共m, n兲e⫺jf共x兲
ⱍ
, M N n兲ⱍ2 兺m⫽1 兺n⫽1 ⱍS2共m, n兲ⱍ2 (4)
where the function f共x兲 represents the local phase model, depending on the parameter vector x. Nevertheless, in Ref. 19 it was agreed that the estimator coherence estimator [Eq. (4)] presents the handicap that f共x兲 may not model topography correctly, resulting in coherence biases, and concluding that the best coherence estimator is the one in which phase is compensated by means of external data [Eq. (3)]. An alternative to avoid topographic induced biases is to derive topography independent coherence estimators. In Ref. 20, an intensity based coherence estimator was proposed based on
RINT ⫽
M N 兺m⫽1 兺n⫽1 ⱍS1共m, n兲ⱍ2ⱍS2共m, n兲ⱍ2 M N M N 冑兺m⫽1 兺n⫽1 兺n⫽1 ⱍS1共m, n兲ⱍ4 兺m⫽1 ⱍS2共m,
, n兲ⱍ4 (5)
plex SAR images. The speckle noise model is presented in the following, whereas details about its analysis can be found in Refs. 22 and 23. The complex Hermitian product of SAR images S1 and S2 can be written as follows:
ⱍ
ⱍINTⱍ ⫽
再
0
RINT ⱕ 1兾2
具S1S2* 典n ⫽ nm exp共 jx兲
Ç ⫹ 共ⱍⱍ ⫺ Nc zn兲exp共 jx兲 ⫹ 共nar ⫹ jnai兲, Ç Multiplicative term
Additive term
(8) where the symbol 具 典n stands for the n sample average or multilook. The following list details the different parameters of Eq. (8). Y denotes the average power in the two channels, ⫽ 冑E兵ⱍSiⱍ2其E兵ⱍSjⱍ2其.
APPLIED OPTICS 兾 Vol. 46, No. 4 兾 1 February 2007
冊
As has been demonstrated in Ref. 28, parameter Nc contains the same information as the coherence. Y Considering Eq. (7), zn represents the normalized Hermitian product amplitude, that is, zn ⫽ E兵z其兾. Y The first speckle noise component is given by nm, which is characterized by the following moments: E兵nm其 ⫽ Nc zn,
Complex Hermitian Product Speckle Noise Model
As observed in Eqs. (1) and (2), the coherence parameter is basically determined by the complex Hermitian product of SAR images S1 and S2. Consequently, analysis of the coherence value needs to be performed on the basis of a first study of this complex Hermitian product. In the frame of PolSAR data,22,23 and under the hypothesis that SAR images may be characterized by correlated circular, complex, Gaussian pdfs, we have introduced and validated a multilook data model to describe the effects of speckle noise in the complex Hermitian product of two com546
冉
⌫共n⫹1⁄2兲⌫共3⁄2兲 3 1 ⱍⱍ2 F1 2 ⫺ n, 2 ; 2; ⱍⱍ2 . (10) ⌫共n兲
(6)
As observed in Eq. (5), the estimator |INT| is based on the SAR images high-order moments. The main disadvantage of Eq. (6) is that it presents a reduced statistical confidence compared with estimators based on the complex SAR images directly. In Ref. 19, it was also concluded that coherence estimators based on high-order moments are characterized by a low statistical confidence. A.
(9)
Y x corresponds to the average phase of . Y Nc takes the expression Nc ⫽
.
(7)
where 1 and 2 represent the phase of S1 and S2, respectively, z denotes the Hermitian product amplitude, and is the phase difference. Under the hypothesis that the SAR images are statistically described by zero-mean complex Gaussian pdfs, the multilook expression of Eq. (7) may be modeled as follows:
where coherence is obtained as
冑2RINT ⫺ 1 RINT ⬎ 1兾2
ⱍ
S1S2* ⫽ S1S2* e j共1⫺2兲 ⫽ ze j,
n2 m ⫽ Nc2
(11)
共1 ⫹ ⱍⱍ2兲 2n
.
(12)
This noise component presents a multiplicative nature that is dominant for high coherence data. Consequently, this term is referred to as the multiplicative term of the model presented by Eq. (8). If the Hermitian product is constructed with the same image, i.e., SS*, this component reduces to the classical multiplicative noise model for the SAR image intensity.
Y The second speckle noise component corresponds to the complex additive noise nar ⫹ jnai, which is characterized by the moments E兵nar其 ⫽ E兵nai其 ⫽ 0, n2 ar ⫽ n2 ai ⫽
1 1 ⫺ ⱍⱍ2兲1.32冑n. 2n 共
(13)
(14)
In contrast with the multiplicative term indicated in the previous point of this list, the additive term of the model presented by Eq. (8) makes reference to that part of Eq. (8) not affected by the speckle noise component nm. For further analysis, it must be taken into account that the components nm and nar ⫹ jnai are not completely uncorrelated.22 Nevertheless, this correlation can be neglected due to its small value. We direct readers interested in the details of Eq. (8), as well as in the different consequences this model has in the estimation of information, to Refs. 22 and 23. In short, one can affirm that in the case of low coherences, the stochastic behavior of the Hermitian product [Eq. (8)] is determined by the complex additive speckle noise component. On the contrary, speckle in high coherence areas is determined by the multiplicative noise component nm. In this situation, it must also be considered that the multiplicative speckle component is multiplied by the complex phase term exp共 jx兲. This modulation implies that the final speckle noise nature, in case of high coherences, will also depend on the phase information, in such a way that in some cases, high coherence areas may present a strong additive speckle noise behavior. B.
Introduction of Systematic Phase Variations
Equation (8) has been derived on the basis that the true phase component x is constant. Consequently, the model is not sensitive to systematic phase variations, as for instance the topographic phase component present in InSAR data. This section is devoted to analyzing and including these effects in the speckle noise model [Eq. (8)]. As mentioned in Section 1, a systematic phase variation can be due to different natural processes. Nevertheless, if data are considered locally, these variations may be modeled accurately by a linear phase term. For 2D data, systematic phase variations are modeled in what follows as a separable model in which phase is linear in each dimension: 2 2 x共m, n兲 ⫽ m⫹ n ⫹ x0, sx sy
(15)
where sx and sy represent the spatial phase periods in each orthogonal dimension and x0 is a constant phase term. Consequently, the orthogonal space frequencies are defined as
x ⫽
2 , sx
(16)
y ⫽
2 . sy
(17)
For single-look data, the only task to perform is to substitute the constant phase term of Eq. (8), particularized to the single-look case, by the model presented in Eq. (15). However, the key study here is to determine the effects of the linear phase components when data are filtered, that is, when the Hermitian product of SAR images, modeled as in Eq. (8), is filtered by Eq. (2). A multilook filter, as employed in Eq. (2), presents the following impulse response: h共m, n兲 ⫽
1 MN
M
N
兺 兺 ␦共p ⫺ m兲␦共q ⫺ n兲, p⫽1 q⫽1
(18)
with a Fourier transform equal to
H共x, y兲 ⫽
1 M
冉 冊 冉 冊
冉 冊 冉 冊
M N x sin 2 1 2 y , x N y sin sin 2 2
sin
(19)
where ␦共k兲 is the Kronecker ␦ function and x and y indicate the spatial frequencies. To determine the effects of the multilook filter, it is necessary to calculate the convolution of the single-look speckle noise model [Eq. (8)], with the impulse response [Eq. (18)]. Since Eq. (8) contains random signal terms, this analysis must be performed in the frequency domain, considering the product of the spectral density function of Eq. (8) with Eq. (19). Consequently, it is first necessary to derive the spectral density function of Eq. (8), where the correlation between the first and the second additive terms is neglected, due to its small value, to simplify the analysis. As a result, the analysis expressed above may be done separately for every additive term of Eq. (8). Additionally, and without loss of generality, the constant phase term x0 can be considered equal to zero. The autocorrelation function of the first additive term of Eq. (8), u1共x, y兲 ⫽ nm exp共 jx共x, y兲兲,
(20)
under the hypothesis of spatially uncorrelated speckle is equal to
冋
ru1u1共k, l兲 ⫽ 2N c2 zn2 ⫹
共1 ⫹ ⱍⱍ2兲 2n
␦共k, l兲
册
⫻e j关共2兾sx兲k⫹共2兾sy兲l兴,
(21)
giving as a result the following spectral density function: 1 February 2007 兾 Vol. 46, No. 4 兾 APPLIED OPTICS
547
Su1u1共x, y兲 ⫽ 2N c2
共1 ⫹ ⱍⱍ2兲
⫹ 2N c2zn2 共2兲2
2n 2 2 ⫻ ␦ x ⫺ ␦ y ⫺ . sx sy
冉
冊冉
冊
(22)
The details of the process resulting in Eqs. (21) and (22) are given in Appendix A. The spectral density function of the filtered Hermitian product first term, v1共x, y兲, is obtained by multiplying Eq. (22) by the square of the amplitude of Eq. (19): Sv1v1共x, y兲 ⫽ 2N c2
共1 ⫹ ⱍⱍ2兲
2n 2 M N sin sin x y 1 2 1 2 ⫻ M x N y sin sin 2 2 2 2 ⫹ 2N c2zn2 共2兲2⌬2␦ x ⫺ ␦ y ⫺ , sx sy (23)
冉 冊 冉 冊
冨
冉 冊 冉 冊 冉 冊冉
冨
冊
where
冨
1 ⌬⫽ M
冉 冊 冉冊
冉 冊 冉冊
M N sin sx 1 sy N sin sin sx sy
sin
冨
.
(24)
where 共⫺K, K兲 denotes the triangle function bek tween ⫺K and K. If Eq. (25) is compared with Eq. (21), it can be observed that both equations are conceptually the same except for the spatial correlation introduced by the multilook processing, given by the triangle function, and the presence of the coefficient ⌬. Consequently, the first term of the filtered Hermitian product can be considered as v1共x, y兲 ⫽ ⌬ exp共 jx共x, y兲兲n⬘m共x, y兲,
(26)
where the multiplicative speckle term n⬘m presents the statistical moments
548
共1 ⫹ ⱍⱍ2兲 2nMN
(27) .
(28)
APPLIED OPTICS 兾 Vol. 46, No. 4 兾 1 February 2007
(29)
filtered by Eq. (18) results in v2共x, y兲 ⫽ ⌬共ⱍⱍ ⫺ Nc zn兲exp关 jx共x, y兲兴.
(30)
The last step in this analysis corresponds to the study of the multilook filtering of the third additive term of Eq. (8): u3共x, y兲 ⫽ 共nar共x, y兲 ⫹ jnai共x, y兲兲.
(31)
In this case, only the analysis of the real part of Eq. (31) will be considered, since the imaginary part behaves in the same way. Again, under the hypothesis that speckle noise is spatially uncorrelated, the real part of Eq. (31) presents the autocorrelation function 1 1 ⫺ ⱍⱍ2兲1.32冑n␦共k, l兲, (32) 2n 共
which spectral density function is 1 1 ⫺ ⱍⱍ2兲1.32冑n. Sᑬ兵u3其ᑬ兵u3其共x, y兲 ⫽ 2n 共
rv1v1共k, l兲 ⫽ 2N c2zn2 ⌬2e j关共2兾sx兲k⫹共2兾sy兲l兴 共1 ⫹ ⱍⱍ2兲 1 ⫹ 2N c2 ⫺ M ⫺ 1 兲, 2n M k共 共 1 共M ⫺ 1兲兲 N 共⫺共N ⫺ 1兲, 共N ⫺ 1兲兲, (25) l
2 n⬘ ⫽ N c2 m
u2共x, y兲 ⫽ 共ⱍⱍ ⫺ Nc zn兲exp关 jx共x, y兲兴,
rᑬ兵u3其ᑬ兵u3其共k, l兲 ⫽
The inverse Fourier transform of Eq. (23) gives as a result the autocorrelation function
E兵n⬘m其 ⫽ Nc zn,
Analysis of the second additive term of Eq. (8), u2共x, y兲, is straightforward as it corresponds to the convolution of a constant value with the impulse response [Eq. (18)]. Hence the signal
(33)
Employing the same procedure as was done for the first additive term of Eq. (8), the spectral density function of the filtered third additive term is Sᑬ兵v3其ᑬ兵v3其共x, y兲 ⫽
1 1 ⫺ ⱍⱍ2兲1.32冑nNM 2nMN 共 M N sin sin 2 x 1 2 y 1 ⫻ M N x y sin sin 2 2
冨
冉 冊 冉冊
冉 冊 冉冊
冨
2
,
(34)
resulting in a filtered term presenting the autocorrelation function 1 1 rᑬ兵v3其ᑬ兵v3其共k, l兲 ⫽ 1 ⫺ ⱍⱍ2兲1.32冑nNM 关⫺共M ⫺ 1兲, 共 2nNM M k
1 共M ⫺ 1兲兴 N 关⫺共N ⫺ 1兲, 共N ⫺ 1兲兴. l (35)
The autocorrelation function for the imaginary part of signal u3共x, y兲 presents the same expression as Eq. (35). Hence the filtered signal v3共x, y兲 can be supposed to be
v3共x, y兲 ⫽ 关n⬘ar共x, y兲 ⫹ jn⬘ai共x, y兲兴,
(36)
where the additive noise components are characterized by E兵n⬘ar其 ⫽ E兵n⬘ai其 ⫽ 0, 2 2 n⬘ ⫽ n⬘ ⫽ ar ai
1 1 ⫺ ⱍⱍ2兲1.32冑nMN. 2nMN 共
(37) (38)
Considering the previous results, one can write the filtered Hermitian product of two SAR images as 具S1S2* 典nMN ⫽ ⌬n⬘m exp共 jx兲 ⫹ ⌬共ⱍⱍ ⫺ Nc zn兲exp共 jx兲 ⫹ 共n⬘ar ⫹ jn⬘ai兲. (39)
The multiplicative speckle component n⬘m is now characterized by Eqs. (27) and (28) and it presents a spatial correlation proportional to the dimensions of the multilooking. In the same way, the real and imaginary parts of the speckle complex additive component are characterized by Eqs. (37) and (38), and they also present the same spatial correlation due to the multilook filter. It is important to consider, at this point, the consequences of parameter ⌬, which expression is given in Eq. (24). The expected value of Eq. (39) is E兵具S1S2* 典nMN其 ⫽ ⌬E兵n⬘m其exp共 jx兲 ⫹ ⌬共ⱍⱍ ⫺ Nc zn兲 ⫻ exp共 jx兲 ⫽ ⌬Nc zn exp共 jx兲 ⫹ ⌬共ⱍⱍ ⫺ Nc zn兲 ⫻ exp共 jx兲 ⫽ ⌬ⱍⱍexp共 jx兲. (40) As ⌬ ⱕ 1, this parameter introduces a bias in the amplitude of the filtered Hermitian product, in such a way that the amplitude is underestimated with respect to its actual value. The physical origin of this bias can be explained as follows. Since the frequency response of the multilook filter [Eq. (19)] is not equal to one in all its bandwidth, the modulation introduced by the phase term exp共 jx兲 produces the Hermitian product amplitude to be multiplied by ⌬, which introduces the bias. Two possible forms exist to eliminate this bias due to systematic phase variations. The first method is based on the use of an estimation of the complex phase term exp共 jx兲, which can be derived from the own Hermitian product or by means of external methods. This estimation can be employed, on the one hand, to compensate for x or, on the other hand, it can be considered in Eq. (24) to eliminate the bias. As can be deduced from Eqs. (19) and (24) bias ⌬ is filter dependent. Consequently, the second method to eliminate bias ⌬ could be to find a filter presenting a flat frequency response of value one in the bandwidth of interest. Since it is of importance to have this behavior for any value of x, the only possibility to achieve this property is by means of filter bank techniques. The validity of this filtering option has been already demonstrated in Ref. 28, where a wavelet
filter bank has been considered. The final conclusion that is possible to extract here is that it is possible to estimate the Hermitian product amplitude and the coherence value independently of systematic phase variation. This is of importance since it implies that it may be possible to estimate the information of interest, in case of InSAR data, independently of topography. C.
Coherence Signal Model
As defined in Eqs. (1) and (2), an exact model for the coherence parameter needs to consider both the numerator and the denominator jointly. To overcome the complexity derived from considering the correlation between both components, in what follows they will be modeled separately to derive a coherence signal model. The analysis of the numerator is straightforward from the previous results. Hence 具S1S2* 典MN ⫽ ⌬n⬘m exp共 jx兲 ⫹ ⌬共ⱍⱍ ⫺ Nc zn兲exp共 jx兲 ⫹ 共n⬘ar ⫹ jn⬘ai兲. (41) In Eq. (41), original data are assumed to be singlelook, i.e., n ⫽ 1. The modelization of the denominator is performed under a criterion of simplicity. This condition is necessary as it permits us to derive an invertible coherence signal noise model allowing the retrieval of its actual value. Due to the finite averaging of the multilook process, the denominator will present a certain degree of variance. This component could be modeled through an additional noise component, but to do it would force the necessity to consider its correlation with the noise components of Eq. (41). Hence only the mean value of the argument of the square root is considered. This value equals
冉
E兵具|S1|2典MN具|S2|2典MN其 ⫽ 1 ⫹
ⱍⱍ2
MN
冊
.
(42)
The denominator of Eq. (2) is then considered as
冑冉
冑具|S1|2典MN具|S2|2典MN ⯝
1⫹
冊
1 , MN
(43)
where the dependence on the coherence is neglected as it has a small influence, even when MN is small. Introducing Eq. (41) and expression (43) into Eq. (2) results in MLT ⫽
⌬n⬘m exp共 jx兲 ⫹ ⌬共ⱍⱍ ⫺ Nc zn兲exp共 jx兲 ⫹ 共n⬘ar ⫹ jn⬘ai兲
冑冉
1⫹
1 MN
冊
.
(44)
Equation (44) has been obtained by considering the hypothesis MN ⬎ 1 [expression (43)]. If one keeps this hypothesis, Eq. (44) can be simplified as follows: 1 February 2007 兾 Vol. 46, No. 4 兾 APPLIED OPTICS
549
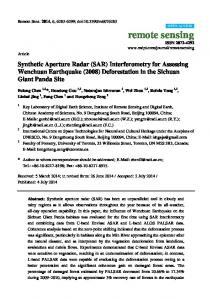
Fig. 1. True and estimated speckle biases of coherence.
冉
MLT ⯝ ⱍⱍ⌬ exp共 jx兲 ⫹ 1 ⫹
1 MN
冊
1兾2
共n⬘ar⫹jn⬘ai兲, (45)
where details can be found in Appendix B. Expression (45) represents the signal model for the complex correlation coefficient characterizing a pair of complex SAR images. This model has been derived under the premise that a multilook process has been employed to filter the signal. Nevertheless, the previous model can be generalized to consider any type of filter just taking into account that parameter ⌬ will depend on the particular filter and the number of looks MN must be substituted by the effective number of looks of the resulting data. Expression (45) is now analyzed to derive an expression for the coherence characterizing a pair of complex SAR images. To take just the amplitude of expression (45) is not possible as it would make it necessary to consider the amplitude of the complex additive speckle noise component. However, this paper is simply considering the intensity of expression (45). Then, the expected value of the intensity of expression (45) is
冉
1 E兵ⱍMLTⱍ2其 ⯝ ⱍⱍ2⌬2 ⫹ 1 ⫹ MN
冊
3. Coherence Estimation ⫺1
1 1 ⫺ ⱍⱍ2兲1.32冑MN. MN 共 (46)
Expression (46) is able to identify the different sources of bias when coherence is estimated. The first source of bias, introduced by parameter ⌬, has its origin on the terrain topography and its interaction with the filtering method employed to estimate coherence. As deduced in Eq. (24), parameter ⌬, in the case of the multilook filter, always presents a value less than or equal to 1. This implies that this bias, in the case of multilooking, induces an underestimation of the coherence. Nevertheless, this fact does not prevent us from inducing an overestimation in the case of different filtering approaches. As deduced, this 550
source of bias does not depend on the coherence value itself. This is not the case for the second source of bias, which is due to the additive speckle noise component nar ⫹ jnai. As one can observe in expression (46), this source of bias is important for low coherences, even though its effect decreases with the number of looks. The effect of the additive speckle noise component is to introduce an overestimation of the coherence values. Figure 1 shows the effect of this second source of bias and compares it with the exact coherence bias.18,26 As observed, the bias predicted by the coherence model is close to this actual value. One must take into account that the differences may be explained by the fact that several approximations have been necessary to derive a simple coherence model. In the case of high coherences, the proposed model underestimates the coherence bias helping to maintain these values unaltered. On the contrary, the coherence bias is slightly overestimated for low coherences. As a concluding remark of this subsection, it is worth mentioning that the coherence model presented in expression (45) is able to identify and quantify the different sources of bias found in the related literature.18
APPLIED OPTICS 兾 Vol. 46, No. 4 兾 1 February 2007
The availability of the expressions given by expressions (45) and (46) makes it possible to define an algorithm for coherence estimation in multidimensional SAR imagery. Consequently, it is necessary to compensate for two bias sources. The first source is the overestimation for low coherence values. From expression (46), this bias presents the expression
冉
2 ⫽ 1⫹ ⌬speckle
1 MN
冊
⫺1
1 1 ⫺ ⱍⱍ2兲1.32冑MN, MN 共
(47)
which, as has been demonstrated, is due to the additive speckle noise component nar ⫹ jnai. As has been presented in Section 2, Eq. (47) slightly overestimates the speckle bias for low coherences. This effect could be reduced by considering a weighting of Eq.
(47) into expression (46). However no weighting has been considered in what follows to assess the properties of expression (46). The second source of bias is the underestimation for the whole coherence range due to the topographic bias ⌬. Before we can detail such an algorithm, it is necessary to comment on a few aspects about expressions (45) and (46). As observed, the algorithm needs to operate with ||2 instead of || to take advantage of Eq. (47), as the additive speckle noise source presents an expected value equal to zero [Eq. (37)]. In addition, and due to the data stochastic nature, the process leading to an estimated value of coherence, which implies the use of the square root function, needs to control that the estimated value of the square of coherence is within the dynamic range 关0, 1兴. Finally, the bias [Eq. (47)] depends on a previous estimation of the coherence value. Since this first coherence is biased, the bias derived from it will be underestimated. This fact suggests, in a very direct way, that the algorithm to be proposed must present an iterative nature. For simplicity reasons, two coherence estimation algorithms are considered. The first one considers only the bias due to speckle, whereas the second one considers the combined reduction of the two bias sources. A.
Algorithm for Speckle Bias Reduction
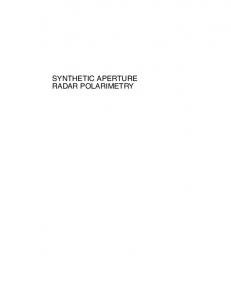
The scheme of the algorithm focused on the reduction of the speckle bias of coherence is depicted in Fig. 2. In this case, the input coherence corresponds to the value derived by means of the multilook approach [Eq. (2)], but squared. From this value, it is straightforward to estimate the bias [Eq. (47)] considering the dimensions of the multilook filter that is M and N. To reduce the variance of the estimated nonbiased coherence, it is helpful to filter the estimated bias. There is not a special reason to consider a particular filter to perform this task, although the use of the same multilook filter employed to estimate the initial coherence produces good results, as will be observed in Section 4. The estimated coherence is derived by subtracting this bias from the squared coherence. This estimated value is controlled in such a way that its value is within the range 关0, 1兴. There are different ways to deal with values outside this range. In what follows, values outside this range are made equal to the extremes accordingly. The estimated coherence is finally derived through the square root function. This process is iterated, as given in Fig. 2, to improve the estimation of the bias component. Although this algorithm has been considered under the hypothesis
Fig. 2. Algorithm for speckle bias reduction in coherence estimation.
that coherence was obtained with a multilook approach, other estimation approaches are possible. The only difference is that when Eq. (47) is used, the product MN should be substituted by the equivalent number of looks. B. Algorithm for a Combined Speckle and Topographic Biases Reduction
The second of the algorithms presented in this section considers the combined reduction of biases due to speckle and due to systematic phase variations. This new algorithm consists of a variation of the previous one in order to consider the systematic phase variation bias component. As shown in Section 2, since this bias component does not depend on coherence, it must not be reduced in the iterative loop of Fig. 2. Therefore, this new algorithm consists of substituting the dashed square in Fig. 2 by the processing steps in Fig. 3. The first step to take into account is to estimate the systematic phase variations on the data, that is, the topographic phase component in the case of InSAR data. This estimation process can be performed by any of the alternatives proposed in the literature. In what follows, the particular approach proposed by Trouvé et al.,29 based on the multiple signal classification algorithm, is considered due to its good performance. The retrieved information about systematic phase variations is next employed to calculate the bias component given by Eq. (24). At this point it would be possible to use expression (46) to invert the effects of topography and speckle jointly, but this process may be complex due to the complex nature of the equation itself. Hence the following simplification is considered:
ⱍMLTⱍ2 ⯝ ⱍNBSⱍ2⌬
2
⫹
1 1 ⫺ ⱍNBSⱍ2兲. MN 共
(48)
The previous simplifications allow a simple process to eliminate both bias sources jointly as follows:
冉
1
ⱍNBSⱍ2 ⯝ ⱍMLTⱍ2 ⫺ MN
冊冉
MN MN⌬2 ⫺ 1
冊
.
(49)
The retrieved coherence value is checked to ensure that it is within the range 关0, 1兴. After this combined reduction, the speckle bias is reduced iteratively as depicted in Fig. 2.
Fig. 3. Variation for the reduction of biases due to systematic phase variations. 1 February 2007 兾 Vol. 46, No. 4 兾 APPLIED OPTICS
551
4. Results
This section contains, first, a validation process of the theory and algorithms presented previously. This process is based on simulated data, granting access to the theoretical coherence, and phase values employed to simulate data. In a second process, the algorithms are applied to experimental interferometric and polarimetric SAR data. A.
Simulated Synthetic Aperture Radar Data Results
On the basis of the technique presented in Ref. 30, 512 ⫻ 512 pixel correlated SAR images have been simulated for the whole coherence range. Initial coherences have been estimated by using a multilook approach [Eq. (2)], considering square windows of side: 3, 5, 7, and 9 pixels. Figure 4 details the estimated coherence values retrieved by the first algorithm, referred to as |NBS|, of Section 3, as well as the mean square error (MSE). Values corresponding to the multilook estimation process are included for comparison, referred to as biased |MLT|. As observed, the proposed algorithm is able to reduce the bias due to speckle for low coherence values in all the cases. It is clear that, despite the proposed algorithm being able to reduce the bias, it is not able to cancel it
completely. A complete cancellation of this bias component would mean that the input data must present a standard deviation equal to zero. This is only possible if the initial coherence is estimated by considering a multilook process with an infinite number of samples. From a practical point of view, this would translate into using large averaging windows, which are not possible as the homogeneity condition necessary to estimate coherence would not be fulfilled. In the case of real SAR data, neither the terrain topography nor the surface properties can be considered as homogeneous in large areas. Figure 4 also contains the MSE of both estimators obtained as MSE共ⱍˆ ⱍ兲 ⫽ E兵共ⱍˆ ⱍ ⫺ ⱍⱍ兲2其 ⫽ var兵ⱍˆ ⱍ其 ⫹ b2兵ⱍˆ ⱍ其, (50) where |ˆ | and || indicate the estimated and true coherence values, respectively, and b兵x其 represents the estimation bias. The MSE is better adapted than the standard deviation measure to study the performance of biased estimators as it also takes into consideration this biased nature.31 As expected, no differences in the MSE are observed for high coherences as the estimators are nonbiased. However, dif-
Fig. 4. (Left) Mean and (right) MSE values of the estimated coherence values with the multilook algorithm 共ⱍMLTⱍ兲 and the algorithm for the speckle bias reduction 共ⱍNBSⱍ兲. 552
APPLIED OPTICS 兾 Vol. 46, No. 4 兾 1 February 2007
Fig. 5. (Left) Mean and (right) MSE values of the estimated coherence values with the multilook algorithm 共ⱍMLTⱍ兲 and the algorithm for the speckle bias reduction 共ⱍNBSⱍ兲.
ferences in the MSE are noticed for medium and low coherences. In the latter case, the bias reduction results in a clear decrease of the MSE. If one considers Fig. 4, it can be observed that for all window sizes, the bias is basically reduced by a factor equal to 2. This can be interpreted in the following way. For a given level of bias, it is possible to use the nonbiased coherence estimation algorithm with a multilook in which the dimensions of the window may be reduced by a factor of 2. This property is important as it allows a better preservation of the image resolution and details. Of course, it must also be mentioned that the retrieved coherence values would present the standard deviation values corre-
sponding to the window with reduced dimensions. Hence the coherence estimation process presents a clear trade-off between bias reduction and standard deviation. In the previous tests, data were simulated considering a homogeneous phase component in the whole image. In what follows, a nonhomogeneous phase component will be introduced into the data to demonstrate the capabilities of the algorithm designed for a combined speckle and topographic biases reduction. The true topography corresponds to a phase ramp that, when wrapped, results in 15 pixel fringes. In all the cases and for the complete coherence range, topography is estimated from data. Figure 5 details
Fig. 6. Mean and standard deviation values of the estimated coherence values with the multilook algorithm 共ⱍMLTⱍ兲 and the algorithm for the speckle bias reduction 共ⱍNBSⱍ兲 with a 7 ⫻ 7 looks window. Topography is not estimated from data, but offered as an input to the algorithm. 1 February 2007 兾 Vol. 46, No. 4 兾 APPLIED OPTICS
553
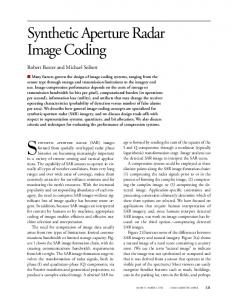
Fig. 7. Histograms of coherence for the Traunstein image.
the retrieved coherence values. When employing a 3 ⫻ 3 pixel window to estimate coherence, it can be observed as the algorithm is able to reduce the bias due to topography while it also reduces the speckle bias for low coherences. As the window size increases, the algorithm is still able to eliminate completely the bias due to topography. It is worth noticing that even when employing a 9 ⫻ 9 pixel window, where the topographic phase presents an excursion of 6兾5 rad within the window, the algorithm is able to retrieve the correct coherence. Nevertheless, one can also observe that for very low coherences, coherence is underestimated. This underestimation is due to the impossibility of having a reliable estimated topography for such low coherences. This limitation is not due to the coherence estimation algorithms presented in Section 3, but to the algorithm in charge of the
topographic phase estimation process. To demonstrate this, a variation of the algorithm, in which the true topographic phase is not estimated from the data, but introduced in the algorithm as an input, is considered. Figure 6 presents the results when a 7 ⫻ 7 pixel window is considered. As observed, the proposed algorithm is able to eliminate completely the bias due to topography and to reduce the bias due to speckle. B.
Experimental Synthetic Aperture Radar Data Results
The algorithms presented previously to remove the different sources of biases when coherence is estimated have also been tested on real SAR data sets. The algorithm reducing the bias due to speckle for low coherences has been tested on an experimental small baseline, 1024 ⫻ 2048 pixel, L-band PolSAR
Fig. 8. Original and nonbiased estimated coherences based on 3 ⫻ 3 pixel windows. 554
APPLIED OPTICS 兾 Vol. 46, No. 4 兾 1 February 2007
Table 1. Mean Coherence Values for the Areas of Fig. 8
|MLT| |NBS|
High (H)
Medium (M)
Low (L)
0.8084 0.8014
0.6708 0.6412
0.4631 0.3712
data set. These data have been acquired by the Experimental Synthetic Aperture Radar sensor, operated by the Deutsches Zentrum für Luft- und Raumfahrt, over the Traunstein area located in southern Germany. Within these data, agricultural, forested, and urban zones can be identified. To test * the algorithm, only the Hermitian product ShhSvv has been considered. In the previous product, Shh stands for the scattering coefficient relating the electromagnetic fields transmitted and received in horizontal polarization, whereas Svv indicates the same quantity but for electromagnetic fields transmitted and received with vertical polarization. Figure 7 presents the histograms of the coherence values obtained with the multilook approach [Eq. (2)], and the histograms of the coherence values obtained with the proposed algorithm, for different sizes of the analysis window. In all the cases, it may be observed that the histo-
grams are equal for high coherence values, proving that the proposed algorithm does not alter high coherence values, as designed. Nevertheless, these histograms present clear differences for medium and low coherences, which decrease with the dimensions of the analysis windows as is expected. It is important to note the peak appearing for a coherence equal to zero. This peak appears as a consequence of the control performed on the estimated coherences to avoid negative values. Since the estimated coherence is itself a random variable, it presents a certain degree of variance, which induces an overestimation of the biases for those coherences below the mean coherence value. Since this effect is intrinsic to the estimation process, it can be reduced or eliminated only by increasing the size of the analysis window. Finally, Fig. 8 presents a detailed image of the coherence term * of corresponding to the Hermitian product ShhSvv the original Traunstein data set of 328 ⫻ 164 pixels. In this case, coherence has been estimated with a 3 ⫻ 3 multilook approach [Eq. (2)], and the algorithm proposed to reduce the speckle bias. Table 1 contains the mean coherence values for three different areas detailed in Fig. 8, covering all the coherence dynamic
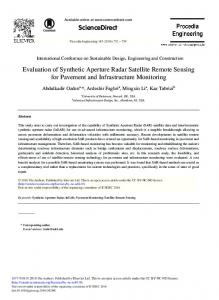
Fig. 9. ERS-1 and ERS-2 tandem interferogram: (a) phase , (b) coherence histograms, (c) |MLT|, (d) |NBS|. Coherences are obtained with 7 ⫻ 7 pixel averaging windows. 1 February 2007 兾 Vol. 46, No. 4 兾 APPLIED OPTICS
555
range. As observed, only medium and low coherences are corrected by the algorithm. This correction, as it may be observed in Fig. 8, is performed without a loss of spatial resolution or spatial details. The second algorithm proposed in Section 3, for a combined reduction of the speckle and the topographic biases in coherence estimation, has been tested on a 1024 ⫻ 1024 pixel tandem interferogram acquired by the ERS-1 and the ERS-2 systems on 30 and 31 July 1999 at the region of Murcia, in eastern Spain. The interferogram presents a spatial baseline of 249 m. As observed in the phase image in Fig. 9, the upper part contains rough topography with low coherence, whereas the rest of the image corresponds to relatively smooth topography. The topography has been estimated by the algorithm detailed in Ref. 29. This estimation of the topographic phase has been employed to correct coherences as detailed in Figs. 2 and 3. In this case, coherence has been estimated considering an averaging window of 7 ⫻ 7 samples. Figure 9 contains the original coherence value |MLT|, the nonbiased estimation |NBS|, and the corresponding histograms. The average value of |MLT| is equal to 0.499, whereas |NBS| presents an average value of 0.555. As shown, the proposed algorithm is able to compensate for the topographic bias. 5. Conclusions
Speckle noise may be considered as one of the most important drawbacks when multidimensional SAR data are considered to study and to analyze the Earth’s surface. In the past, we introduced and validated a novel, to our knowledge, multilook, multidimensional speckle noise model. This model has been able to identify that speckle presents multiplicative and additive noise components when multidimensional SAR data are considered. Here we considered an additional generalization of such a model by introducing the effects due to systematic phase variations. The consequences of these effects depend on the method employed to estimate data, that is, the process to remove speckle noise. The multilook approach has been considered as its simplicity allows the analytical study of the problem. The speckle noise model for multidimensional SAR data has also been employed to perform an in-depth study of the coherence estimation problem, resulting in a novel and simple coherence model. This model is able to identify, in an accurate way, the origin of the different bias sources when coherence estimation is considered. As demonstrated, the coherence bias at low coherence values is due to the complex, additive speckle noise component. The bias itself has its origin on the variance of the real and imaginary parts of this noise component. In addition, as the model takes into account the effects of systematic phase variations, it has allowed a quantitative analysis of this second source of bias in the particular case of the multilook filter. Thus it has been possible to identify that filters presenting a flat frequency response equal to one make it possible to estimate information independently of topography. 556
APPLIED OPTICS 兾 Vol. 46, No. 4 兾 1 February 2007
On the basis of the coherence noise model, two new algorithms for unbiased coherence estimation have been introduced. The first method focuses on the reduction of the low coherences bias. The algorithm has been tested on simulated and real SAR data, proving that it is possible to reduce this bias source without the loss of spatial resolution or spatial details. Nevertheless, this bias source cannot be completely eliminated as it would imply the use of extremely large analysis windows, with the consequent loss of spatial resolution. The second algorithm performs a combined reduction of the speckle and the systematic phase biases without the necessity of external data. The tests over simulated and experimental data have demonstrated the performances of the algorithm, showing also the limitations to estimate very low coherences. This limitation is not due to the proposed algorithm but to the method employed to estimate this systematic phase variation for very low coherence areas. Appendix A: Spectral Density Functions
Given the first additive term of Eq. (8) u1共x, y兲 ⫽ nm exp共 jx兲,
(A1)
and considering the phase model [Eq. (15)], its autocorrelation function is ru1u1共k, l兲 ⫽
⬁
⬁
兺 兺 u1*共m, m⫽⫺⬁ n⫽⫺⬁
冋冉
n兲u1共m ⫹ k, n ⫹ l兲
冊册
⬁ ⬁ 2 2 * k⫹ l 兺 兺 nm 共m, n兲 sx sy m⫽⫺⬁ n⫽⫺⬁ ⫻ nm共m ⫹ k, n ⫹ l兲 2 2 ⫽ 2 exp j k⫹ l rnmnm共k, l兲. (A2) sx sy
⫽ 2 exp j
冋冉
冊册
Under the hypothesis of nonspatially correlated speckle, the autocorrelation of the multiplicative speckle noise term nm is
冋
rnmnm共k, l兲 ⫽ N c2 zn2 ⫹
共1 ⫹ ⱍⱍ2兲 2n
册
␦共k, l兲 ,
(A3)
which can be approximated for single-look data, that is n ⫽ 1, as rnmnm共k, l兲ⱍn⫽1 ⫽ N c2zn2 关1 ⫹ ␦共k, l兲兴.
(A4)
The spectral density function of Eq. (A2) is obtained as Su1u1共x, y兲 ⫽
⬁
⬁
兺 兺 ru u 共k, k⫽⫺⬁ l⫽⫺⬁
l兲exp共⫺jxk兲exp共⫺jyl兲
1 1
⬁
⬁
兺 兺 N c2 k⫽⫺⬁ l⫽⫺⬁
⫽ 2
⫹ 2N c2z2n
冉
⫹ y ⫺
⬁
共1 ⫹ ⱍⱍ2兲 2n
⬁
再 冋冉
兺 兺 exp k⫽⫺⬁ l⫽⫺⬁
冊 册冎
2 l sy
,
␦共k, l兲
⫺j x ⫺
冊
2 k sx (A5)
which reduces to the expression given by Eq. (22).
6.
7. Fig. 10. Value of the term || ⫺ Nczn. 8.
Appendix B: Coherence Model Simplification 9.
Equation (44) can be rewritten as MLT ⫽
⌬n⬘m exp共jx兲
冑冉
⫹
冊
1 MN 共n⬘ar ⫹ jn⬘ai兲 1⫹
冑冉
1 1⫹ MN
⫹
冊
⌬共ⱍⱍ ⫺ Nc zn兲exp共jx兲
冑冉
1⫹
1 MN
冊
.
10.
(B1) 11.
For multilook data it is possible to simplify Eq. (B1) considering MN ⬎ 1. The second additive term of Eq. (B1) can be neglected under this hypothesis as observed in Fig. 10. Considering Eq. (27) and Fig. 10 it is possible to prove ⌬n⬘mexp共 jx兲
冑冉
冊
→ ⌬ⱍⱍexp共 jx兲,
12.
13.
(B2)
14.
where the variance associated with the multiplicative speckle noise term is neglected. Introducing the previous results into Eq. (B1), the simplified model for coherence presented by expression (45) results.
15.
1 1⫹ MN
MN⬎1
The authors thank the Deutsches Zentrum für Luftund Raumfahrt and the European Space Agency for providing the experimental data employed in this study and Pablo Blanco and David Navarrete for their help in processing the InSAR data. This work has been financed by the Spanish Ministry of Education and Science.
16.
17.
18.
19.
References 1. R. Bamler and P. Hartl, “Synthetic aperture radar interferometry,” Inverse Probl. 14, R1–R54 (1998). 2. J. P. Matthews, H. Kamada, S. Okuyama, Y. Yusa, and H. Shimizu, “Surface height adjustments in pyroclastic flow deposits observed at Unzen volcano by JERS-1 SAR interferometry,” J. Volcanol. Geotherm. Res. 125, 247–270 (2003). 3. M. E. Engdahl, J. T. Pulliainen, and M. T. Hallikainen, “Boreal forest coherence-based measures on interferometric pair suitability for operational stem volume retrieval,” IEEE Geosci. Remote Sensing Lett. 1, 228 –231 (2004). 4. J. Hyyppä, H. Hyyppä, M. Inkinena, M. Engdahla, S. Linkob, and Y. H. Zhuc, “Accuracy comparison of various remote sensing data sources in the retrieval of forest stand attributes,” Forest Ecol. Manage. 128, 109 –120 (2000). 5. E. W. Hoen and H. A. Zebker, “Topography-driven variations in backscatter strength and depth observed over the Greenland Ice Sheet with InSAR,” Proceedings of the International
20.
21.
22.
23.
24.
Geoscience and Remote Sensing Symposium IGARSS (2000), Vol. 2, pp. 470 – 472. T. Strozzi, U. Wegmuller, and C. Matzler, “Using repeat-pass SAR interferometry for mapping wet snow covers,” Proceedings of the International Geoscience and Remote Sensing Symposium IGARSS (1998), Vol. 3, pp. 1650 –1652. S. Li, C. Benson, L. Shapiro, and K. Dean, “Aufeis in the Ivishak from Satellite Radar River, Alaska, Interferometry Mapped,” Remote Sens. Environ 20, 131–139 (1997). J. Weydahl, “Analysis of ERS tandem SAR coherence from glaciers, valleys, and fjords ice on Svalbard,” IEEE Trans. Geosci. Remote Sensing 39, 2029 –2039 (2001). F. Mattia, T. Le Toan, J. S. Lee, and D. L. Schuler, “On the sensitivity of polarimetric coherence to small and large scale surface roughness,” Proceedings of the International Geoscience and Remote Sensing Symposium IGARSS (2003), Vol. 2, pp. 690 – 692. D. Kasilingam, D. L. Schuler, J. S. Lee, and S. Malhotra, “Modulation of polarimetric coherence by ocean features,” Proceedings of the International Geoscience and Remote Sensing Symposium IGARSS (2002), Vol. 1, pp. 432– 434. H. Wakabayashi, T. Matsuoka, K. Nakamura, and F. Nishio, “Polarimetric Characteristics of sea ice in the sea of Okhotsk observed by airborne L-band SAR,” IEEE Trans. Geosci. Remote Sensing 42, 2412–2425 (2004). D. H. Hoekman and M. J. Quiñones, “Biophysical forest type characterization in the Colombian Amazon by airborne polarimetric SAR,” IEEE Trans. Geosci. Remote Sensing 40, 1288 – 1300 (2002). S. R. Cloude and K. P. Papathanassiou, “Polarimetric SAR Interferometry,” IEEE Trans. Geosci. Remote Sensing 36, 1551–1565 (1998). J. D. Ballester-Berman, J. M. Lopez-Sanchez, J. FortunyGuasch, “Retrieval of biophysical parameters of agricultural crops using polarimetric SAR interferometry,” IEEE Trans. Geosci. Remote Sensing 43, 683– 694 (2005). A. Reigber and J. Moreira, “Phase unwrapping by fusion of local and global methods,” Proceedings of the International Geoscience and Remote Sensing Symposium IGARSS (1997), Vol. 2, pp. 869 – 871. F. K. Li and R. M. Goldstein, “Studies of multibaseline space borne interferometric synthetic aperture radars,” IEEE Trans. Geosci. Remote Sensing 28, 88 –97 (1990). M. R. Foster and N. J. Guinzy, “The coefficient of coherence: Its estimation and use in geophysical data processing,” Geophysics 32, 602– 616 (1967). R. Touzi, A. Lopes, J. Bruniquel, and P. W. Vachon, “Coherence estimation for SAR imagery,” IEEE Trans. Geosci. Remote Sensing 37, 135–149 (1999). P. B. G. Dammert, “Accuracy of INSAR measurements in forested areas,” Proceedings of the ESA Workshop on Applications of European Space Agency, European Remote Sensing Satellites Interferometry FRINGE (1996), Vol. 1. A. M. Guarnieri and C. Prati, “SAR interferometry: a quick and dirty coherence estimator for data browsing,” IEEE Trans. Geosci. Remote Sensing 35, 660 – 669 (1997). G. Vasile, E. Trouvé, M. Ciuc, and V. Buzuloiu, “General adaptive neighborhood technique for improving SAR interferometric coherence estimation,” J. Opt. Soc. Am. 21, 1455–1464 (2004). C. López-Martínez and X. Fàbregas, “Polarimetric SAR Speckle Noise Model,” IEEE Trans. Geosci. Remote Sensing 41, 2232–2242 (2003). C. López-Martínez and E. Pottier, “Extended multilook multidimensional speckle noise model and its implications on the estimation of physical information,” Proceedings of the International Geoscience and Remote Sensing Symposium IGARSS (2006). F. Gatelli, A. M. Guarnieru, F. Parizzi, C. Prati, and F. Rocca, 1 February 2007 兾 Vol. 46, No. 4 兾 APPLIED OPTICS
557
“The wave number shift in SAR interferometry,” IEEE Trans. Geosci. Remote Sensing 32, 855– 865 (1994). 25. M. Seymour and I. Cumming, “Maximum likelihood estimation for SAR interferometry,” Proceedings of the International Geoscience and Remote Sensing Symposium IGARSS (1994), Vol. 4, pp. 2272–2275. 26. R. F. Hanssen, Radar Interferometry (Kluwer Academic, 2001). 27. J. O. Hagberg, L. M. H. Ulander, and J. Askne, “Repeat-pass interferometry over forested terrain,” IEEE Trans. Geosci. Remote Sensing 33, 331–340 (1995).
558
APPLIED OPTICS 兾 Vol. 46, No. 4 兾 1 February 2007
28. C. López-Martínez, X. Fàbregas, and E. Pottier, “Wavelet transform based interferometric SAR coherence estimator,” IEEE Signal Process. Lett. 12, 831– 834 (2005). 29. E. Trouvé, M. Caramma, and H. Maître, “Fringe detection in noisy complex interferograms,” Appl. Opt. 35, 3799 –3806 (1996). 30. L. M. Novak and M. C. Burl, “Optimal speckle reduction polarimetric SAR imagery,” IEEE Trans. Aerosp. Electron. Syst. 26, 293–305 (1990). 31. S. M. Kay, Fundamentals of Statistical Signal Processing: Estimation Theory (Prentice Hall, 1993).