Jun 3, 2005 - Battelle LLC, the National Institute of Standards and Tech- nology U.S. Department of Commerce and UOP LLC. The. APS is supported by the ...
PHYSICAL REVIEW B 71, 245302 共2005兲
Coherent x-ray diffraction from quantum dots I. A. Vartanyants,1,2 I. K. Robinson,2 J. D. Onken,2 M. A. Pfeifer,2 G. J. Williams,2 F. Pfeiffer,3 H. Metzger,4 Z. Zhong,5,6 and G. Bauer6 1HASYLAB,
DESY, Notkestr. 85, Hamburg D-22607, Germany of Physics, University of Illinois, 1110 W. Green St., Urbana, Illinois 61801, USA 3Swiss Light Source, Paul Scherrer Institut, CH-5232 Villigen, Switzerland 4 ESRF, BP 220, 38043 Grenoble, France 5 Max-Planck-Institut für Festkörperforschung, Heisenbergstraße 1, D-70569 Stuttgart, Germany 6Insitut für Hableiter-und Festköperphysik, Johannes Kepler Universität Linz, A-4040 Linz, Austria 共Received 11 October 2004; revised manuscript received 22 December 2004; published 3 June 2005兲 2Department
Coherent x-ray diffraction is a new experimental method for studying perfect and imperfect crystals. Instead of incoherent averaging, a coherent sum of amplitudes produces a coherent diffraction pattern originating from the real space arrangement of the sample. We applied this method for studying quantum dot samples that were specially fabricated GeSi islands of nanometer size and in a regular array embedded into a Si substrate. A coherent beam was focused by special Kirkpatric–Baez optics to a micrometer size. In the experiment it was observed that such a microfocused coherent beam produced coherent diffraction pattern with Bragg spots and broad diffuse maxima. The diffuse peak breaks up into a fine speckle pattern. The grazing incidence diffraction pattern has a typical shape resulting from the periodic array of identical islands. We used this diffraction pattern to reconstruct the average shape of the islands using a model independent approach. DOI: 10.1103/PhysRevB.71.245302
PACS number共s兲: 68.65.Hb, 42.30.Rx, 42.30.Wb, 61.10.Dp
I. INTRODUCTION
Coherent x-ray diffraction 共CXD兲 is a new and fast developing imaging technique in scattering. The method is based on the following principles: if an object of finite size is coherently illuminated and its diffraction pattern is measured finer than twice the Nyquist frequency then it can be uniquely inverted to give a real space image of the sample. This basic idea leads to a development of a lensless microscope, whose objective lenses are substituted by powerful inversion algorithms, which can, in principle, lead to a development of a high resolution and aberration free imaging technique. The basic ideas of the method were first developed in the visible light optics.1,2 In crystallography a similar approach was proposed by Sayre3 who suggested recording a diffraction pattern of a noncrystallographic object in the far field and using a continuous diffraction pattern for electron density reconstruction. In contrast to conventional crystallography when intensity is measured only at Bragg peaks this method was called an oversampling method. This diffractive imaging approach was successfully tested in a number of experiments with soft4,5 and hard x rays.6–8 In future, with the availability of the fourth generation x-ray sources9,10 this approach can be probably used even for a single molecule imaging11 with femtosecond x-ray pulses. This could be especially important for determining the structure of biological objects that cannot be crystallized and hence measured by conventional methods. First experiments were performed on a specially prepared or artificially fabricated samples necessary for testing of the method. But it is of great practical and scientific interest to apply this approach to classes of samples that are currently most important in the modern nanophysics and nanotechnology. This can be, first of all, quantum wires and quantum 1098-0121/2005/71共24兲/245302共9兲/$23.00
dots. Confinement of the electron wave function to dimensions of the order of 10 to 100 nm, that are less than the electron’s mean free path, drastically changes both energy levels and the density of states. This gives on the one hand a unique opportunity to test quantum mechanical concepts and on another opens wide opportunities for applications in the optoelectronics and semiconductor industry.12 It has been shown in many studies that the electronic properties of nanodevices based on quantum structures are first of all determined by their shape, which is a strong function of the growth conditions. Different characterization techniques are used for the studies of the fundamental physical properties and for the optimization of growth parameters of quantum structures. For characterization of the shape and the size of the quantum structures surface atomic force microscopy 共AFM兲13,14 and scanning tunneling microscopy 共STM兲15,16 are commonly used. However, for practical applications many quantum structures must be overgrown. It is known that this often is accompanied by a considerable change of the size and shape of the nanostructures due to interdiffusion and segregation.17,18 Due to their high penetration depth, x rays are favorable in the study of buried crystal structures. Different x-ray scattering and diffraction techniques were successfully used in study of the average shapes, sizes, correlation lengths, composition, and strain of the quantum structures. The most effective were grazing incidence techniques, when penetration depth of the incoming x-ray beam can be varied and surface structures can be effectively studied. These are grazing incidence diffraction 共GID兲19,20 and grazing incidence small angle x-ray scattering 共GISAXS兲21–23 A detailed description of different x-ray scattering techniques and methods developed for the study of quantum structures as well as a summary of obtained results is given in Refs. 24 and 25. What is common for all these x-ray scattering methods is
245302-1
©2005 The American Physical Society
PHYSICAL REVIEW B 71, 245302 共2005兲
VARTANYANTS et al.
that the structural information 共shape, size, and deformation兲 can be obtained only indirectly by comparing results of the experiment with simulated diffraction pattern obtained from realistic modeling. What we propose in this paper is to use CXD as a new method for high resolution imaging of quantum dots with a model independent approach. In our previous paper26 with computer simulations we discussed the possibility of diffractive imaging experiments on quantum dot samples. Quantum dots with pyramidal shape and on a regular two-dimensional 共2D兲 periodic array were chosen as a test sample. Two different types of experiments were discussed; one in which a sample is illuminated with coherent beam of finite size and another in which the transverse coherence length of the incoming beam is much smaller than the illuminated area. It is expected that the typical diffraction pattern in the first type of experiment will contain strong diffraction maxima in the positions corresponding to Bragg positions in the reciprocal lattice. The whole diffraction pattern is modulated with the diffraction pattern corresponding to an individual quantum dot and around each strong individual Bragg peak intensity is modulated due to a finite coherent area of a sample illumination. In the case of the partially coherent illumination it is expected that the width of the individual Bragg spots will increase as soon as the transverse coherence length is reduced. Finally when the coherence length matches the size of the individual islands the Bragg peaks will overlap and produce a continuous diffraction pattern without sharp Bragg spots. In this paper we report experimental results of coherent diffraction on arrays of quantum dots. Samples were investigated in different scattering geometries 共diffraction and GISAXS兲. We will discuss the features that can be observed in the experimental diffraction pattern, compare them with the theoretical predictions and finally will present results of reconstruction of the shape of individual quantum dot islands from the GISAXS experiment. The paper is organized as follows. In Sec. II we discuss the samples of quantum dots that were used for coherent diffraction and details of experimental setup. In Sec. III results of diffraction and GISAXS experiments are given. In Sec. IV we present results of reconstruction of an array of quantum dots and in the final section we give a summary. II. COHERENT X-RAY DIFFRACTION EXPERIMENT
Our samples were ordered GeSi islands grown on prepatterned Si 共001兲 substrates by solid source MBE. The prepatterned substrates were fabricated by holographic lithography and reactive ion etching. The square array of pits was orientated along two orthogonal 具110典 directions. The pattern had a periodicity in the range of 0.4 m and the pits have a depth of about 50 nm. This substrate was cleaned by a RCA cleaning process followed by a HF dip to form a hydrogenated surface.27 After oxygen desorption at 900 ° C, a Si buffer layer of 150 nm was deposited at a growth rate of 0.5 Å / s while the growth temperature was ramped from 550 ° C to 650 ° C. Subsequently, eight monolayers of Ge were deposited at 700 ° C, and finally a 2 nm thick Si capping layer was grown at 500 ° C.
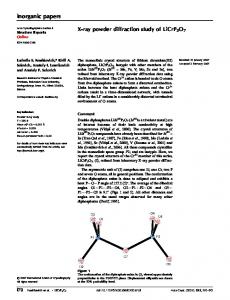
FIG. 1. AFM micrographs of 2D ordered Ge islands.
After growth the surface morphology of the sample was studied in air using a Park Scientific Atomic Force Microscope 共AFM兲. The AFM image of the sample is shown in Fig. 1. We observe a long-range ordering of truncated pyramid shaped SiGe islands. On the patterned substrates the SiGe islands prefer to nucleate at the bottom of the pits rather than on the top of neighboring mesas.28 Samples with quantum dots were measured at the ID-34-C beamline operated by UNICAT at the APS. Monochromatic x rays with an energy of 8.92 keV were selected using a diamond 共111兲 or Si 共111兲 double crystal monochromator. The incident beam was focused by introducing Kirkpatrick-Baez 共KB兲 mirror optics in front of the sample.29 The KB mirrors were mounted 52 meters from the source with the horizontal-focusing mirror centered at 200 mm in front of the sample and the vertical-focusing mirror at 100 mm. The entrance aperture of the KB mirrors was set to 20共H兲 ⫻ 50共V兲 m2 using vacuum roller blade slits. The focal size was determined by scanning a gold wire across the focus to be typically 1.5共H兲 ⫻ 1.2共V兲 m2 at the position of the sample. Due to a small focal size a small number of quantum dots will be coherently illuminated, contrary to the typical diffraction experiments when hundreds or even thousands of quantum dots would be illuminated by a partially coherent beam. With these focusing optics in the beamline due to demagnification we expect that the coherence length on the sample will be also reduced and will be about 0.1 m in both directions The longitudinal coherence length was defined by the band width of the monochromator and was about 1 micron 共diamond兲 and 0.3 micron Si 共111兲. Diffraction data were recorded using Roper Scientific direct-reading charge-coupled device 共CCD兲, with 22.5 m pixels, placed 1.156 m behind the sample, giving a resolution per pixel ⌬Q = 1.8⫻ 10−4 Å−1. III. RESULTS OF EXPERIMENT A. Diffraction experiment
A typical diffraction pattern measured near the 共022兲 position with a 1° incidence angle is shown in Fig. 2共a兲. The
245302-2
PHYSICAL REVIEW B 71, 245302 共2005兲
COHERENT X-RAY DIFFRACTION FROM QUANTUM DOTS
FIG. 2. 共Color online兲 Coherent diffraction pattern from a sample in Fig. 1共a兲. Diffraction pattern measured near the 共022兲 reflection of Si with an incidence angle ␣i = 1 deg. Reciprocal space coordinates of the center of the diffraction pattern is at 共0, 1.99, 1.96兲, top edge is at 共−0.0218, 1.9819, 2.0169兲, the right edge is at 共−0.0101, 1.9373, 1.9639兲 in the Si reciprocal lattice. 共b兲 Diffraction pattern in the grazing angle geometry measured near the 共−111兲 reflection of Si with an incidence angle ␣i = 12.5 deg and exit angle ␣ f = 1 deg. Reciprocal space coordinates of the center of the diffraction pattern is at 共−0.9794, 0.9800, 0.9696兲, top edge is at 共−0.9771, 0.9762, 1.0216兲, the right edge is at 共−1.0216, 1.0048, 0.9734兲 in the Si reciprocal lattice. 共c兲 Calculated diffraction pattern from a sample with a periodic array of quantum dots 共from Ref. 26兲.
sample was aligned carefully by means of the substrate Bragg peaks. Because of the large strain, the peak center was found to be 共0, 1.99, 1.96兲 in the Si reciprocal lattice. At least two different features can be easily distinguished in this diffraction pattern. One, more or less in the center of the image, is the coherent diffraction pattern from the 2D array of quantum dots. Each Bragg spot has a round shape and a symmetry corresponding to the symmetry of the arrangement of the quantum dots on the sample surface. This diffraction pattern is generally similar to the predicted diffraction pattern in our previous paper,26 which is shown for reference in Fig. 2共c兲. In the case of the coherent illumination and a regular 2D array of QD’s coherently scattered amplitude in kinematic approximation can be expressed as 共for details see Ref. 26兲 Acoh共q兲 =
兺n sz共hn兲S共q − hn兲,
共1兲
where sz共q兲 is the Fourier transform 共FT兲 of the projection of the shape function s共r , z兲 of one island sz共r兲 = 兰dzs共r , z兲, S共q兲 is the FT of S共r兲 that is the shape of the coherently illuminated area and hn = 2Hn, the Hn being the 2D reciprocallattice vectors. When the size of the QD is much smaller than the distance between QD’s which are themselves much smaller than the coherently illuminated area, the scattered intensity can be written as
Icoh共q兲 = 兩Acoh共q兲兩2 =
兺n 兩sz共hn兲兩2兩S共q − hn兲兩2 + cross terms. 共2兲
This equation has a simple meaning. The leading term in this expression describes the diffraction pattern from an array of QD’s which is a periodic array of the Bragg peaks with the symmetry of the 2D lattice of QD’s. Each Bragg peak will be smeared by the distribution 兩S共q兲兩2 with a half-width of about 2 / L, where L is the size of the coherently illuminated area. In addition the whole pattern will be modulated by the FT of the shape function corresponding to one island 兩sz共hn兲兩2 关see Fig. 2共c兲兴. There will be intensity modulation between the Bragg peaks because of a small cross term contribution in 共2兲. Diffraction pattern in Fig. 2共c兲 has a sixfold symmetry due to a threefold symmetry of pyramid islands and the same orientation of islands chosen for calculations. In the case of the partially coherent illumination, the diffracted intensity can be written as a convolution of the coherently scattered intensity Icoh共q兲 共2兲 and a FT of a complex coherence factor 共CCF兲 in共q兲 a function that defines coherence properties of the incoming beam 共for details see Ref. 26兲 Ipcoh共q兲 = Icoh共q兲 丢 in共q兲 = 兩Acoh共q兲兩2 丢 in共q兲,
共3兲
where 丢 implies convolution. Now substituting the expression for Acoh共q兲 共1兲 we obtain the following result for the
245302-3
PHYSICAL REVIEW B 71, 245302 共2005兲
VARTANYANTS et al.
diffracted intensity from a 2D array of QD’s in the case of the partially coherent illumination Ipcoh共q兲 =
兺n 兩sz共hn兲兩2 · 关兩S共q − hn兲兩2 丢 in共q兲兴 + cross terms. 共4兲
It is convenient to assume a Gaussian shape for the CCF in共r兲,
冉
in共r − r⬘兲 = exp −
共r − r⬘兲2 2 2lcoh
冊
,
共5兲
where lcoh is the transverse coherence length. In this case we will also have a Gaussian distribution for in共q兲 in the reciprocal space with a typical length qcoh ⬃ 2 / lcoh. Changing the value of the coherence length lcoh in 共5兲 we can gradually go from the case of coherent illumination to the case of the incoming beam with reduced coherence length. For example, in the case of the coherent illumination lcoh Ⰷ L, where L is the typical size of the illuminated part of the sample and qcoh Ⰶ qL = 2 / L. In this limit FT of the CCF in共q兲 can be replaced by a delta function in共q兲 → ␦共q兲. Substituting this into 共4兲 will immediately give the coherent limit of 共2兲, when the intensity distribution around each 2D Bragg point is given by qL. If instead the coherence length lcoh is decreased this will lead to an increase of qcoh in reciprocal space. When lcoh reaches the size L due to convolution in Eq. 共4兲 we will have an approximately twice broader distribution in the reciprocal space around each Bragg peak. If we will further decrease the coherence length but still keep it bigger than the 2D period of QD lattice, then in Eq. 共4兲 we will still have periodic distribution of intensity corresponding to each Bragg position, but with increased width of each peak that will be still determined by the coherence length. Continuing this process we will finally come to the situation when coherence length will be less than the separation between the islands in the QD structure, but still bigger than the size of one individual island. In reciprocal space we expect26 a continuous nonperiodic distribution of intensity with a shape given by the FT of an individual island 兩sz共q兲兩2. As it is clear from this analysis the width and the shape of each Bragg spot depends on the coherent properties of the incoming beam and also on the scattering geometry. They have a more round shape for the symmetrical 共␣i ⬃ ␣ f 兲 scattering geometry, but are more elongated for the grazing exit geometry. The same behavior of the speckles was observed in our previous studies of antiphase domain structure of thin Cu3Au films.30 This behavior can be explained by simple Ewald construction. For a nanometer structures 共as quantum dots兲 in the vertical direction we have elongated shape in the reciprocal space in the direction normal to the surface. For the grazing exit conditions the Ewald sphere is cutting these elongated structures along their long shape producing elongated Bragg shapes observed in experiment 关Fig. 2共b兲兴. There are some additional features that are easily seen on the diffraction pattern in Figs. 2共a兲 and 2共b兲. These are two broad intensity distributions outside the center of the pattern. They are, necessarily, modulated by speckles arising from the coherent incident beam. They have overall banana shape
and fine speckle structure inside each of the maxima. We attribute these features to diffuse scattering originating from disorder. This can be a chemical disorder due to a interdiffusion of Si into Ge dots, shape disorder 共each island in an array varies slightly in its shape兲, strain disorder and possibly missing dots 共vacancies兲 in a 2D array. The most important, probably, here is a strain disorder that is very complicated by its nature and is also related to a chemical and shape disorder. Slightly different composition or shape of the individual islands produce different strain field inside the quantum dot and outside in the surrounding substrate. These broad diffuse scattering maxima could, in principal, be observed also in the conventional incoherent scattering experiment 共see, for example, Ref. 31兲. In the coherent diffraction experiment a smooth diffuse peak breaks into a complicated speckle structure. The fact that we can observe two diffuse maxima apart from the center of the diffraction image can be mostly probably explained by the compressive 共Ge兲 and tensile 共Si兲 deformation field in the islands and in the surrounding substrate. Due to complication of diffraction pattern by strain effects we consider a simpler GISAXS geometry as a good candidate for a phase retrieval. B. GISAXS experiment
We performed a GISAXS experiment on the same sample. This technique is more sensitive to the average shape of the quantum dots and not sensitive to the deformation distribution in the islands. This technique can be also used to get 2D 共Qx , Qy兲 maps of the intensity distribution in the reciprocal space 共see, e.g., Ref. 24兲. The GISAXS experiment was performed in two different geometries. The first one had the incidence angle 共␣i兲 higher than the critical angle of the substrate 关Fig. 3共a兲兴 and the second one with ␣i ⬍ ␣c 关Fig. 3共b兲兴. Critical angles for our energies are ␣c ⬃ 0.2 deg for Si and ␣c ⬃ 0.275 deg for Ge. In the first experiment 关Fig. 3共a兲兴 the CCD detector was covering angles smaller than the specularly scattered incident beam 共␣ f 艋 ␣i兲 and in the second experiment 关Fig. 3共b兲兴 when the incident angle was very small 共␣i = 0.1 deg兲 it covers angles higher than the specularly reflected beam 共␣ f ⬎ ␣i兲. Special precautions were taken to protect the CCD detector from the strong specular reflected beam in the second experiment by setting a beam stop in front of the detector. Unfortunately this also makes part of the reciprocal space with lower exit angles unavailable for analysis. A typical feature that can be seen in the first geometry 关Fig. 3共c兲兴 is a strong Yoneda scattering32,33 for angles close to critical angle for the exit beam. In the direction of the specular beam three strong Bragg spots parallel to the horizon can be recognized. Such a picture appears when all the islands in the sample are aligned along the beam. When the sample is rotated slightly in the horizontal direction Bragg spots abruptly change their orientation and make an angle with the horizon that corresponds to cutting by the Ewald sphere the periodic rods originating normal to the surface of the sample. On the Yoneda peak above the critical angle strong side flares can be observed. We attribute them to the crystal truncation rods perpendicular to the facets of the in-
245302-4
PHYSICAL REVIEW B 71, 245302 共2005兲
COHERENT X-RAY DIFFRACTION FROM QUANTUM DOTS
FIG. 3. 共Color online兲 Coherent diffraction from a sample in Fig. 1 in GISAXS geometry. 共a兲 Geometry with incidence angle ␣i higher than the critical angle ␣c of the substrate 共␣i ⬎ ␣c兲 and CCD detector covering angles smaller than the specularly scattered incident beam; 共b兲 geometry with very small incidence angle 共␣i ⬍ ␣c兲 and CCD detector covering angles higher than the specular reflected beam. 共c兲 Diffraction patern corresponding to geometry 共a兲, here ␣ f = ␣c = 0.199 deg and ␣ f = ␣i = 0.77 deg. 共d兲 Diffraction pattern corresponding to geometry 共b兲.
dividual islands. The final width of these rods is probably related to a small misorientation of the dots in the sample. For very small incident angles 关Fig. 3共d兲兴 and with islands aligned along the beam the diffraction pattern looks as a typical diffraction pattern from a periodic array of scatterers.34 Many diffraction orders 共about 10兲 can be resolved on each side from the central peak, indicating a high periodic quality of the sample. The width of each diffraction rod is related to the number of coherently illuminated dots and the overall shape can be attributed to the shape of the Fourier transform of an average shape of the individual quantum dots. There are also periodic variations of intensity that can be observed along each rod in the vertical direction. The bigger period corresponds to the inverse height of the individual islands and finer variations of intensity can be attributed to the cutting by the Ewald sphere of the side maximum adjacent to the strong one in the direction along the beam. The reciprocal space map and an Ewald sphere construction is shown schematically in Fig. 4.
IV. RECONSTRUCTION OF THE QUANTUM DOTS SHAPE
We attempted to use diffraction pattern shown in Fig. 3共d兲 to reconstruct an average shape of the islands in the sample. Several steps were taken to generate full reciprocal space amplitude. As we discussed before, for these measurements the CCD detector was positioned at angles higher then specularly reflected beam 共0.1 deg兲 and an additional beam stop was used to block high intensities around this beam. So part of the data for low Qz values down to Qz = 0 were irretrievably lost. From our estimates of the geometry of the experiment angles from 0 to 0.299 deg measured from the position of the direct beam were missing, corresponding to a distance of 268 pixels on our CCD detector. In the GSAXS geometry the measurement is not sensitive to strain and the diffraction pattern should be centrosymmetric. We may therefore symmetrize pattern about the origin, adding 2 ⫻ 268 pixels pixels of spacer in between rotated
245302-5
PHYSICAL REVIEW B 71, 245302 共2005兲
VARTANYANTS et al.
FIG. 4. Ewald construction for a scattering on a periodic array of quantum dots. Periodic array of dots with the period dx in the x direction along the beam propagation will give rise to a periodic array of intensities in reciprocal space with the period of 2 / dx. If Nx dots are illuminated by the elongated beam this will give rise to an additional fine structure with spacing in reciprocal space 2 / Nxdx. The finite size of the dots in vertical direction sz will produce additional modulation of intensity in Qz direction with spacing 2 / sz. Ewald sphere with the radius 兩ki兩 = 兩k f 兩 cuts side maximuma adjacent to the strong one and produce a fine variation of intensity on the CCD detector 关see Fig. 3共d兲兴.
copies of the pattern. The data is then interpolated across the spacer region. The next data preparation step was to flag the interpolated rods, but not the regions between them. This flagging tells the fitting algorithm to allow the intensity in those regions to vary rather than forcing them to fixed values at each iteration while keeping information about troughs in the data. To invert GISAXS data we used an iterative approach first proposed by Gerchberg and Saxton35 and then further developed by Fienup.36 What is important for this method of phase retrieval is the fact that no starting model is used for fitting the data. On the first step the missing phases are taken as a random set and are combined with the amplitudes in reciprocal space. Then FT is applied back and forth with specific constraints used in both real and reciprocal space. To test the reproducibility, the calculations are repeated with another set of starting random phases. To avoid stagnation we used an alternation of two algorithms, error-reduction 共ER兲 and hybrid input-output 共HIO兲 共Fienup,36 Millane and Stroud37兲 having about 1000 cycles for each set of random phases. A detailed description of these algorithms and actual parameters used in reconstruction was given in our previous publication 共Ref. 38兲. The following constraints were applied. In reciprocal space, the calculated amplitude on each iteration step was replaced by its experimentally measured amplitude 冑Iexp共q兲 except where the data is flagged. In real space, using the fact that GISAXS measurements are nonsensitive to strain, we can take as a powerful constraint that the electron density must be real and positive. An additional constraint tied to the concept of oversampling is that the density in real space is confined to a region called the support. In the reconstruction algorithm we evolved a support with several stages.5 First reconstructions with the support region defined in the form of the elongated window with the height
FIG. 5. 共Color online兲 共a兲 Reconstructed data in the reciprocal space from GISAXS experiment 关Fig. 3共d兲兴 used for reconstruction; 共b兲 reconstructed image of the quantum dot array in real space obtained with the support in the form of elongated window.
about the expected height of the islands and the width about the width of the focused beam gave quite promising results. In these images one could see a smeared image of a row of eight quantum dots with the period corresponding to the period of the array of QD’s in a sample 共cf. Fig. 5兲. To get more information about the individual shape of the QD’s we used a tighter support in the form of periodic array of square boxes based on the results of the first fits, similar to the support used in our previous paper.26 What was found in this case is that some additional intensity is always present in the reconstructed images between expected positions of Ge QD’s. This additional contribution was attributed to the silicon oxide layer between Ge QD’s. So, on the next step we included this information to the support in the form of additional boxes between the positions of the original Ge positions and with a small shift from exact center between positions of Ge dots. In addition rectangular boxes on the expected Ge positions were further tightened by adding facets on the top of the boxes. This helped avoid stagnation of the algorithm due to overlapping of the original image and a twin image that has the same diffraction pattern. After each modification of the support a new set of fits with random starting phases were performed. The final shape of the support array is shown in Fig. 6共c兲.
245302-6
PHYSICAL REVIEW B 71, 245302 共2005兲
COHERENT X-RAY DIFFRACTION FROM QUANTUM DOTS
FIG. 6. 共Color online兲 共a兲 Experimental data from GISAXS experiment 关Fig. 3共d兲兴 used for reconstruction 共log scale兲; 共b兲 reconstructed data in the reciprocal space; 共c兲 support used for reconstruction; 共d兲 final image of the reconstructed quantum dot array in real space, the period of the array is 0.43 m and the average size of the Ge islands in the array are 128共h兲 ⫻ 45共v兲 nm.
Our approach is not strictly model independent in the sense that there are no constraints on the interpretation of the data. The initial phasing is model independent, but the interpretation of the initial result is then used as a constraint in the subsequent refinement. Since there is a certain degree of subjectivity associated with this step, the expectation that the result should be a compact object of uniform density, there is an element of modeling in our approach. However the fact that the assumption is ultimately supported by the data gives us some confidence with the method. Further testing of the soundness of the support-shrinking step will be needed in the future. Very generally speaking it is similar to refining in the direct modeling, when the initial model is updated on each step that reduces error metric. We show our reciprocal space reconstructed diffraction patterns for the simple support and for the evolved tight support in Figs. 5 and 6, respectively. Reconstruction with the support in the form of elongated window produced a higher resolution reciprocal space image in Fig. 5共a兲, where the fine structure along the diffraction rods can be discerned. Conversely, a more smeared diffraction image 关Fig. 6共b兲兴 is reconstructed with the final tight support 关Fig. 6共c兲兴. The agreement of the calculated diffraction pattern with the data is considerably better for the large support. This agrees with our previous general findings for iterative reconstruction algorithms39 that the tighter is the support used for reconstruction the lower is the fidelity of the reciprocal space diffraction pattern, presumably because of the reduced number of degrees of freedom.
The best reconstructed image from the GISAXS data is shown in Fig. 6共d兲. A row of five islands with stronger intensity is very well reproduced in the reconstructed image. We contribute them to the shape of Ge islands. The islands have a very well defined period of 0.43 m that match very well to the results of an AFM image 共Fig. 1兲. Islands in the middle of the row have brighter intensity and overall intensity damps down away from the center. We attribute this effect to the illuminating beam profile and to partial coherence effects in the incoming beam,38,40 or a complicated wave front profile of the beam passing KB mirrors. Such a variation of the intensity across the view of reconstructed images was also observed in the lensless imaging of C nanotubes with electron diffraction.41 All islands have more flat shape on the bottom and more round shape on the top. We estimated the size of the islands and get 128共h兲 ⫻ 45共v兲 nm. The average size of the islands from AFM measurements is 120共h兲 ⫻ 30共v兲 nm that is in a good agreement with our results. We estimated the spatial resolution in reconstructed images from the highest spatial frequency obtained in experiment in horizontal and vertical directions and got 20共h兲 ⫻ 5共v兲 nm. In the reconstructed images between Ge islands silicon oxide islands with lower contrast can also be seen. They have lower contrast due to a lower Z value, but still contribute to diffraction. It can be noticed that every second diffraction rod in Fig. 3共d兲 has stronger intensity than the previous one. This can be attributed to additional scattering from silicon oxide islands. Scattering from Ge islands can, in principle, be enhanced by using anomalous x-ray scattering. This approach was used recently for quantitative measurements of the Ge composition profile in QD islands.42 Preliminary experiments have shown that using this approach in GISAXS geometry essentially help to separate intensity diffracted from the Ge islands from the diffracted intensity originating on silicon oxide substrate. V. CONCLUSIONS
We presented in this paper results of coherent x-ray diffraction on the samples with quantum dots. We discussed different scattering geometries on these samples. In the large angle coherent diffraction geometry, there are coherent and incoherent contributions to the scattering, with the coherent part producing a map of Bragg spots corresponding to the real space symmetry of quantum dots arrangement. The width and the shape of each Bragg spot is related to the size of the coherently illuminated area and the geometry of experiment. In the grazing exit angle geometry the shape of Bragg spots will be more elongated and in the symmetrical or grazing incident angle geometry they will have more round shape. We discussed the origin of the diffuse scattering that can be observed in the experiment and pointed out that in the case of the coherent incident beam this diffuse scattering shows a speckle behavior which originates from a coherent sum of amplitudes scattered from different parts of the sample. We also discussed results of GISAXS experiments on our samples. We found a different behavior of the diffraction
245302-7
PHYSICAL REVIEW B 71, 245302 共2005兲
VARTANYANTS et al.
pattern for different incident angles below and higher than the critical angle. We used GISAXS measurements with the incident angle smaller than the critical angle for reconstruction of the average shape of islands in the sample by using iterative phase retrieval algorithms. Results of reconstruction were very encouraging. We obtained correct periodicity and average size of the quantum dots 共as compared with the AFM measurements兲 with very general constraints in the real space. Using focusing mirrors and illuminating a finite number of quantum dots gave us the possibility to obtain a nanometer resolution in reconstructed images. We think that this approach of coherent diffraction studies of nanosized materials could be developed into a powerful technique for investigating the structure of nanosize objects.
Bates, Optik 共Jena兲 61, 247 共1982兲. R. Fienup, Opt. Lett. 3, 27 共1978兲. 3 D. Sayre, in Imaging Processes and Coherence in Physics, edited by M. Schlenker 共Springer-Verlag, Berlin, 1980兲. 4 J. Miao, P. Charalambous, J. Kirz, and D. Sayre, Nature 共London兲 400, 342 共1999兲. 5 S. Marchesini, H. N. Chapman, S. P. Hau-Riege, R. A. London, A. Szoke, H. He, M. R. Howells, H. Padmore, R. Rosen, J. C. H. Spence, and U. Weierstall, Opt. Express 11, 2344 共2003兲. 6 I. K. Robinson, I. A. Vartanyants, G. J. Williams, M. A. Pfeifer, and J. A. Pitney, Phys. Rev. Lett. 87, 195505 共2001兲. 7 J. Miao, T. Ishikawa, B. Johnson, E. H. Andersen, B. Lai, and K. O. Hodgson, Phys. Rev. Lett. 89, 088303 共2002兲. 8 G. J. Williams, M. A. Pfeifer, I. A. Vartanyants, and I. K. Robinson, Phys. Rev. Lett. 90, 175501 共2003兲. 9 G. Materlik and T. Tschentscher, LCLS and TESLA feasibility reports, The x-ray free electron laser, TESLA Technical Design Report, 2001. 10 J. Arthur et al., Linac coherent light source 共LCLS兲 conceptual design report. http://www-ssrl.slac.stanford.edu/LCLS/CDR/ 11 R. Neutze, R. Wouts, D. Spoel, E. Weckert, and J. Hajdu, Nature 共London兲 406, 752 共2000兲. 12 D. Bimberg, M. Grundmann, and N. N. Ledentsov, Quantum Dot Heterostructures 共Wiley, Chichester, 1999兲. 13 G. Springholz, V. Holy, M. Pinczolits, and G. Bauer, Science 282, 734 共1998兲. 14 H. Lee, J. A. Johnson, M. Y. He, J. S. Speck, and P. M. Petroff, Appl. Phys. Lett. 78, 105 共2001兲. 15 G. Medeiros-Ribeiro, A. M. Bratkovsky, T. I. Kamins, T. I. Kamins, D. A. Ohlberg, and R. S. Williams, Science 279, 353 共1998兲. 16 J. Marquez, L. Geelhaar, and K. Jacobi, Appl. Phys. Lett. 78, 2309 共2001兲. 17 P. Sutter and M. G. Lagally, Phys. Rev. Lett. 81, 3471 共1998兲. 18 E. Mateeva, P. Sutter, and M. G. Lagally, Appl. Phys. Lett. 74, 567 共1999兲. 19 A. J. Steinfort, P. M. L. O. Scholte, A. Ettema, F. Tuinstra, M. Nielsen, E. Landemark, D.-M. Smilgies, R. Feidenhans’l, G. Falkenberg, L. Seehofer, and R. L. Johnson, Phys. Rev. Lett. 77, 2009 共1996兲. 1 R. 2 J.
ACKNOWLEDGMENTS
This research was supported by the NSF under Grant No. DMR 03-08660. The UNICAT facility at the Advanced Photon Source 共APS兲 is supported by the U.S. DOE under Grant No. DEFG02-91ER45439, through the Frederick Seitz Materials Research Laboratory at the University of Illinois at Urbana-Champaign, the Oak Ridge National Laboratory 共U.S. DOE Contract No. DE-AC05-00OR22725 with UTBattelle LLC兲, the National Institute of Standards and Technology 共U.S. Department of Commerce兲 and UOP LLC. The APS is supported by the U.S. DOE, Basic Energy Sciences, Office of Science under Contract No. W-31-109-ENG-38. In Linz this research was supported by FWF, Vienna 共Project No. SFB025兲.
20 I.
Kegel, T. H. Metzger, A. Lorke, J. Peisl, J. Stangl, G. Bauer, K. Nordlund, W. V. Schoenfeld, and P. M. Petroff, Phys. Rev. B 63, 035318 共2001兲. 21 M. Schmidbauer, Th. Wiebach, H. Raidt, M. Hanke, R. Köhler, and H. Wawra, Phys. Rev. B 58, 10 523 共1998兲. 22 J. Stangl, V. Holy, T. Roch, A. Daniel, G. Bauer, J. Zhu, K. Brunner, and G. Abstreiter, Phys. Rev. B 62, 7229 共2000兲. 23 V. Holy, T. Roch, J. Stangl, A. Daniel, G. Bauer, T. H. Metzger, Y. H. Zhu, K. Brunner, and G. Abstreiter, Phys. Rev. B 63, 205318 共2001兲. 24 M. Schmidbauer, X-Ray Diffuse Scattering from Self-Organized Mezoscopic Semiconductor Structures 共Springer, Berlin, 2004兲. 25 U. Pietsch, V. Holy, and T. Baumbach, High-Resolution X-Ray Scattering From Thin Films To Lateral Nanostructures, 2nd ed., Advanced Texts in Physics 共Springer, Berlin, 2004兲. 26 I. A. Vartanyants and I. K. Robinson, J. Synchrotron Radiat. 10, 409 共2003兲. 27 W. Kern, J. Electrochem. Soc. 137, 1887 共1990兲. 28 Z. Zhong and G. Bauer, Appl. Phys. Lett. 84, 1922 共2004兲. 29 I. K. Robinson, F. Pfeiffer, I. A. Vartanyants, Y. Sun, and Y. Xia, Opt. Express 11, 2329 共2003兲. 30 J. A. Pitney, I. K. Robinson, I. A. Vartaniants, R. Appleton, and C. P. Flynn, Phys. Rev. B 62, 13 084 共2000兲. 31 V. Holy, A. A. Darhuber, J. Stangl, S. Zerlauth, F. Schäffler, G. Bauer, N. Darowski, D. Lübbert, U. Pietsch, and I. Vávra, Phys. Rev. B 58, 7934 共1998兲. 32 S. K. Sinha, E. B. Sirota, S. Garoff, and H. B. Stanley, Phys. Rev. B 38, 2297 共1988兲. 33 F. Pfeiffer, W. Zhang, and I. K. Robinson, Appl. Phys. Lett. 84, 1847 共2004兲. 34 M. Born and E. Wolf, Principles of Optics 7th ed. 共Cambridge University Press, Cambridge, 1999兲. 35 R. W. Gerchberg and W. O. Saxton, Optik 共Jena兲 35, 237 共1972兲. 36 J. R. Fienup, Appl. Opt. 21, 2758 共1982兲. 37 R. P. Millane and W. J. Stroud, J. Opt. Soc. Am. A 14, 568 共1997兲. 38 I. A. Vartanyants and I. K. Robinson, J. Phys.: Condens. Matter 13, 10 593 共2001兲. 39 I. K. Robinson, J. L. Libbert, I. A. Vartanyants, J. A. Pitney,
245302-8
PHYSICAL REVIEW B 71, 245302 共2005兲
COHERENT X-RAY DIFFRACTION FROM QUANTUM DOTS D. M. Smilgies, D. L. Abernathy, and G. Grübel, Phys. Rev. B 60, 9965 共1999兲. 40 I. A. Vartanyants and I. K. Robinson, Opt. Commun. 222, 29 共2003兲.
41 J.-M.
Zuo, I. A. Vartanyants, M. Gao, R. Zhang, and L. A. Nagahara, Science 300, 1419 共2003兲. 42 T. U. Schülli, J. Stangl, Z. Zhong, R. T. Lechner, M. Sztucki, T. H. Metzger, and G. Bauer, Phys. Rev. Lett. 90, 066105 共2003兲.
245302-9