sustainability Article
Communication Networks and Performance of Four New Delhi City Parks Somajita Paul 1,2,3, *, Ferenc Jordán 4 and Harini Nagendra 5 1 2 3 4 5
*
ID
Ashoka Trust for Research in Ecology and the Environment (ATREE), Royal Enclave, Jakkur Post, Srirampura, Bangalore 560064, India Manipal University, Manipal 576104, India School of Environmental Sciences, Jawaharlal Nehru University, New Delhi, Delhi 110067, India Danube Research Institute, MTA Centre for Ecological Research, Karolina út 29, 1113 Budapest, Hungary;
[email protected] School of Development, Azim Premji University, Pixel B, PESIT Campus, Electronics City, Hosur Road, Bangalore 560100, India;
[email protected] Correspondence:
[email protected] or
[email protected]; Tel.: +91-931-213-8242
Received: 26 June 2017; Accepted: 27 August 2017; Published: 31 August 2017
Abstract: Urban green spaces are very important for human wellbeing and environmental sustainability. The efficiency of managing urban green spaces often depends on communication and integration of information. We performed a social network analysis survey for assessing the communication structure among the staff in four New Delhi city parks. We were interested in the relationship between three topological properties of the social networks (centre of gravity, MaxS, compactness) and three network-independent attributes of their performance (average satisfaction, visitor’s median expected improvements, number of species identified). The presence of a dynamic leader, improved communication and flow of information down the hierarchical chain and lastly, maximization of interaction and strengthening of relationships of the co-workers are three network properties that emerge as very important for a well-performing park. Through this study, we demonstrate the ability of social network analysis to provide simple, yet powerful, insights that can assist in improving the management of urban green spaces. Keywords: social network; parks; conservation management; India
1. Introduction Attractive public green spaces contribute to liveable cities and a satisfying experience for urban inhabitants. They also contribute towards sustainable cities [1,2]. Urban green spaces reduce air pollution [3,4], greenhouse gas emissions [5] and urban heat island effects [6,7]. They contribute to enhanced biodiversity and function as important urban wildlife corridors [8,9]. Urban green spaces also contribute to the urban economy. Property prices are often higher near green areas [10,11] and afforestation has very large potential for employment [12,13]. Access to urban green spaces contributes to psychological and physical wellbeing by providing opportunities for recreation, socialization and physical activity [14]. In recent years, awakened by the fact of depleting urban nature at the cost of sustainability, governments and policy-makers have focused on enhancement of urban green spaces, protecting and enhancing ecosystems and developing green networks [15,16]. Parks are important elements of the urban greenscape. Neighbourhood parks are important for promoting physical activity amongst children and adults [17,18]. Social safety, sociability and nature make urban parks more attractive and safe for visitors, including for children [19]. Parks in general should have distributional equity and easy accessibility, attributes that are recognized as essential indicators of a well-functioning urban system [20,21]. Other equally important characteristics that Sustainability 2017, 9, 1551; doi:10.3390/su9091551
www.mdpi.com/journal/sustainability
Sustainability 2017, 9, 1551
2 of 16
influence the likelihood of park use include safety, cleanliness and effective maintenance [17]. Visitor aesthetic experience is another important indicator of good management [22]. Visitors look forward to a good, positive experience from their visits [23]. Thus, managers of urban parks are primarily responsible for providing attractive outdoor recreation resources for city residents. Instituting and upholding good governance and responsibility measures are critical for the effectiveness and protection of the nature [24]. Assessment of park performance appraisal of governance enables improvement in quality of the recreational experience. Apart from biodiversity indicators, a range of indicators [25–27], have been developed by researchers for measuring dimensions of user satisfaction (performance) related to urban parks and urban greening. Some of the indicators of quality of visitor experience are presence of litter, graffiti, maintenance, cleanliness, appearance of parks and behaviour of park staff [25,28]. Hence, the understanding of the attitudes and perspectives of both management and users of the urban parks through performance indicators generates valuable information on the functioning of park management [27]. In India, parks are usually public owned and managed by different public institutions, sometimes with community participation in management. There is a need to understand the governance structure and functioning of different parks and relate them to the condition and performance of the park. This will enable administrators to have consistent information on the quality and function of the parks while formulating environmental policies and plans for a city. Such performance measures have significant impacts on administrative practices [29]. Social Network Analysis (SNA) can provide a suitable approach for such studies. SNA involves mapping, modelling and measuring the relationships among suitably defined players [30]. Network structure is important for understanding the functioning of the whole group and seeing how the behaviour of individual players depends on the group context. SNA has begun to become more widely used to study natural resource management in a variety of contexts. Carlsson and Sandström [31] presented an analytical framework for network study of co-management of natural resources. Bodin and Crona [32] in their review of empirically-based literature, showed that the social networks approach has immense possibility in allowing studies of various cross-scale connections and is significant in investigating natural resource governance practices. Crona and Bodin [33] also used SNA for communication of knowledge and information related to natural resource extraction in Kenya. Dee et al. [34] proposed a framework that uses SNA to examine the impact of management on ecosystem services. SNA has been applied to look into the organizational structure, comparative analysis of organizations [35], and performance of individuals, as well as groups in the organization [36]. This study advances previous research by examining the relationships between the social network structure of the park management communication system and the performance of parks. This comparative study aims at understanding the communication networks for four New Delhi parks, quantifying their structure by SNA and looking for the relationships between performance indicators and network properties. We describe the methods of data collection, calculation of social network indices and park performance indicators, along with a contextual description of the four selected parks. The co-relationships identified between social network indices and park performance indicators help to understand specific factors that are important for urban park management. 2. Materials and Methods 2.1. Methodology The study is based on a questionnaire survey. Two separate sets of questionnaires were used to survey park keepers (managers) and park visitors. This was followed by in-depth interviews of long-term park visitors and park keepers. The collected data were coded, categorized and processed. Data derived from the park keepers was used in the SNA. SNA-generated social network indices,
Sustainability 2017, 9, 1551
3 of 16
while performance indicators were identified from the results of questionnaire surveys of park keepers and park visitors. Following this, associations between the network indices and the performance indicators In-depth interviews assisted in the interpretation of the results (Figure 31). Sustainability were 2017, 9,derived. 1551 of 16
Figure 1. Methodology.
2.1.1. Data Collection
step before before the the SNA, SNA, social social network network data data describing describing the the interactions interactions among among various As a first step ThisThis can can be done through various approaches, like thelike full network method, actors has hastotobebecollected. collected. be done through various approaches, the full network ego-centric networks and snowball approaches [37]. These in-depth interviews provide method, ego-centric networks and snowball approaches [37]. These in-depth interviews provide crucial understanding the SNA SNA results results [38]. [38]. On-site On-site face-to-face face-to-face questionnaire questionnaire contextual information for understanding surveys helped to assess visitor perceptions perceptions [14]. [14]. 2.1.2. Data Analysis As mentioned earlier, the social social network network analysis analysis looks into the the organizational organizational structure and relationships between the actors in aa network. network. Social network data matrices were analysed using standardly-used software programmes, like Ucinet (Harvard, Massachusetts, USA) [39] and the CoSBiLab Trentino, Italy)Italy) [40]. The and quantitative data fromdata the interviews CoSBiLab Graph Graph(Trento, (Trento, Trentino, [40].qualitative The qualitative and quantitative from the were summarized and subsequently coded. Bothcoded. the numerical the graphic display are interviews were summarized and subsequently Both theapproach numericaland approach and the graphic effective wayseffective of describing social structure. visualised using Netdraw software where display are waysaof describing a This socialwas structure. This was visualised using[39], Netdraw the points[39], (nodes) represent the(nodes) actors and their pattern of and reporting is displayed by linesis(or edges). software where the points represent the actors their pattern of reporting displayed Three macroscopic measurements of network structureofcan be used to succinctly by lines (or edges). (global) Three macroscopic (global) measurements network structure can bedescribe used to several aspects of the topology of hierarchies: Centre Gravity (CG), Max and Compactness. succinctly describe several aspects of the topology of of hierarchies: Centre ofSGravity (CG), Max S and Centre of Gravity (CG) shows how “tall” or “flat” a hierarchy is [41]. In a directed hierarchy, Compactness. sources are at bottom of the network a food web) and sinks are at thehierarchy, top (like Centre ofthe Gravity (CG) shows how (like “tall”producers or “flat” in a hierarchy is [41]. In a directed top-predators in abottom food web). CG determines long the is, between the source and sources are at the of the network (like how producers in adistance food web) and sinks are at thelevel top (like an average node the hierarchy: top-predators in in a food web). CG determines how long the distance is, between the source level and ∑iN µi an average node in the hierarchy: CG = (1) N × µimax ∑ (1) = where N refers to the number of nodes, µi describes×the longest path from node i to the source nodes. We also computed its maximal value in the network where N refers to the number of nodes, µi describes the longest path from node i to the source nodes. We also computed its maximal value in the network CG can take values ranging from zero to one. When the network is flat (without hierarchy) values extend towards zero, and when the network is tall (extremely hierarchical) values approach one.
Sustainability 2017, 9, 1551
4 of 16
CG can take values ranging from zero to one. When the network is flat (without hierarchy) values extend towards zero, and when the network is tall (extremely hierarchical) values approach one. The status measure of Harary quantifies the relative power of individuals in the hierarchy [42]. S is computed for each graph node I, as the sum of distances from each node i to all possible nodes j (dij ): N
Si =
∑ dij
(2)
j =1
The highest S value (MaxS) quantifies the influence of the most important person in the hierarchy. Compactness quantifies how close the nodes of the network are to each other and how tightly the network is linked [43]. The minimal value, zero, means isolated nodes with no interaction and the maximal values, one means a complete graph where each pair of nodes is connected. This is a measure for undirected networks, where the direction of the hierarchy is not considered. The survey of the park visitors helps in understanding the perception and preferences of the visitors regarding the park preferences and expectations. Further, the co-relationships help to look for the relationships between park performance indicators and network properties. 2.2. Case Study Our study was located in New Delhi, the capital of India and one of India’s largest cities. One of the districts in Delhi is New Delhi district, popularly known as Lutyens Delhi, with large open green spaces. It is the greenest region of the National Capital Territory of Delhi with more than 45% of its area under green cover [44] and surrounded by dense built-up area. Lutyens Delhi has an impressive list of species, with more than 200 types of trees distributed across green avenues, iconic large parks, heritage bungalows, roundabouts and other areas [45]. The area of New Delhi district is 35 km2 , with 142,000 inhabitants [46]. It houses politically-influential residents—politicians, ministers, bureaucrats and diplomats as well as citizens from all other walks of life. The parks and gardens are well-utilized in this region for exercise and recreation. New Delhi district is a popular location for recreation, and attracts visitors from across the country at it is the most preferred area for leisure activity in Delhi. We selected four parks: Bhuli Bhatiyari park; Buddha Jayanti Smarak park; Safdarjung’s Tomb; and Lodhi Garden (Figure 2). These parks are maintained by Delhi Development Authority, Central Public Works Department, Archaeological Survey of India and New Delhi Municipal Council, respectively. These four parks in New Delhi are iconic, frequently visited, and managed by four different agencies, enabling a useful comparison of park management structures and visitor experiences. Bhuli Bhatiyari Park (BBP) (Figure 2a) covers an area of 60 acres, of which 28 acres are under maintenance. The park has a large number of trees like Jamun (Sygium cumini), Keekar (Prosopis juliflora) and Semal (Bombax ceiba) [47]. It forms a part of Delhi’s native Ridge forest. The Buddha Jayanti Smarak Park (BJSP) (Figure 2b) is the largest of the four parks, covering 100 acres in area, and also located in the Ridge. The park has a large number of trees, many native. Some of the important species are Keekar (Prosopis juliflora), Amaltas (Cassia fistula) and Rosewood (Millettia peguensis) [47]. Safdarjung’s Tomb (ST) (Figure 2c) is the smallest park, with the garden area covering 32 acres. It is a heritage Islamic funerary garden in origin [48] with trees like Royal Palm (Roystonea regia) and Amla (Phyllanthus embilica) [47].
Sustainability 2017, 9, 1551 Sustainability 2017, 9, 1551
5 of 16 5 of 16
Figure Figure2.2.The Thefour fourparks parksunder understudy: study:(a) (a)Bhuli BhuliBhatiyar;i Bhatiyar;i(b) (b)Buddha BuddhaJayanti JayantiSmarak; Smarak;(c) (c)Safdarjung’s Safdarjung’s Tomb; and (d) Lodhi Garden. Tomb; and (d) Lodhi Garden.
2.2.1. Data Collection and Analysis. The Lodhi Garden (LG) (Figure 2d) is in South New Delhi district. The garden covers 80 acres. The In-depth park contains aboutof154 species and 5400astrees of the important tree species interviews a few park keepers, well (NDMC). as some of Some the long-term regular visitors, have in the garden are Arjunof(Terminalia arjuna), (Plumeria), Neem (Azadirachta indica), Jamun been conducted in each the four parks. TheChampa interviewees were informed about the purpose of the (Sygium cumini) andthey Amaltas [47]. of confidentiality of the information was provided interview and why were (Cassia chosen.fistula) Assurance to the Collection interviewees. approximately 40 min interviews explored the participant’s perspectives on Data andThe Analysis the condition of the parks, functioning and management of the park, changes in the parks in terms of of a few park keepers, as well as some in of the the park. long-term regular visitors, greenIn-depth cover andinterviews facilities, their expectations and their involvement haveSocial been conducted in each of the four parks. The interviewees were informed the purpose of network data describing the interactions among various participants about have been collected the interview andinterviews, why they were chosen. between AssuranceApril of confidentiality the information was provided using personal conducted and Augustof2013. Two different sets of to the interviewees. The approximately 40 min interviews explored the participant’s perspectives questionnaires were designed to obtain information from (a) park keepers and (b) park visitors. on A the condition the parks, functioning and management of(representing the park, changes in terms of total of 53 parkofkeepers (31%) were interviewed (12 in BJSP 32% in of the the parks total population green and facilities, their expectations and(70%) their involvement in the park. of parkcover managers), 21 in LG (23%), seven in BBP and 13 in ST (43%)). The questionnaire for the Social network data describing the interactions among various participants have been collected park keepers (see Appendix A) contains questions regarding the respondent’s personal information, usinginvolvement personal interviews, AprilAand August 2013. method Two different of their in the park,conducted and about between their contacts. snowball sampling [49] hassets been questionnaires were designed to obtain information from (a) park keepers and (b) park visitors. applied in the data collection of the park keepers in each of the parks. The gardeners and security A total are of 53easily-identifiable, park keepers (31%)socially-visible were interviewed (12 in BJSP[49]. (representing 32%knowledge of the totalassisted population guards respondents Hence, their us oflocating park managers), 21 in LG (23%), seven in BBP (70%) andof13 inparks ST (43%)). The questionnaire for the in subsequent respondents (keepers) within each the though their social contacts. parkThe keepers (seeset Appendix A) containsrecorded questions regarding the respondent’s personal information, second of questionnaires information about visitor’s satisfaction, expected their involvement in the park, and about their contacts. A snowball sampling method [49]1has been improvements, knowledge about the park and distance and frequency of park visits (Table of [14]). applied in the datawas collection of the keepers in the each of theinfluencing parks. The the gardeners and and security This questionnaire also aimed atpark understanding factors perception use guards are easily-identifiable, socially-visible respondents [49]. Hence, their knowledge assisted us in of urban nature [14], drawing on each other. Visitor responses were categorized and coded for locating subsequent respondents (keepers) within each ofnamely the parks thoughoftheir social contacts. and analysis. For the present study, two indicator variables, ‘number species identified’ The second set of questionnaires recorded information about visitor’s satisfaction, ‘expected improvements’ were selected. A total of 123 respondents (26 in BJSP, 28 in LG, 37expected in BBP improvements, knowledge about thenon-responsive park and distance frequency park (Table [14]). and 32 in ST) were interviewed. The rateand for the surveyof was 7%visits overall (7% 1inofBJSP, 7% in LG, 3% in BBP and 11% in ST).
Sustainability 2017, 9, 1551
6 of 16
This questionnaire was also aimed at understanding the factors influencing the perception and use of urban nature [14], drawing on each other. Visitor responses were categorized and coded for analysis. For the present study, two indicator variables, namely ‘number of species identified’ and ‘expected improvements’ were selected. A total of 123 respondents (26 in BJSP, 28 in LG, 37 in BBP and 32 in ST) were interviewed. The non-responsive rate for the survey was 7% overall (7% in BJSP, 7% in LG, 3% in BBP and 11% in ST). Answering the questionnaires took just about 5–7 min for the visitors and park keepers. This ensured that it echoed their instantaneous observations. Weekdays, weekends and public holidays were used for visitor surveys. Interviews were largely conducted in the morning between 8:30 and 10:00 a.m. and in the evening between 5:00 and 6:00 p.m., on weekdays, weekends and major public holidays. We recognize that this survey cannot be considered to represent all visitors to the park. Nevertheless, we are confident that it represents the view of a range of visitors. The park keepers were interviewed on weekdays. We conducted an analysis of the qualitative data on keepers’ and visitors’ attitudes and expectations, and examined their responses in detailed in-depth interviews to understand the reasoning behind the responses given. The indicators were developed on the basis of four guiding factors: (a) relevancy of the factors linked to park management; (b) representing aspects of both the park managers and keepers; (c) data availability; and (d) simplicity and efficiency by avoiding repetition [50]. ANOVA [51] was used to examine the significant differences in the performance indicators of the four parks. In the SNA, relationships that exist among the park keepers were compiled in an adjacency matrix, where each respondent in the network has one cell. The second matrix is of attribute data. In this one interviewee has a cell corresponding to one attribute. Social network data matrices were analysed using standardly-used software programmes: Ucinet (Harvard, Massachusetts, USA) [39] and CoSBiLab Graph (Trento, Trentino, Italy) [40]. Three macroscopic (global) measurements of network structure from the SNA: centre of gravity (CG), MaxS and compactness were used to explore associations with park performance indicators. The CG provides information about the strength of communication between workers and leaders (the bottom and the top) in a hierarchical social structure. MaxS provides information about the how important (influential) the most important actor in the hierarchy is. Compactness is an indicator of the richness of general interactions and the potential for collaboration. 3. Results The in-depth interviews of the park keepers in the four parks reflect varied views about the park’s management and functioning, manpower, changes, problems, their probable solution, involvement and their expectations from the park. The key issues which emerged in each of the parks were identified. BJP has 30 permanent gardeners, about 30 temporary workers and seven security guards. The major problems reported by park staff are littering, hooliganism and the lack of availability of water for gardening, especially during the summer, as also evident from the presence of dry tanks within the park. The gardeners, however, express trust that administrators will find a solution to the problems, especially of water scarcity. The green cover has increased over the years, along with the enhancement of the safety of the visitors and facilities like park benches. LG employs 85 gardeners and seven private security guards. Most visitors, as well as park staff, are very satisfied with the quality of the park. Some minor problems mentioned are the insufficiency of water for plants, littering by visitors and incursions by street dogs. Concern for the park’s cleanliness has been voiced by the park keepers, because it does not come under the gardener’s purview. The garden has been consistently in good stature with new additions, like an open-air gymnasium, herbal garden, etc. BBP is looked after by 10 permanent gardeners. The park is not well maintained, with leaf litter and animal droppings strewn around. The park faces the problem of a lack of water for the plants.
Sustainability 2017, 9, 1551
7 of 16
The staff size is insufficient for monitoring; personnel are old and unable to traverse the park, leading to an unsafe condition and presence of anti-social activity within the park premises. The park has a large number of trees that have been planted in compensatory plantation initiatives, leading to overcrowding of trees in recent years. There are 11 gardeners and 19 security guards working in the ST. The park is well laid out with neatly-pruned and widely-spaced trees, yet all parts are not equally maintained. Lack of sufficient Sustainability 2017, 9, 1551 7 of 16 personnel has led to less visited areas of the park becoming somewhat messy, with dried leaf branches and leaf litter on the paths.onThe is impacted scarcity, very few gardeners branches andfound leaf litter found thepark paths. The parkbyiswater impacted by yet water scarcity, yet veryseem few to be concerned by this. The security guard’s major concern is to protect the monument public gardeners seem to be concerned by this. The security guard’s major concern is to from protect the vandalism. authorities are The striving plant the species of trees that were originally planted monument The frompark public vandalism. parktoauthorities are striving to plant the species of trees that on theoriginally tomb premises. were planted on the tomb premises. The derived onon thethe basis of park keeper’s pattern of Thesocial socialnetwork networkstructures structuresofoffour fourparks parkswere were derived basis of park keeper’s pattern communication amongst each other. It is observed that the BBP has the smallest network, while LG of communication amongst each other. It is observed that the BBP has the smallest network, while has network (Table 1, Figure 3). 3). LG the haslargest the largest network (Table 1, Figure Table Table1.1.Network Networkindices indicesof ofparks. parks.
Parks Parks BBP BBP BJSP BJSP ST ST LG LG
Nodes Nodes 8 8 13 13 15 15 22 22
Network Indices Network Indices Links CG MaxS Links CG MaxS 7 0.25 6 7 0.25 0.18 6 4 21 21 0.18 4 13 0.2 3 13 0.2 3 36 0.15 11 36 0.15 11
Compactness Compactness 0.11 0.11 0.13 0.13 0.06 0.06 0.08 0.08
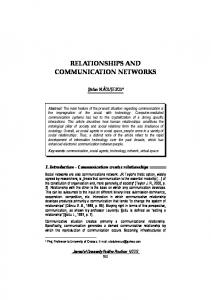
Figure 3. The organization chart of the four parks under study: (a) Bhuli Bhatiyari Park; (b) Buddha Figure 3. The organization chart of the four parks under study: (a) Bhuli Bhatiyari Park; (b) Buddha Jayanti Smarak Park; (c) Safdarjung’s Tomb; and (d) Lodhi Garden. Arrows point at higher officials in Jayanti Smarak Park; (c) Safdarjung’s Tomb; and (d) Lodhi Garden. Arrows point at higher officials the hierarchy. in the hierarchy.
Amongst the four parks, in terms of CG, LG (0.15), followed by BJSP (0.18), have relatively low CG, indicating a flat network. On the other hand, BBP has relatively high (0.25) CG, denoting a tall network. In LG, MaxS is highest (11), signifying the importance of the most important person in the network and MaxS in ST (3) is the lowest among the four parks. In general, all the park networks have low compactness. Still, amongst the four parks, ST (0.06) has the comparatively lowest compactness, followed by LG (0.08). BJSP (0.13) has the comparatively
Sustainability 2017, 9, 1551
8 of 16
Amongst the four parks, in terms of CG, LG (0.15), followed by BJSP (0.18), have relatively low CG, indicating a flat network. On the other hand, BBP has relatively high (0.25) CG, denoting a tall network. In LG, MaxS is highest (11), signifying the importance of the most important person in the network and MaxS in ST (3) is the lowest among the four parks. In general, all the park networks have low compactness. Still, amongst the four parks, ST (0.06) has the comparatively lowest compactness, followed by LG (0.08). BJSP (0.13) has the comparatively highest compactness value amongst the four parks. The park keepers were questioned about their satisfaction regarding the park (Table 2). Satisfaction, here, is defined as a cognitive judgmental process of the present state of affairs, based on an individual’s judgment of self-imposed standard [52]. Studies have shown that the satisfied workers are productive workers which, in turn, has a favorable influence on the functioning of the system, as perceived by their clients [53]. In the present study, park keeper’s satisfaction indicates satisfaction with the management of the park, ranked on a Likert scale from 1 (dissatisfied) to 4 (highly satisfied). LG’s park keepers are highly (4) satisfied with the quality of the park, whereas BBP keepers’ average satisfaction with the quality of the park is least (2.57) among the four parks. Table 2. Performance indicators of parks. Park Keepers
Park Visitors
Parks
Average Satisfaction
Median Problems
Median Expected Improvements
Average Number of Species Identified
BBP BJSP ST LG p value (ANOVA)
2.57 3.25 3.62 4