Discussions
This discussion paper is/has been under review for the journal Biogeosciences (BG). Please refer to the corresponding final paper in BG if available.
Discussion Paper
Biogeosciences
Open Access
Biogeosciences Discuss., 11, 3837–3864, 2014 www.biogeosciences-discuss.net/11/3837/2014/ doi:10.5194/bgd-11-3837-2014 © Author(s) 2014. CC Attribution 3.0 License.
| Institute of Agriculture & Environment, Massey University, Palmerston North, New Zealand Institute of Bio- and Geosciences, IBG-2: Plant Sciences, Forschungszentrum Jülich GmbH, Jülich, Germany 3 Remote Sensing Laboratories, University of Zürich, Zürich, Switzerland * These authors contributed equally to this work. 2
Received: 1 February 2014 – Accepted: 5 February 2014 – Published: 7 March 2014
|
3837
Discussion Paper
Published by Copernicus Publications on behalf of the European Geosciences Union.
|
Correspondence to: S. von Bueren (
[email protected]) and A. Burkart (
[email protected])
Discussion Paper
1
11, 3837–3864, 2014
Comparative validation of UAV based sensors S. von Bueren et al.
Title Page Abstract
Introduction
Conclusions
References
Tables
Figures
J
I
J
I
Back
Close
|
S. von Bueren1,* , A. Burkart2,* , A. Hueni3 , U. Rascher2 , M. Tuohy1 , and I. Yule1
Discussion Paper
Comparative validation of UAV based sensors for the use in vegetation monitoring
BGD
Full Screen / Esc Printer-friendly Version Interactive Discussion
5
Discussion Paper |
3838
|
25
Discussion Paper
20
In the last decade the use of unmanned aerial vehicles (UAVs) as remote sensing platforms has become increasingly popular for a wide range of scientific disciplines and applications. With the development of robust, autonomous and lightweight sensors, UAVs are rapidly becoming stand-alone remote sensing systems that deliver information of high spatial and temporal resolution in a non-invasive manner. This application of UAV systems is particularly promising for precision agriculture where spatial information needs to be available at high temporal frequency and spatial resolution in order to identify in-field variability (Zhang et al., 2002; Lelong et al., 2008; Sta◆ord, 2000; Seelan et al., 2003). Precision agriculture aims at identifying crop and soil properties
BGD 11, 3837–3864, 2014
Comparative validation of UAV based sensors S. von Bueren et al.
Title Page Abstract
Introduction
Conclusions
References
Tables
Figures
J
I
J
I
Back
Close
|
1 Introduction
Discussion Paper
15
|
10
Unmanned Aerial Vehicles (UAVs) equipped with lightweight spectral sensors facilitate non-destructive, near real time vegetation analysis. In order to guarantee quality scientific analysis, data acquisition protocols and processing methodologies need to be developed and new sensors must be trialed against state of the art instruments. In the following study, four di◆erent types of optical UAV based sensors (RGB camera, near infrared camera, six band multispectral camera, and a high resolution spectrometer) were compared and validated in order to evaluate their applicability for vegetation monitoring with a focus on precision agricultural applications. Data was collected in New Zealand over ryegrass pastures of various conditions. The UAV sensor data was validated with ground spectral measurements. It was found that large scale imaging of pasture variability can be achieved by either using a true color or a modified near infrared camera. A six band multispectral camera was used as an imaging spectrometer capable of identifying in field variations of vegetation status that correlate with ground spectral measurements. The high resolution spectrometer was validated and found to deliver spectral data that can match the quality of ground spectral measurements.
Discussion Paper
Abstract
Full Screen / Esc Printer-friendly Version Interactive Discussion
|
2.1 Experimental site The experimental campaign was conducted in February 2013 on a dairy farm in Palmerston North, New Zealand, (No 1 Dairy, 40.376, 175.606). No 1 dairy is a fully operational dairy farm with an e◆ective area of 119.7 ha. UAV flights were performed over four di◆erent paddocks with distinct characteristics from bare soil, to dry and irri-
Discussion Paper
3839
|
25
Discussion Paper
2 Instruments and methods
BGD 11, 3837–3864, 2014
Comparative validation of UAV based sensors S. von Bueren et al.
Title Page Abstract
Introduction
Conclusions
References
Tables
Figures
J
I
J
I
Back
Close
|
20
Discussion Paper
15
|
10
Discussion Paper
5
in near real-time (Lebourgeois et al., 2012; Primicerio et al., 2012) and at delivering results to farmers and decision makers with minimum delay to enable decision making based on current crop and soil status. The use of input resources such as fertilizer, herbicides or water (Van Alphen and Stoorvogel, 2000; Carrara et al., 2004; Chávez et al., 2010) are matched to the current demand by the crop leading to an economical use of resources. Recent studies demonstrate the feasibility of using UAV based sensors to detect water stress or quantify biomass content (Berni et al., 2009; Berni et al., 2008; Zarco-Tejada et al., 2011). Zhang and Kovacs (2012) provide a comprehensive review of unmanned aerial systems applied in precision agriculture. In recent years, a number of sensors light and small enough to be carried by UAVs have been developed. New sensors need to be trialed and validated against state of the art reference instruments. The extraction of quantitative information relies on thorough calibration procedures and instrument characterization. The present study uses cameras and spectrometers mounted on UAVs to acquire spectral information over dairy pastures to evaluate each instrument in terms of radiometric quality and accuracy of spectral information obtainable, as compared to a ground reference instrument. Handling and limitation of the UAVs, flight planning, field procedures as well as the capabilities of the di◆erent sensors are discussed. Results are evaluated with a focus on inter sensor comparability.
Full Screen / Esc Printer-friendly Version Interactive Discussion
2.2 UAV systems
5
Discussion Paper |
3840
|
25
Four UAV sensors (Fig. 1) were tested and compared in terms of their ability to produce remote sensing data over vegetation. All of the sensors were lighter than 1 kg including batteries and were either modified or especially designed for use on remotely controlled platforms. The sensors share a spectral range in the VNIR which was considered the most relevant region of the electromagnetic spectrum for agricultural research applications (Lebourgeois et al., 2008). In terms of spatial and spectral resolution (Fig. 2), the sensors di◆er significantly. Table 2 lists their relevant properties. Mini MCA6: the Mini MCA6 (Multispectral Camera Array) is a six band multispectral camera (Tetracam, Chatsworth, CA, USA) that acquires imagery in six discrete wavebands. Exchangeable filters in the range of 400 to 1100 nm can be fitted to six identical monochromatic cameras. Table 3 lists the filter set up used during the study. The camera firmware allows pre-setting all imaging related parameters such as exposure time, delay between images as well as image format and size. Six two gigabyte Compact-
Discussion Paper
20
BGD 11, 3837–3864, 2014
Comparative validation of UAV based sensors S. von Bueren et al.
Title Page Abstract
Introduction
Conclusions
References
Tables
Figures
J
I
J
I
Back
Close
|
15
Discussion Paper
2.3 UAV sensors
|
10
As shown in Table 1, two di◆erent UAV systems were used: a QuadKopter (MikroKopter), owned and operated by Massey University, and a Falcon-8 (Asctec Krailing, Germany), from the Research Centre Jülich, Germany. The main di◆erence between the Falcon-8 and the MikroKopter platforms is the payload restriction, which precludes the Falcon-8 from lifting sensors heavier than 0.5 kg. Both UAVs with their payloads were intensively tested during multiple flights before the study. During the data acquisition experiments, the Falcon-8 was flown in GPS mode with sample locations defined as waypoints, while the QuadKopter was flown manually over each point during data acquisition.
Discussion Paper
gated ryegrass pasture. At the time of data acquisition between 11 a.m. and 3 p.m. LT no clouds were visible.
Full Screen / Esc Printer-friendly Version Interactive Discussion
3841
|
Discussion Paper | Discussion Paper
25
BGD 11, 3837–3864, 2014
Comparative validation of UAV based sensors S. von Bueren et al.
Title Page Abstract
Introduction
Conclusions
References
Tables
Figures
J
I
J
I
Back
Close
|
20
Discussion Paper
15
|
10
Discussion Paper
5
Flash memory cards can store up to 800 images (10 bit RAW format, full resolution). With an open angle of 38.3 ⇥ 31.0 the camera has a relatively narrow field of view as opposed to the Canon and Sony cameras. The camera was run on a 2 s shutter release interval with images saved in a 10bit RAW format. Positioning of the camera was achieved by hovering the UAV over the vegetation target for at least 30 s per waypoint. STS spectrometer: the spectrometer was custom designed for UAV based remote sensing at the Research Centre Jülich (Burkart et al., 2013). Its design is based on the STS VIS spectrometer (Ocean Optics, Dunedin, FL, USA). The sensor’s light weight and high spectral accuracy make it ideal for the use on an UAV. The spectrometer runs on an independent battery power source to the UAV. Spectral data acquisition is triggered by software on a ground based laptop. An identical spectrometer on the ground simultaneously acquires spectra of incoming radiance every time the airborne sensor is triggered. Acquired spectra are saved on a micro SD card. The UAV spectrometer was positioned over the target using a live video link from the on board RGB camera that is positioned next to the spectrometer and points downwards in a nadir direction to simulate the spectrometer’s field of view. Sony RGB Camera: a SONY Nex5n (Sony Corporation, Minato, Japan) modified by Asctec was attached to the Falcon-8 using a specially designed camera mount. The camera has a live video feed to the UAV operator and remote triggering for image acquisition over the paddock is available. Spectral sensitivity is given by the common Bayer-Matrix (Pullanagari et al., 2012) and hot-mirror used in consumer digital cameras. Canon Power Shot infrared: the Canon PowerShot SD780 IS is a consumer digital camera that has been professionally (LDP LLC, Carlstadt, US) converted to acquire near-infrared imagery. The near infrared filter has been replaced with a red light blocking filter. Customized CHDK firmware allows running the camera in a continuous capture mode at specific time intervals (2 s, user defined). The main di◆erence to the MCA6 is the inability to adjust filter settings and the camera’s band widths. According to manufacturer information each band has an approximate width of a hundred nanometers.
Full Screen / Esc Printer-friendly Version Interactive Discussion
| Discussion Paper
25
Discussion Paper
20
BGD 11, 3837–3864, 2014
Comparative validation of UAV based sensors S. von Bueren et al.
Title Page Abstract
Introduction
Conclusions
References
Tables
Figures
J
I
J
I
Back
Close
|
15
|
Taking into account the operational requirements of each sensor and flying platform, a detailed flight plan was developed. Eight sampling locations defined by waypoints were selected with a focus on covering a wide range of pasture qualities from dry to fully irrigated ryegrass pastures. Each sampling location was georeferenced with a GPS (Legend, HTC, Taoyuan, Taiwan) and marked with a tarpaulin marker, which was clearly visible in all spectral bands of the aerial imagery. The unique markers allowed precise in air positioning of the UAV carrying the imaging spectrometers and matching of image footprints between the di◆erent instruments. In order to avoid interference e◆ects of the markers with the hyperspectral sensor, they were removed before acquisition of UAV spectra. The sensors were then flown over the targets in the following order: (1) RGB camera for an overview shot (2) IR camera for an overview shot (3) MCA6 over calibration sites (black, grey, white and red tarpaulin, black material foam, bare soil) and way points (4) UAV spectrometer over waypoints. Overview images cover all sampling locations in an area with a single shot from 100 m to 150 m flight height. MCA6 images were taken from 25 m above the ground with the MikroKopter UAV. Hyperspectral data were collected by a semi-autonomous waypoint flight from a height of 10–15 m with 15 spec3842
Discussion Paper
2.4 Flight planning and data acquisition procedure
|
10
Discussion Paper
5
Images are saved as a JPEG. A live video link from the UAV’s on-board camera enabled precise positioning of the RGB and infrared cameras over the ryegrass pastures. ASD Handheld 2 ground based reference sensor: ground based spectral measurements were acquired with an ASD HandHeld 2 portable spectroradiometer (Analytical Spectral Devices, Inc., Boulder, Colorado, US). The device covers a spectral range from 325 to 1075 nm which makes it suitable for comparison with the airborne UAV sensors flown in this study. At 700 nm the device has a spectral resolution of 3 nm and the field of view equates to 25 . A Spectralon® panel (Spectralon® , Labsphere, Inc., North Sutton, NH, USA) was used to acquire white reference measurements before each target measurement.
Full Screen / Esc Printer-friendly Version Interactive Discussion
Discussion Paper | Discussion Paper
25
BGD 11, 3837–3864, 2014
Comparative validation of UAV based sensors S. von Bueren et al.
Title Page Abstract
Introduction
Conclusions
References
Tables
Figures
J
I
J
I
Back
Close
|
20
|
Data from each sensor underwent calibration and correction procedures. Footprints were matched between sensors by defining a 0.3 by 0.3 m area below the waypoint marker as the region of interest. Sony RGB Camera: the red, green and blue bands were calibrated to a reflectance factor with the empirical line method relating the ASD reflectance over four colored reference tarpaulins (Fig. 3) to real reflectance (Aber et al., 2006). Power Shot 780is Infrared: the camera was corrected using the same method as the RGB camera, but with the center wavelengths adapted to the IR sensitive pixels. UAV based spectrometer: as described in (Burkart et al. 2013) a temperature based dark current correction (Kuusk, 2011) and an inter-calibration of the air and ground based spectrometer were applied before derivation of the reflectance factor. Mini MCA6: a proprietary software package (PixelWrench2 by Tetracam) that was delivered with the Tetracam (MCA6) was used to transfer images from the Compact Flash memory cards to the computer. Each RAW band was processed to a TIF (Tagged Image File Format) image in order to identify all images that show the target area. As a result, between 6 and 15 images per target were found to be suitable for further image processing (total of 109 images) and two images showing the tarpaulin areas and bare soil were selected for facilitating reflectance factor calibration. From there, RAW image processing was done in Matlab (The MathWorks Inc., 2011). Both the calibration images as well as the vegetation target images were noise corrected and vignetting e◆ects were removed for each of the six cameras (Kelcey et al., 2012; Olsen 3843
Discussion Paper
15
2.5 Data processing
|
10
Discussion Paper
5
tra collected per waypoint. Camera settings, such as exposure time and white balance settings were optimized and fixed to the illumination conditions. Flights were conducted consecutively to minimize variability due to changing illumination and vegetation status. Figure 3 depicts raw data from the imaging sensors before any processing has been applied. Before the flight of the hyperspectral UAV sensor, ASD ground reference measurements were taken at each waypoint.
Full Screen / Esc Printer-friendly Version Interactive Discussion
3844
|
Discussion Paper | Discussion Paper
25
BGD 11, 3837–3864, 2014
Comparative validation of UAV based sensors S. von Bueren et al.
Title Page Abstract
Introduction
Conclusions
References
Tables
Figures
J
I
J
I
Back
Close
|
20
Discussion Paper
15
|
10
Discussion Paper
5
et al., 2010; Yu, 2004). A sensor correction factor was applied to each filter based on filter sensitivity factory information (Kelcey and Lucieer, 2012). The two images that show the tarpaulins and the bare soil were selected as calibration images and processed separately. The white and the red tarpaulins have been excluded from analysis due to pixel saturation and high specular reflection. For each of the remaining four calibration surfaces (black, grey, black foam and bare soil) a subset image area was defined from which the pixel values for the empirical line method were derived. For each calibration surface, ten ASD reference spectra were convolved to the spectral response of the mini MCA6 (see Spectral Convolution). The empirical line method (Smith and Milton, 1999; Baugh and Groeneveld, 2008) was applied to establish band specific calibration coecients. Using those coecients the empirical line method was applied to each vegetation target image on a pixel by pixel basis thus converting digital numbers of the image pixels to a surface reflectance factor. In order to extract the footprint area over which ground ASD and UAV spectrometer data had been acquired, each image had the relevant image area identified and extracted by identifying the markers in the image. An average reflection factor was calculated for each footprint resulting in between 6 to 15 values per sample location for the MCA6 images. Standard deviations, mean and median were calculated for each waypoint. ASD handheld 2 ground reference sensor: ASD handheld spectral binary files were downloaded and converted to reflectance using the HH2Sync software package (Version 1.30, ASD Inc.). Spectral data were then imported into the spectral database SPECCHIO (Agati et al., 2013). Spectral Convolutions: in order to synthesize STS spectrometer data from ground based ASD data, a discrete spectral convolution was applied (Zanoni et al., 2002). Each STS band was convolved by applying Eq. (1), using a Gaussian function to represent the spectral response function of each STS band. These spectral response functions (SRFs) were parameterized by the calibrated center wavelengths of the STS
Full Screen / Esc Printer-friendly Version Interactive Discussion
cj Rj
j =n
where 15
(1) cj
Rk = Reflectance factor of Ocean Optics band k
n : m = convolution range of Ocean Optics band k
|
3845
Discussion Paper
cj = weighting coecient based on the Ocean Optics spectral responsivity at wavelength of ASD band j
|
Rj = Reflectance factor of ASD band j
Discussion Paper
m P
BGD 11, 3837–3864, 2014
Comparative validation of UAV based sensors S. von Bueren et al.
Title Page Abstract
Introduction
Conclusions
References
Tables
Figures
J
I
J
I
Back
Close
|
j =n
Discussion Paper
Rk =
m P
|
10
Discussion Paper
5
instrument and by a nominal FWHM (Full Width at Half Maximum) of 3 nm for all spectral bands. The discrete convolution range (nm) of each band was based on ±3 sigma of the Gaussian function and applied at the wavelength positions where an ASD band occurred, i.e. at every nanometer. It must be noted that the results of this convolution cannot truly emulate the actual system response of the STS as the ASD sampled input spectra are already a discrete representation of the continuous electromagnetic spectrum and are hence already inherently smoothed by the measurement process of the ASD. In a similar manner, MCA6 bands were simulated, but replacing the Gaussian assumption of the SRFs with the spectral transmission values (Table 3) digitized from analogue figures supplied by the filter manufacturer (Andover Corporation, Salem, US).
Full Screen / Esc Printer-friendly Version Interactive Discussion
5
| Discussion Paper |
3846
Discussion Paper
25
BGD 11, 3837–3864, 2014
Comparative validation of UAV based sensors S. von Bueren et al.
Title Page Abstract
Introduction
Conclusions
References
Tables
Figures
J
I
J
I
Back
Close
|
20
Discussion Paper
15
|
10
Spectral sensors: calibrated reflectance factors of the UAV spectrometer and the MCA6 were compared to calculated ASD reflectance values using linear regression analysis. The UAV spectrometer and the ASD Handheld 2 were compared over the whole STS spectrum while the MCA6 was compared to the ASD in its six discrete bands. Figure 4 shows spectral information derived from the two UAV sensors (STS spectrometer and MCA6) in direct comparison with the convolved ASD derived reflectance spectra for two distinctively di◆erent waypoints in terms of ground biomass cover and greenness of vegetation. Waypoint 2 is a recently grazed pasture with a high percentage of dead matter and senescent leaves. Soil background reflectance was high and the paddock was dry with no irrigation scheme operating. Pasture on waypoint 8 had not been grazed recently and therefore vegetation cover was dense with a mix of pastures and clover. The paddock undergoes daily irrigation and no soil background signal was detectable. The data indicates that the MCA6 estimates higher reflectance factors than the UAV spectrometer and the ASD for the blue, green as well as the lowest red band. In the far red and the NIR band, values are continuously lower than those derived from the ASD but still higher than reflectance measured by the UAV spectrometer. While the ASD detects a steep increase in reflectance in the red edge, both UAV sensors detect a lower signal in the same region of the spectrum. The mean MCA6 derived spectra shows an increase in reflectance in the green peak region of the vegetation spectrum that is approximately 0.05 % higher than in the same region of the UAV spectrometer. The slope between the green and the red bands is positive for both sensors demonstrating the dried, stressed state of the vegetation at waypoint 2. While MCA6 bands show low correlations with the UAV spectrometer and the ASD for the 551 nm and the 661 nm bands, its values are in line with the other sensors in the red edge region of the spectra. The MCA6 correlates significantly with ASD derived reflectance (R 2 = 0.92, Fig. 5) when compared over all eight waypoints and over all six bands (n = 48). Shortcomings
Discussion Paper
3 Results
Full Screen / Esc Printer-friendly Version Interactive Discussion
Discussion Paper |
3847
|
25
Discussion Paper
20
Spectral performance of UAV sensors: when compared to the UAV spectrometer and the ground reference data, the MCA6 performs strongly in the red edge region of the electromagnetic spectrum. This observation is supported by the CMOS sensor relative sensitivity which is over 90 % in the red edge and the near infrared bands according to factory information (Tetracam Inc.). Largest deviations were observed in the green and red band where the MCA6 consistently overestimates vegetation reflectance factors. On sample locations with low biomass cover and/or stressed pastures this results in a negative slope between the green and low red bands. The sensor’s performance is further impaired when high soil background reflectance is present, as is the case for the first three waypoints and the bare soil calibration target. This suggests that
BGD 11, 3837–3864, 2014
Comparative validation of UAV based sensors S. von Bueren et al.
Title Page Abstract
Introduction
Conclusions
References
Tables
Figures
J
I
J
I
Back
Close
|
4 Discussion
Discussion Paper
15
|
10
Discussion Paper
5
of spectral accuracy of the MCA6 are revealed when comparing band reflectance values over di◆erent sample locations (Fig. 6). The green band (551 nm) achieves lowest 2 correlations with ASD convolved reflectance values (R = 0.68) with MCA6 reflectance factors overestimated over all waypoints. The remaining five bands show correlations 2 with R between 0.7 (722 nm) and 0.97 (661 nm). Overall, the MCA6 overestimates bands below the red edge, while it shows low deviations from the STS and the ASD derived reflectance values for the red edge bands. Due to the low number of data points the blue, green and red bands correlations need to be evaluated with caution. RGB and NIR camera: as can be seen in Table 4, the correlation between the RGB 2 and IR cameras results in an R of 0.9136, whereas the correlations to the high resolution spectrometers are as low as 0.6474 between the NIR camera and the ASD. The RGB camera and MCA6 are poorly correlated with a R 2 of 0.3773. 2 UAV spectrometer: with an R of 0.978, the UAV spectrometer strongly correlates to the reflectance derived from the ASD when compared over all waypoints. Even though the trend of the spectra is similar to the ASD ground truth, remarkable di◆erences are visible in the magnitude of the reflectance mainly in the near infrared.
Full Screen / Esc Printer-friendly Version Interactive Discussion
3848
|
Discussion Paper | Discussion Paper
25
BGD 11, 3837–3864, 2014
Comparative validation of UAV based sensors S. von Bueren et al.
Title Page Abstract
Introduction
Conclusions
References
Tables
Figures
J
I
J
I
Back
Close
|
20
Discussion Paper
15
|
10
Discussion Paper
5
the MCA6 is suitable for vegetation analysis while conservative application of bands with low spectral sensitivity must be recommended. Further investigation into sensor performance over targets with complex spectral behaviour must be conducted in order to evaluate spectral performance of those bands. The number of waypoints visited was not enough to fully validate the performance of the four lower MCA6 bands as can be seen in Fig. 6. Due to the statistical distribution of the data points, a definite statement on the performance of those bands is not possible. The empirical line method used for reflectance calibration introduces further errors because only one calibration image was acquired over the entire measurement procedure. Reflectance factor reliability can be improved by more frequent acquisition of calibration images. The UAV spectrometer delivered spectra with strong correlations to the ASD measurements. The calculation of narrow band indices or spectral fitting algorithms is thus possible. However, depending on the status of the vegetation target the ASD derived reflectance factors can be up to 1.5 times (Fig. 4) higher than the UAV spectrometer measurements. This result, particularly striking in the NIR, is somewhat unexpected, as Anderson et al. (2013) compared ground-based ASD and Ocean Optics instruments in their study and reported fairly good agreements. The main source of discrepancies between the ASD and STS measurements can be attributed to inconsistencies in footprint matching due to using a live feed from a camera that can only approximate the spectrometer’s field of view. Further intercomparison of the ASD and the particular Ocean Optics device employed on the UAV will be required in the future. RGB and NIR cameras: an empirical-line calibration was used for the reflectance factor estimation of both consumer RGB and infrared-modified cameras. Although correlations between the digital cameras and the high resolution spectrometers exist they must be treated with caution. This is due to the unknown radiometric response of the cameras and the inherent di◆erences between simple digital cameras and numerical sensors. Nevertheless, the results demonstrate the opportunities these low budget sensors o◆er for simple assessment of vegetation status over large areas using UAVs. If illumination conditions enable an empirical line calibration, reasonable three band re-
Full Screen / Esc Printer-friendly Version Interactive Discussion
3849
|
Discussion Paper | Discussion Paper
25
BGD 11, 3837–3864, 2014
Comparative validation of UAV based sensors S. von Bueren et al.
Title Page Abstract
Introduction
Conclusions
References
Tables
Figures
J
I
J
I
Back
Close
|
20
Discussion Paper
15
|
10
Discussion Paper
5
flectance results can be calculated. Those values then represent a solid data base for broad band vegetation indices such as the green NDVI (Gitelson et al., 1996) or the GRVI (Motohka et al., 2010). The empirical line method that was used for reflectance calibration was based on some simplifications. Variations in illumination and atmospheric conditions require frequent calibration image acquisitions in order to produce accurate radiometric calibration results. Due to conservative management of battery power and thus relatively short flight times, only one MCA6 flight was conducted to acquire an image of the calibration tarpaulins and the bare soil. The same restriction applies to the quality of the radiometric calibration of the RGB and IR camera. As shown in this study even after thorough calibration e◆orts, biases and uncertainties remain and must be carefully evaluated in terms of their e◆ects on data accuracy and reliability. Restrictions and limitations imposed by flight equipment must be carefully balanced with scientific data acquisition protocols. In field data acquisition and flight procedures: when acquiring data with UAVs, response time to changes in environmental conditions, such as increasing wind speeds and cloud presence, need to be near immediate. Although specifications from UAV 1 manufacturers attest the flying vehicles to be able to cope with winds of up to 30 km h , in reality the wind speed at which a flight must be interrupted is considerably lower. Platform stability, altitude control and footprint matching accuracy between sensors are compromised under high wind. Technical specifications of UAVs: both UAVs were powered with Lithium Polymer (LiPo) batteries. A fully charged battery enabled flying times of approximately ten minutes for the payload carried. With only four batteries available for each UAV, this lead to a data acquisition time frame of about 40 min per flying platform. However, because turbulences, unplanned take o◆s and landings or inaccurate GPS positions frequently required revisiting a waypoint, the total number of sample locations that could be investigated between 11 a.m. and 3 p.m. when illumination conditions were most favourable, was relatively low when compared to state of the art ground sensors such as the ASD.
Full Screen / Esc Printer-friendly Version Interactive Discussion
| Discussion Paper |
3850
Discussion Paper
25
BGD 11, 3837–3864, 2014
Comparative validation of UAV based sensors S. von Bueren et al.
Title Page Abstract
Introduction
Conclusions
References
Tables
Figures
J
I
J
I
Back
Close
|
20
Within this study it was shown that UAVs are rapidly evolving into an easy to use sensor platform that can be deployed to acquire vegetation data over large areas with minimal e◆ort. Four optical sensors were flown over ryegrass pastures and validated; including the first available UAV based micro spectrometer. The quality of the reflectance measurements was dependent on precise calibration of all sensors. Provided robust calibration and data acquisition processes are applied, ground reflectance data calculated from the four UAV based sensors correlated significantly. The novel high resolution STS spectrometer can now be regarded as a fully characterised stand-alone UAV spectrometer system, capable of reaching data quality in the range of an ASD. It was also demonstrated that the six band MCA6 camera can be used as an imaging spectrometer that can deliver multispectral imagery of high radiometric quality in the red edge region of the electromagnetic spectrum. Its performance and reliability over sample locations with low vegetation cover and strong background interference needs to be further evaluated. Individual filters must also be assessed, especially those covering the low regions of the electromagnetic spectrum. Any negative e◆ects that depreciate data quality, such as potentially unsuitable calibration targets (bare soil) need to be identified and further examined in order to guarantee highest quality data. The modi-
Discussion Paper
15
5 Conclusions
|
10
Discussion Paper
5
This makes thorough flight planning, marking of waypoints and ecient collection of ground reference data essential. Due to the non-availability of power outlets and the time it takes to fully recharge a LiPo battery, the battery life limits the time frame in which airborne data can be collected. At the time of the study, higher powered LiPo batteries were still too heavy thus neutralising a gain in flight time due to the high weight of the more powerful battery. Those restrictions can slow down data acquisition considerably and the number of ground sampling locations is limited. In the future, improvements in platform stability and electronics as well as higher powered batteries will enable larger ground coverage by UAVs.
Full Screen / Esc Printer-friendly Version Interactive Discussion
| Discussion Paper |
3851
Discussion Paper
25
Acknowledgements. The research was supported by a Massey University doctoral scholarship granted to S. von Bueren and a travel grant from COST ES0903 EUROSPEC to A. Burkart. The authors acknowledge the funding of the CROP.SENSe.net project in the context of Ziel 2Programms NRW 2007–2013 “Regionale Wettbewerbsfähigkeit und Beschäftigung (EFRE)” by the Ministry for Innovation, Science and Research (MIWF) of the state North Rhine Westphalia (NRW) and European Union Funds for regional development (EFRE) (FKZ 005-1012-0001) while collaborating on the preparation of the manuscript.
BGD 11, 3837–3864, 2014
Comparative validation of UAV based sensors S. von Bueren et al.
Title Page Abstract
Introduction
Conclusions
References
Tables
Figures
J
I
J
I
Back
Close
|
20
Discussion Paper
15
|
10
Discussion Paper
5
fied Canon infrared and the RGB Sony camera have proven to be easy to use sensors that deliver instant high resolution imagery covering a large spatial area. No spectral calibration has been performed on those sensors, but factory spectral information was accurate enough to allow converting digital numbers to a ground reflectance factor. Higher powered, lightweight batteries can allow for more frequent calibration image acquisition and the coverage of natural calibration targets, thus improving the radiometric calibration. The field protocols developed allow for straightforward field procedures and timely coordination of multiple UAV based sensors as well as ground reference instruments. The more autonomously the UAV can fly, the more focus can be laid on data acquisition. Currently, piloting the UAV in the field where obstacles are present, requires the full concentration of the pilot and at least one support person to observe the flying area. Due to technical restrictions, the total area that can be covered by rotary wing UAVs is still relatively small resulting in a point sampling strategy. Di◆erences in UAV specifications and capabilities lead to the UAVs having a specific range of applications that they can reliably fulfil. As such, the di◆erent UAV platforms and sensors each have their strengths and limitations that have to be managed by matching platform specifications to data acquisition requirements. In the future, the collection of large scale vegetation data will be feasible using UAV based imaging and numerical spectrometers.
Full Screen / Esc Printer-friendly Version Interactive Discussion
5
Discussion Paper |
3852
|
30
Discussion Paper
25
BGD 11, 3837–3864, 2014
Comparative validation of UAV based sensors S. von Bueren et al.
Title Page Abstract
Introduction
Conclusions
References
Tables
Figures
J
I
J
I
Back
Close
|
20
Discussion Paper
15
|
10
Aber, J. S., Aber, S. W., Pavri, F., Volkova, E., and Penner, R. L., II: Small-format aerial photography for assessing change in wetland vegetation, Cheyenne Bottoms, Kansas, Trans. Kansas Acad. Sci., 109, 47–57, doi:10.1660/0022-8443(2006)109[47:sapfac]2.0.co;2, 2006. Agati, G., Foschi, L., Grossi, N., Guglielminetti, L., Cerovic, Z. G., and Volterrani, M.: Fluorescence-based vs. reflectance proximal sensing of nitrogen content in Paspalum vaginatum and Zoysia matrella turfgrasses, Eur. J. Agron., 45, 39–51, doi:10.1016/j.eja.2012.10.011, 2013. Anderson, K., Rossini, M., Pacheco-Labrador, J., Balzarolo, M., Mac Arthur, A., Fava, F., Julitta, T., and Vescovo, L.: Inter-comparison of hemispherical conical reflectance factors (HCRF) measured with four fibre-based spectrometers, Opt. Express, 21, 605–617, doi:10.1364/oe.21.000605, 2013. Baugh, W. M. and Groeneveld, D. P.: Empirical proof of the empirical line, Int. J. Remote Sens., 29, 665–672, doi:10.1080/01431160701352162, 2008. Berni, J., Zarco-Tejada, P., Surez, L., González-Dugo, V., and Fereres, E.: Remote Sensing of Vegetation from UAV Platforms Using Lightweight Multispectral and Thermal Imaging Sensors, The International Archives of the Photogrammetry, Remote Sensing and Spatial Information Sciences, XXXVII, 2008. Berni, J., Zarco-Tejada, P. J., Suárez, L., and Fereres, E.: Thermal and narrowband multispectral remote sensing for vegetation monitoring from an unmanned aerial vehicle, IEEE T. Geosci. Remote, 47, 722–738, 2009. Burkart, A., Cogliati, S., Schickling, A., and Rascher, U.: A novel UAV-based ultralight weight spectrometer for field spectroscopy, IEEE Sens. J., 14, 62–67, doi:10.1109/jsen.2013.2279720, 2013. Carrara, M., Comparetti, A., Febo, P., and Orlando, S.: Spatially variable rate herbicide application on durum wheat in Sicily, Biosyst. Eng., 87, 387–392, 2004. Chávez, J. L., Pierce, F. J., Elliott, T. V., Evans, R. G., Kim, Y., and Iversen, W. M.: A remote irrigation monitoring and control system (RIMCS) for continuous move systems, Part B: Field testing and results, Precision Agriculture, 11, 11–26, 2010. Gitelson, A. A., Kaufman, Y. J., and Merzlyak, M. N.: Use of a green channel in remote sensing of global vegetation from EOS-MODIS, Remote Sens. Environ., 58, 289–298, 1996.
Discussion Paper
References
Full Screen / Esc Printer-friendly Version Interactive Discussion
3853
|
| Discussion Paper
30
Discussion Paper
25
BGD 11, 3837–3864, 2014
Comparative validation of UAV based sensors S. von Bueren et al.
Title Page Abstract
Introduction
Conclusions
References
Tables
Figures
J
I
J
I
Back
Close
|
20
Discussion Paper
15
|
10
Discussion Paper
5
Kelcey, J. and Lucieer, A.: Sensor correction of a 6-band multispectral imaging sensor for UAV remote sensing, Remote Sens., 4, 1462–1493, 2012. Kuusk, J.: Dark signal temperature dependence correction method for miniature spectrometer modules, J. Sensors, 2011, 608157, doi:10.1155/2011/608157, 2011. Lebourgeois, V., Bégué, A., Labbé, S., Mallavan, B., Prévot, L., and Roux, B.: Can commercial digital cameras be used as multispectral sensors? A crop monitoring test, Sensors, 8, 7300– 7322, 2008. Lebourgeois, V., Begue, A., Labbe, S., Houles, M., and Martine, J. F.: A light-weight multispectral aerial imaging system for nitrogen crop monitoring, Precis. Agr., 13, 525–541, doi:10.1007/s11119-012-9262-9, 2012. Lelong, C. C. D., Burger, P., Jubelin, G., Roux, B., Labbe, S., and Baret, F.: Assessment of unmanned aerial vehicles imagery for quantitative monitoring of wheat crop in small plots, Sensors, 8, 3557–3585, doi:10.3390/S8053557, 2008. Motohka, T., Nasahara, K. N., Oguma, H., and Tsuchida, S.: Applicability of green-red vegetation index for remote sensing of vegetation phenology, Remote Sens., 2, 2369–2387, 2010. Primicerio, J., Di Gennaro, S. F., Fiorillo, E., Genesio, L., Lugato, E., Matese, A., and Vaccari, F. P.: A flexible unmanned aerial vehicle for precision agriculture, Precis. Agric., 13, 517–523, doi:10.1007/s11119-012-9257-6, 2012. Pullanagari, R. R., Yule, I. J., Hedley, M. J., Tuohy, M. P., Dynes, R. A., and King, W. M.: Multispectral radiometry to estimate pasture quality components, Precis. Agric., 13, 442–456, doi:10.1007/s11119-012-9260-y, 2012. Seelan, S. K., Laguette, S., Casady, G. M., and Seielstad, G. A.: Remote sensing applications for precision agriculture: a learning community approach, Remote Sens. Environ., 88, 157– 169, 2003. Smith, G. M. and Milton, E. J.: The use of the empirical line method to calibrate remotely sensed data to reflectance, Int. J. Remote Sens., 20, 2653–2662, doi:10.1080/014311699211994, 1999. Sta◆ord, J. V.: Implementing precision agriculture in the 21st century, J. Agr. Eng. Res., 76, 267–275, 2000. Van Alphen, B. and Stoorvogel, J.: A methodology for precision nitrogen fertilization in highinput farming systems, Precis. Agric., 2, 319–332, 2000. Zanoni, V., Davis, B., Ryan, R., Gasser, G., and Blonski, S.: Remote Sensing Requirements Development: a Simulation-Based Approach, ISPRS, 2002.
Full Screen / Esc Printer-friendly Version Interactive Discussion
Discussion Paper
5
|
Zarco-Tejada, P., González-Dugo, V., and Berni, J.: Fluorescence, temperature and narrowband indices acquired from a UAV platform for water stress detection using a microhyperspectral imager and a thermal camera, Remote Sens. Environ., 117, 322–337, doi:10.1016/j.rse.2011.10.007, 2011. Zhang, C. and Kovacs, J. M.: The application of small unmanned aerial systems for precision agriculture: a review, Precis. Agric., 13, 693–712, doi:10.1007/s11119-012-9274-5, 2012. Zhang, N. Q., Wang, M. H., and Wang, N.: Precision agriculture – a worldwide overview, Comput. Electron. Agr., 36, 113–132, doi:10.1016/s0168-1699(02)00096-0, 2002.
BGD 11, 3837–3864, 2014
Discussion Paper
Comparative validation of UAV based sensors S. von Bueren et al.
Title Page Introduction
Conclusions
References
Tables
Figures
J
I
J
I
Back
Close
|
Abstract
Discussion Paper | Discussion Paper |
3854
Full Screen / Esc Printer-friendly Version Interactive Discussion
Discussion Paper |
Falcon-8
Manufacturer Weight [g] Max. Payload [g] Power source Endurance [min] GPS navigation Features Sensors
MikroKopter 1900 1000 LiPo, 4200 mAh, 14.8 V 12 Ubloxx LEA 6 s GPS chip Open Source Gyro-stabilized camera mount MCA6, Canon IR
Ascending Technologies 1800 500 Lipo, 6400 mAh, 11.1 V 15 min Yes Stabilized camera mount, live video link, motor redundancy Spectrometer, RGB, Canon IR
Discussion Paper
QuadKopter
| Discussion Paper |
3855
11, 3837–3864, 2014
Comparative validation of UAV based sensors S. von Bueren et al.
Title Page Abstract
Introduction
Conclusions
References
Tables
Figures
J
I
J
I
Back
Close
|
Name
Discussion Paper
Table 1. UAV platforms.
BGD
Full Screen / Esc Printer-friendly Version Interactive Discussion
Discussion Paper |
Canon Powershot IR
MCA6
STS
Sony – modified RGB camera integrated in the Falcon-8 UAV
Canon – modified VIS + Infrared camera
Field of View Spectral bands Spectral range Spatial Resolution Dynamic Range Weight [g] Handling
73.7 ⇥ 53.1 3 Blue, Green, Red 4912 ⇥ 3264 8 bit 500 Wireless trigger, live view
Zoom lens 3 Blue, Green, IR 4000 ⇥ 3000 8 bit 100 Interval mode
Tetracam Multispectral Imager with 6 bands of 10 nm width 38.3 ⇥ 31.0 6 450–1000 nm 1280 ⇥ 1024 10 bit 790 Interval mode
Ocean Optics – modified Hyperspectrometer, with additional electronics for remote control 12 256 338–824 nm single point 14 bit 216 Wireless trigger
Discussion Paper
Sony Nex5n RGB
Company Type
| Discussion Paper |
3856
11, 3837–3864, 2014
Comparative validation of UAV based sensors S. von Bueren et al.
Title Page Abstract
Introduction
Conclusions
References
Tables
Figures
J
I
J
I
Back
Close
|
Name
Discussion Paper
Table 2. Sensor properties.
BGD
Full Screen / Esc Printer-friendly Version Interactive Discussion
Discussion Paper | Discussion Paper
Table 3. MCA6 filter specifications. Slave 2
Slave 3
Slave 4
Slave 5
473 64.37
551 72.54
661 61.4
693 66.89
722 63.63
831 65.72
Discussion Paper
Master
| Discussion Paper |
3857
11, 3837–3864, 2014
Comparative validation of UAV based sensors S. von Bueren et al.
Title Page Abstract
Introduction
Conclusions
References
Tables
Figures
J
I
J
I
Back
Close
|
Centre wavelength FWHM (nm) Peak transmission (%)
Slave 1
BGD
Full Screen / Esc Printer-friendly Version Interactive Discussion
Discussion Paper |
R
2
IR
1 0.9136 0.3773 0.6807 0.6736
1 0.9452 0.8906 0.6474
MCA6
OO UAV
11, 3837–3864, 2014
Comparative validation of UAV based sensors S. von Bueren et al.
Title Page Abstract
Introduction
Conclusions
References
Tables
Figures
J
I
J
I
Back
Close
|
1 0.8259 0.9242
1 0.9777
Discussion Paper
RGB IR MCA6 OO UAV ASD
RGB
Discussion Paper
Table 4. Correlation matrix for the optical sensors.
BGD
| Discussion Paper |
3858
Full Screen / Esc Printer-friendly Version Interactive Discussion
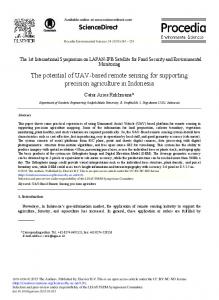
Fig. 1: UAV based sensors: [a] Sony Nex5n RGB camera [b] Canon PowerShot IR camera
454
[c] MCA6 multispectral camera [d] Spectrometer.
Discussion Paper
453
BGD 11, 3837–3864, 2014
| Discussion Paper
Comparative validation of UAV based sensors S. von Bueren et al.
Title Page Introduction
Conclusions
References
Tables
Figures
J
I
J
I
Back
Close
|
Abstract
Discussion Paper
455
| Fig. 1. UAV based sensors: (a) Sony Nex5n RGB camera (b) Canon PowerShot IR camera (c) MCA6 (d)ofSpectrometer. 457 multispectral Fig. 2: Spectralcamera sensitivity the four sensors. Spectral bands are indicated by different colors.
|
3859
Discussion Paper
456
Full Screen / Esc Printer-friendly Version Interactive Discussion
Discussion Paper
455 456 Fig. 2: Spectral sensitivity of the four sensors. Spectral bands are indicated by different colors.
|
457
BGD 11, 3837–3864, 2014
Discussion Paper
Comparative validation of UAV based sensors S. von Bueren et al.
Title Page Introduction
Conclusions
References
Tables
Figures
J
I
J
I
Back
Close
|
Abstract
Discussion Paper
458 Fig. 4592. Spectral sensitivity of the four sensors. Spectral bands are indicated by di◆erent colors.
| |
3860
Discussion Paper
18
Full Screen / Esc Printer-friendly Version Interactive Discussion
Discussion Paper
BGD 11, 3837–3864, 2014
| Discussion Paper
Comparative validation of UAV based sensors S. von Bueren et al.
Title Page Introduction
Conclusions
References
Tables
Figures
J
I
J
I
Back
Close
|
Abstract
Discussion Paper |
465
Fig. 3. Raw data from the imaging sensors (a) RGB camera at 100 m altitude, (b) IR camera at 100 m altitude, (c) MCA6 at 25 m altitude. The pictures show the region of interest cropped from a larger image. White points represent the tarpaulin waypoint markers. As is evident in the MCA6 raw image, alignment between the six cameras is necessary and must be matched to the flying height.
Discussion Paper
3861
|
20
Full Screen / Esc Printer-friendly Version Interactive Discussion
Fig. 4: Reflectance of the spectral sensors ASD (black), MCA6 (blue) and UAV OO (red) as
Discussion Paper
467
measured over the exemplary waypoints 2 and 8. SD is shown for the hyperspectral sensors in
|
468
dotted lines and for the 6 bands of the MCA6 in error bars.
Discussion Paper
466
BGD 11, 3837–3864, 2014
Comparative validation of UAV based sensors S. von Bueren et al.
Title Page Introduction
Conclusions
References
Tables
Figures
J
I
J
I
Back
Close
|
Abstract
472
dotted lines and for the 6 bands of the MCA6 in error bars.
showing data over all eight sample locations and spectra (MCA6 n=48, STS n=120). MCA6
474
(red): R2=0.98, slope of linear regression: 0.6522, offset: 0.0142.
|
3862
Discussion Paper
vs. ASD (blue): R2=0.92, slope of linear regression: 0.6691, offset: 0.0533. STS vs. ASD
|
473
Discussion Paper
469 470 Fig. 4. Reflectance of the spectral sensors ASD (black), MCA6 (blue) and UAV OO (red) as over the exemplary waypoints and 8. SD isto shown for theASD hyperspectral sensors in 471 measured Fig. 5: Reflectance comparison of UAV 2based sensors convolved derived reflectance
Full Screen / Esc Printer-friendly Version Interactive Discussion
469 470 Fig. 5: Reflectance comparison of UAV based sensors to convolved ASD derived reflectance
472
showing data over all eight sample locations and spectra (MCA6 n=48, STS n=120). MCA6
473
vs. ASD (blue): R2=0.92, slope of linear regression: 0.6691, offset: 0.0533. STS vs. ASD
474
(red): R2=0.98, slope of linear regression: 0.6522, offset: 0.0142.
Discussion Paper
471
BGD 11, 3837–3864, 2014
| Discussion Paper
Comparative validation of UAV based sensors S. von Bueren et al.
Title Page Introduction
Conclusions
References
Tables
Figures
J
I
J
I
Back
Close
|
Abstract
Discussion Paper | |
3863
Discussion Paper
475 Fig. 5. Reflectance comparison of UAV based sensors to convolved ASD derived reflectance 476 showing data over all eight sample locations and spectra (MCA6 n = 48, STS n = 120). MCA6 vs. ASD (blue): R 2 = 0.92, slope of linear regression: 0.6691, o◆set: 0.0533. STS vs. ASD (red): 2 21 R = 0.98, slope of linear regression: 0.6522, o◆set: 0.0142.
Full Screen / Esc Printer-friendly Version Interactive Discussion
Fig. 6: Comparison of reflectance values between MCA6 and convolved ASD reflectance for
478
each MCA6 band. 473nm: R2=0.93, regression slope (RS): 0.9783. 551nm: R2=0.68, RS:
479
.1.0654. 661nm: R2=0.97, RS:1.311, 693nm: R2=0.95, RS:1.0225, 722: R2=0.7, RS: 0.4009,
480
831: R2=0.8, RS: 0.4516.
Discussion Paper
477
BGD 11, 3837–3864, 2014
| Discussion Paper
Comparative validation of UAV based sensors S. von Bueren et al.
Title Page Introduction
Conclusions
References
Tables
Figures
J
I
J
I
Back
Close
|
Abstract
Discussion Paper | |
3864
Discussion Paper
481 Fig. 6. Comparison of reflectance values between MCA6 and convolved ASD reflectance for each MCA6 band. 473 nm: R 2 = 0.93, regression slope (RS): 0.9783. 551 nm: R 2 = 0.68, RS: 1.0654. 661 nm: R 2 = 0.97, RS:1.311, 693 nm: R 2 = 0.95, RS: 1.0225, 722: R 2 = 0.7, RS: 0.4009, 831: R 2 = 0.8, RS: 0.4516.
Full Screen / Esc Printer-friendly Version Interactive Discussion