used for timing, use results only for those runs for which CPU usage is near 100%. RULE OF THUMB 13: Monitor computer use during testing. Memory usage ...
Comparing Algorithms: Rules of Thumb and an Example S. Balakirsky, T. R. Kramer National Institute of Standards and Technology Gaithersburg, MD 20899 ABSTRACT This paper provides twenty rules of thumb for comparing algorithms having the same function, one of which is to be selected for use in an intelligent system. The rules are illuminated by a specific example, the comparison of three algorithms for dealing with the collection of open nodes that is at the heart of the Dijkstra graph search method. For each rule, a description is given of how the rule was applied in building the example.
KEYWORDS: algorithm, binary tree, compare, Dijkstra, graph, jump search, list, run time, search
1.
INTRODUCTION
To produce intelligent behavior, most intelligent systems include computer implementations of one or more complex algorithms. Often a comparison must be done to support making a choice among algorithms performing the same function. This paper1 provides a set of rules of thumb for comparing algorithms having the same function. The rules given here are elementary. Most readers will already know many or all of them. The paper also presents a specific example of comparing algorithms. The example is intended to highlight the utility of following the rules. Our purposes are to help builders of intelligent systems make better decisions among competing algorithms and to encourage caution and thoroughness in comparing algorithms. Section 2 gives our rules of thumb for comparing algorithms for use in an intelligent system. Section 3 presents the example, comparing algorithms for dealing with open nodes in Dijkstra graph search. Section 4 discusses how the rules were used in the example. Section 5 gives the paper’s conclusion.
2.
RULES OF THUMB
RULE OF THUMB 1: Compare algorithms both in theory and in practice. Algorithms may be compared using theory (by examining how they work) or using experimentation (by examining the behavior of a system running an implementation 1. Certain commercial equipment, instruments, or materials are identified in this paper in order to facilitate understanding. Such identification does not imply recommendation or endorsement by the National Institute of Standards and Technology, nor does it imply that the materials or equipment identified are necessarily the best available for the purpose.
of the algorithm). Both methods should be used. Theory directs experimentation, but reality is sufficiently more complex than theory that it is naive to rely on theory alone.
2.1 Comparing Algorithms in Theory RULE OF THUMB 2: Do a big O analysis. Theoretical analysis of the running time of algorithms is a mainstream activity of computer science. The well-known idea [7], [11] is to identify the “big O” order of the time a program will take as a function of the size of the problem being solved. The difficulty of doing this ranges from fairly easy to impossible. A theoretical analysis can never guarantee an algorithm will work well, but if it indicates the algorithm should work badly for large problems (by running in order 2N time, for example, where N quantifies the size of the problem under consideration), one can be quite sure it will work badly. Depending on the application, it may be appropriate to do a worst-case analysis, an average behavior analysis, or both. If the order of time taken, T, is O(F(N)) for some function F, this means, T = K(F(N)) for some constant K. The constant of proportionality, K, is constant only for a given computer, compiler, and operating system. If the usual assumption of a one-tier memory model (only RAM) is made, K may still fail to be constant. As pointed out in [8], modern computers generally have a multi-level memory hierarchy, including at least cache, RAM, and disk. Cache memory may be up to ten times as fast as RAM, and disk memory may be 1000 times as slow. Thus, K will actually be a constant only if the characteristics of memory handling do not change over the range of N being tested. RULE OF THUMB 3: Do a functional analysis. A functional analysis is an analysis of how the algorithm works — what the main routine does, what the subroutines are and what they do, etc. This is a harder, one-off activity, usually requiring understanding of a large body of source code or pseudocode and the language in which it is written. Here again, only negative guarantees are available; if it does not work in theory, it won’t work in practice. RULE OF THUMB 4: Identify dimensions of the domain space. Typically, the problem domain an algorithm addresses will have several independent aspects that affect the functioning of the algorithm. These aspects can be used as the dimensions of a domain space. Some aspects, such as problem size, may be effectively continuous, while others may have continuous segments divided by discontinuities or may be discrete. RULE OF THUMB 5: Identify regions of interest in the domain space. Also typically, only a limited part of a domain space will be of interest. The portion of interest may be
bounded either naturally (by discontinuities in the dimensions of the space), or synthetically (by picking limits along continuous dimensions). It is important to identify the regions of interest because algorithms may, and almost always do, perform qualitatively differently in different parts of the space. In this paper, we use the term “sea change” to mean a qualitative change in the functioning of an algorithm in different parts of the domain space. RULE OF THUMB 6: In the functional analysis, consider all regions of interest in the domain space. A functional analysis will not be complete unless it identifies (i) what is qualitatively different in different parts of the domain space where the algorithm is intended to work, and (ii) how qualitative differences in the part of the domain space affect the performance of the algorithm. RULE OF THUMB 7: Get the source code. While natural language and pseudocode versions of algorithms can be analyzed, the analysis is likely to miss key points if it is not done on the source code, the first key point being: does the code implement the algorithm correctly. Without having the code in hand, it cannot be debugged, modified, or recompiled.
2.2 Comparing Algorithms in Practice Where theoretical analysis is not well-developed, only experimentation is available to compare algorithms. Even where a theoretical analysis of algorithm performance is available, it cannot reveal how an implementation will perform. An abstract algorithm does not run on an abstract machine. An implementation of the algorithm in a specific computer language, compiled by a specific compiler (or interpreted by a specific interpreter) for a specific machine architecture is what runs. And it runs on a specific piece of computer hardware, under control of a specific operating system, possibly depending on a specific file server connected by a specific communications system. Each of these items can affect the performance of an algorithm [6], [8]. RULE OF THUMB 8: Determine what is to be optimized, and test that. This is obvious but ranges from easy to nearly impossible in practice. Algorithms that return an answer guaranteed to be optimal for a well-defined single measure (least cost, for example) provide the easy cases. In hard cases (computer vision has them), it is difficult even to characterize what one is trying to optimize. There may be trade-offs among optimizing several aspects of performance: average performance vs. worst-case performance, minimizing bad results vs. maximizing good ones, minimizing running time vs. maximizing answer quality, falling off a cliff at domain region boundaries vs. sliding down gradually, etc. RULE OF THUMB 9: In experiments, keep the number of variable factors to a minimum. This is a main tenet of standard experimental procedure, which should be followed insofar as possible. Keep all conditions but one the same between tests, changing only one factor at a time. In particular, when comparing two algorithms, to the extent possible: 1. Implement them in the same computer language. 2. Compile them on the same compiler, using the same compiler settings.
3. Run them on the same computer. 4. Test them under similar conditions of computer usage. If it is known what computer the algorithm will be running on as part of the complete intelligent system, that is the computer that should be used for testing. Otherwise, the same tests should be repeated on each computer that might be used in the full system. RULE OF THUMB 10: Conduct one or more series of tests that are ordered by size but have the same values in other dimensions. If problem size is variable in an application, it usually varies continuously. The range of sizes should match the range presented by the regions of interest in the domain space, if that is known. When such a series of tests is conducted, if theory indicates there are no sea changes in system behavior across the range of sizes, test results (such as time) should lie on a smooth curve of some sort when the results are plotted on a graph showing problem size on one axis and results on the other axis. If there is a kink in the curve where theory does not predict a sea change, double-check the theoretical analysis and/or run the same tests on a different computer. If the kink is not found on a second computer, the cause of the kink lies somewhere in the first computer. RULE OF THUMB 11: Conduct identical tests on substantially different computers. If the same tests can be run on substantially different computers, and the ratio of the times taken by the two computers is nearly constant across tests, this is (mushy) evidence that the system operating regimes are not undergoing sea changes between tests. If one of the computers behaves qualitatively differently between two tests, it is unlikely that the second computer will have a sea change at the same point. RULE OF THUMB 12: Conduct tests with the computer lightly loaded. The two most significant measures of load on the computer are memory usage and CPU usage. If RAM memory is not lightly loaded, the operating system will use secondary memory with the effect, according to [8], that “memory access times can vary by factors as large as a million” in the worst case. The same paper observes that because of memory effects, “[predicted] running times that are off by three orders of magnitude are not unusual.” Reduce the number of processes competing for time as far as possible while testing. For example, do not run two tests simultaneously. Ideally, while many processes will inevitably be resident on the test computer, only the process being tested should use any significant amount of CPU time. The Unix “time” command, for example, shows the percentage of CPU time used by the process that was timed. If this command is used for timing, use results only for those runs for which CPU usage is near 100%. RULE OF THUMB 13: Monitor computer use during testing. Memory usage per process on Sun computers1 and other computers using unix-like operating systems may be checked with top or ps. Top also shows total memory usage.
1. In this paper, “Sun computer” means a Sun computer running the Solaris operating system (which is unix-like).
Memory usage per process and in total on PC’s1 may be checked using the Windows Task Manager. CPU usage for a process may be checked on computers using unix-like operating systems with the top and time commands. Top also shows total CPU usage. On PC’s, a performance meter is available inside the Windows Task Manager (and in a stand-alone process) that will show total CPU usage. On PC’s the Windows Task Manager will show CPU usage per process. Monitoring processes are designed to use minimal computer resources, so having them running while testing will probably not interfere with testing. Some monitoring processes (top, for example) show what resources they themselves are using. If it is suspected that a monitoring process is using significant resources, run a timing test with the monitor on, then run the same test with the monitor off and compare results. RULE OF THUMB 14: Conduct tests with the computer realistically loaded. Conducting tests with the computer lightly loaded should always be done, but a light load may not be possible in the full system. If the load on a computer running the full system is known, conduct tests under those load conditions. Where performance changes dramatically between lightly loaded and realistically loaded conditions, consider reconfiguring the full system. RULE OF THUMB 15: Understand the effects of the test harness and compensate for them. The algorithm being tested will have interfaces to the rest of the full system and may require data structures to exist. To test without the full system, a test harness is built, typically in the form of computer code for a driver including a main routine and routines to set up data. If the full system normally builds data structures while it runs, as opposed to building them by reading a file, it may be necessary to define a file format and have file-reading code in the driver. When tests are run using the harness, some time will be used by the driver code. If time to do the same functions is not required by the full system, that time should be diluted or subtracted in analyzing test results. Typically, a test harness will consume a significant amount of time primarily when it starts up (for file reading, for example), and possibly when it shuts down. RULE OF THUMB 16: Use representative test cases. The test cases used should be typical of the region of domain space for which an algorithm is being tested. If possible, harvest test cases from data acquired during intelligent system operation. It is very rare for a test case generator to exist that is guaranteed to produce test cases that satisfy some metric for representativeness. Producing representative test cases typically requires both establishing criteria for representativeness and conducting secondary experiments on candidate test cases to see how well they meet the criteria. RULE OF THUMB 17: Use standard test case sets, if available and appropriate. In some domains, standard sets of test cases may be available. Even where these are available, care is needed in deciding if they are really in the proper domain region and, if so, whether they are adequately representative. 1. In this paper, “PC” means a PC running an MS Windows operating system.
A common pitfall with test cases is that an algorithm is tuned for a specific set of test cases that are not adequately representative of the domain region. When further testing is done or the full system is built and run, performance is significantly lower than expected. Where no good metric for representativeness exists, the only solution for this problem may be to use very large sets of test cases. RULE OF THUMB 18: Collect secondary data showing what the algorithm is doing internally. This is useful for: 1. verifying that data which should be the same between two algorithms or implementations is the same. 2. verifying that an algorithm is doing in practice what it should be doing in theory. 3. tuning the algorithm for better performance. 4. understanding where the algorithm is spending the majority of its time. This is at the border between testing and debugging. If an algorithm is not doing what the tester thinks it should be doing, either the tester is confused or there is a bug in the code or the algorithm itself. RULE OF THUMB 19: Deal with measurement error. Another obvious rule. This is like “check the hull for leaks” in that checking any one spot is easy, but there may be a lot to check, and if you miss one spot, the boat sinks. Deciding between algorithms does not usually require high precision or high accuracy; getting measurements within 10% to 20% overall is probably good enough. Where components of error are additive, of course, the error in an individual component needs to be lower. Quick checks should be applied to measuring tools such as the time or top command or a performance monitor. Things that measure time can be double-checked against clocks or watches. Where more than one tool is available, use both and compare. For example, CPU usage on a Sun computer is given both by time and top. Much of the data taken by computer tools such as top and performance monitors is an average over some time period, and one should be aware of this when using those tools. For example, performance monitor plots may show CPU usage ramping up over a few seconds, staying level for a long time, and then ramping down again. The ramps are almost certainly not real. What is actually happening is a quick jump from low to high when a process starts and a jump back to low when the process ends. The ramps (which help the eye follow the curve) are artifacts of using a rolling time average. The real life span of the process is probably from the beginning of the ramp up to the beginning of the ramp down. Performing repeatability tests is very useful. The total variation in a repeated test contains at least three components, each of which has random and systematic parts: 1. variation caused by differences in the internal computer environment between tests. 2. errors in the tools used to take the measurements. 3. errors in reading the measurements provided by the tools. Although equal and opposite random errors are possible in theory, they are unlikely to occur repeatedly in practice. If the variation between repeated measurements is small in every
case, it is nearly certain that all three components of random error are small. If possible, adjust test procedures so that variations in repeated tests are small compared with the quantity being measured. RULE OF THUMB 20: At widely separated times, repeat tests performed earlier. Repeating old tests will help catch systematic errors that vary slowly over time.
3.
Example
Many systems may use a graph search algorithm. In building planning systems for domains as diverse as autonomous vehicles [3] and automated atom assembly, researchers at NIST have been using Dijkstra graph search [5]. This finds a least cost path (if there is any path) between any two nodes in a directed graph. In previously reported work [4], we compared three implementations of the Dijkstra algorithm. We were aware that even the best of these three (which we will call List) could be improved by implementing faster methods of using the collection of open nodes that is at the heart of Dijkstra graph search. List maintains the open nodes in a linked list arranged in increasing cost order. List uses linear search for removing and reinserting nodes whose cost changes. We implemented two algorithms embodying more efficient methods of dealing with the open nodes. The first of these also keeps the open nodes in a list but is a form of jump search [10] that overlays the list with more structure; the system that uses it we call Tabs. The second uses a type of binary tree for the open nodes [1], [2], [12], and the system using it we call AVL. We ran a series of tests on List, Tabs, and AVL and compared them. This paper uses that comparison as an example. Test data and descriptions of the tests are given here. Details of the algorithms are given in a separate, not yet published paper. The three implementations all produce the same results in theory, and the results are guaranteed to be optimal (measured by least cost). Theoretical analyses of average time for removal and insertion operations on the collection of open nodes are straightforward. They show average times of O(M) for List, O(sqrt(M)) for Tabs, and O(log(M)) for AVL, where M is the size of the open nodes collection. As discussed in [9], however, the theoretical average time of graph search is generally computable (with difficulty if at all) only for well-characterized graphs over which the average is to be taken. In order to apply the average time equations just given, we need to know how M varies during operation, on the average, for a given number of nodes N, and this depends heavily on the characteristics of the test graphs. The test graphs we used are well-characterized as follows, but we do not have average time equations for nodeto-node searches in graphs with these characteristics. The sets of test graphs have the following characteristics: 1. In each set, each graph has twice as many nodes as the preceding graph. 2. In each set, the number of arcs leaving a node is fixed; one set has 16 arcs from each node, the other 2 arcs from each node. 3. The cost of each arc is a randomly chosen positive integer less than 50.
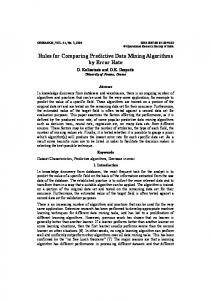
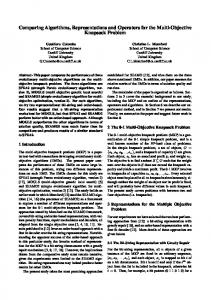
4. The node at the end of the each arc is randomly chosen, except that the node at the end must differ from the node at the beginning, and for a given beginning node, the end nodes must all differ. 5. Each graph is not necessarily completely connected. Although we do not have big O equations for expected behavior, we knew from our functional analysis of the algorithm that nearly all of the processing time is spent in removing nodes from the open nodes collection and inserting nodes back into this collection. It was also clear that the average M gets bigger as N gets bigger. Thus, since M/sqrt(M) and M/ log(M) increase rapidly with M, we expected Tabs and AVL to outperform List by increasing margins as N increases. Since sqrt(M)/log(M) increases as M increases, we also expected that for sufficiently large N, AVL would be faster than Tabs. We ran tests first on a Sun Ultra 60 and then on a Pentium 4 class PC. Both computers have 512 megabytes of RAM memory. The PC is at least 5 years newer, so we expected it both to run faster and to do more active memory management. The results for the Sun are shown for branching factor 16 in Figure 1, and for branching factor 2 in Figure 2. Rather than showing times for the three algorithms, the graphs show the ratio of the time taken by List to the time taken by AVL and the ratio of the time taken by List to the time taken by Tabs. The basic reason for using the ratio is because we are comparing algorithms, and using the ratio washes out the effects of using a specific problem, leaving only the effects of the algorithms. Further discussion is given in Section 4. As shown in the figures, our expectations were correct. AVL and Tabs both outperform List by increasing margins as N increases and AVL outperforms Tabs by an increasing margin when N is more than 8000. Smooth curves fit the data very closely, implying that for both sets of test cases, there was no sea change in the behavior of the Sun over the range of graph sizes we used. Figure 3 shows a comparison of speed on the sun versus speed on the PC. Since the same source code was used on the Sun and the PC, we expected that, in the absence of a sea change in behavior of the PC at some point, the speed ratios would be roughly constant over the range of problem sizes and that the ratio would be about the same for all three systems. Figure 3 shows that this was the case for AVL and Tabs, but not for List. Further discussion is given in Section 4. From the functional analyses of the three systems, we expected the search time taken by each implementation to be almost proportional to the number of comparisons performed. This is because, except for the main loop, most of the code consists of loops or recursive function calls in which the number of repetitions depends on a comparison, and the other operations that execute during a repetition are always the same for the code segment performing the repetition. List has the fewest other operations per comparison, while AVL has the most, so we expect comparisons per second to decrease from List to Tabs to AVL. As shown in Table 1 below, the data for branching factor 16 largely bear this out. For each of the three systems and four test cases, the table shows the time taken on the Sun computer to find the answer and the number of comparisons made while finding the answer. The times taken on the PC differed, but the numbers of comparisons did not.
Relative Speed
Relative Speed
29
8
28
7
27
6
26
5
25
4
24
3 KEY
23
2
AVL
22
KEY AVL Tabs
1
Tabs
List
21 2-1 20 2-1 20
21
22
23
24
25
26
21
27
22
23
25
26
27
Thousands of Nodes
Thousands of Nodes
Figure 3. Speed on PC Relative to Speed on Sun, for Branching Factor 16
Figure 1. Speed Relative to List for Branching Factor 16, Sun
Relative Speed 28
Table 1: Data for Branching Factor 16, Sun nodes →
27
type↓
26
AVL seconds 0.0111 0.0605
25
1000
4000
KEY AVL
22
List
64000 1.64
458,585
2,392,759
0.334
4.56
comps 34,841 247,648
1,899,736
22,214,824
seconds 0.0694 1.31
22.7
693
Tabs seconds 0.00836 0.0515
23
16000 0.268
comps 20,167 108,812
24
Tabs comps 523,530 9,338,357 130,440,329 2,417,260,900
21 2-1 20
24
21
22
23
24
25
26
27
Thousands of Nodes
Figure 2. Speed Relative to List for Branching Factor 2, Sun Computer
4.
How the Example Used the Rules
RULE OF THUMB 1: Compare algorithms both in theory and in practice. This was done, as described in Section 3. RULE OF THUMB 2: Do a big O analysis. This was attempted as described in Section 3. RULE OF THUMB 3: Do a functional analysis. We studied the functioning of the algorithms for handling the collection of open nodes. The functional analysis did not reveal any characteristics of the algorithms that would be expected to produce sea changes in the regions of graph space of interest. RULE OF THUMB 4: Identify dimensions of the domain space. We were not focused on a specific application for this work, so we looked at the characteristics of abstract directed graphs (what the Dijkstra algorithm deals with). Following Rule of Thumb 10, we used problem size as one dimension. In our earlier paper, [4] on testing implementations of the Dijkstra algorithm, the functional analysis indicated that versions that keep the list of open nodes in cost order will differ from versions that do not keep the list in order. This difference appeared when the branching factor of the graph (how many arcs leave each node) was used as a dimension of the domain space. We continued to use the branching factor as a dimension in the tests reported in this paper, even though we did not expect to see significantly different behavior on this dimension. RULE OF THUMB 5: Identify regions of interest in the domain space. In automated atom assembly, we have dealt with graphs having 62 to 437,582 nodes using Dijkstra search. Other applications have not had as large an upper bound. The limits of our testing were within a somewhat narrower range: 500 to 128,000 nodes. RULE OF THUMB 6: In the functional analysis, consider all regions of interest in the domain space. As already described, the region of interest was in graph space and was all one piece. It did not have qualitatively different parts. RULE OF THUMB 7: Get the source code. This was easy, since we wrote the code. RULE OF THUMB 8: Determine what is to be optimized, and test that. The Dijkstra algorithm does not halt until an optimum (least cost) answer is found. We accepted optimizing cost, as provided by the algorithm in its usual form. Since there is no way to predict the cost of the answer before the search is conducted, it is not possible to stop the search when a 120% optimum cost (or whatever fraction or margin) solution is found. The Dijkstra algorithm could readily be modified either to stop at some point between finding the first answer and finding an optimal answer or to keep going after finding the first optimal answer until all equally optimal answers have been found, but we did not do this.
RULE OF THUMB 9: In experiments, keep the number of variable factors to a minimum. Our tests included three variable factors: the computer (Sun or PC), branching factor of the graph (2 or 16), and problem size (500 to 128,000 nodes). In the range 1000 to 64,000 nodes, the 3-dimensional test space has all data points lying on lines for which two of the three variables are constant. For example, as shown in Figure 1, the computer and the branching factor were held constant while problem size was varied. To reduce variable factors in the source code, we remodularized the code. We placed the code defining a graph, a node, and a Dijkstra search node in the file dijk.hh and used this file in building each of the three systems. We built the test harnesses for AVL and Tabs by copying the harness for List and changing a very few lines. RULE OF THUMB 10: Conduct one or more series of tests that are ordered by size but have the same values in other dimensions. Two series of tests in increasing size order are shown in Figure 1 and Figure 2 for the Sun Computer. The same tests were run on a PC and used for building Figure 3. RULE OF THUMB 11: Conduct identical tests on substantially different computers. We ran the same test cases on both a Sun and a PC. These are known to be substantially different. Figure 3 shows that for Tabs and AVL, the ratio of the speed of the PC to the speed of the Sun is almost constant over the range of sizes tested for branching factor 16. Tabs runs about 6.6 times as fast on the PC. AVL runs about 6.0 times as fast on the PC. For List, the ratio is not constant, decreasing by a factor of about 2 over the same range. This appears to indicate a sea change in the behavior of the PC over this range. Since we expected more active manipulation of memory on the PC, but we determined that secondary memory is not being used, we hypothesize that the sea change is caused by a difference in the use of cache memory between the smaller and larger problems. We have not tried to verify this. If figures similar to Figure 1 and Figure 2 were drawn for the PC, they would not have the nice appearance of those figures because the algorithm comparison would be confounded by the sea change in computer behavior. If we had tested only on the PC, we would have had a very hard time determining whether the algorithm or the computer was responsible. RULE OF THUMB 12: Conduct tests with the computer lightly loaded. For both Sun and PC, we made sure no processes were running that would compete significantly for system resources. While any test was in progress we did not move the mouse or touch the keyboard. The following observations establish that both computers were always lightly loaded during tests. RULE OF THUMB 13: Monitor computer use during testing. On the Sun, we monitored with both time and top that the test process was using almost all of the CPU. When testing on the Sun, we recorded results only when CPU usage was at least 98% according to the results provided by the time command.
On the PC we used the Task Manager and/or the performance monitor to monitor CPU usage. In all cases, CPU usage was at zero both before and after each test. During tests run on the PC, CPU usage reached a very flat plateau at 50%, as opposed to just under 100% on the Sun. This may indicate that the PC operating system’s CPU allocation policy does not allow any process to have more than half the CPU, even if the other half is available. We did not attempt to investigate this further. The Sun and the PC each had 512 megabytes of RAM memory. On the Sun, the largest any search process became was 13 megabytes. There were always over 100 megabytes of free RAM and no CPU time was spent on swapping. On the PC, the largest any search process became was 22 megabytes. There were always over 200 megabytes of free RAM and no CPU time was spent on swapping. We checked that none of the monitors uses a significant portion of the CPU. RULE OF THUMB 14: Conduct tests with the computer realistically loaded. Our tests were not conducted using a complete intelligent system. We did not know what a realistic load would be, so we did not do this. RULE OF THUMB 15: Understand the effects of the test harness and compensate for them. The test harness for Dijkstra search was a main routine taking four arguments (i) the name of a graph file, (ii) the node number of the start node, (iii) the node number of the goal node, (iv) the number of times to repeat the search. The number of times to repeat the search was selected so as to satisfy the requirement that the total time taken by the test be at least 30 seconds. Preliminary testing of each test case was done to determine a number of repetitions that would meet this requirement but not need more than a few minutes for each test. A file format for an abstract directed graph was devised, and a file reader was built into the test harness that would read the file and build a directed graph structure. Testing revealed that the smaller files were read in a second or less, but the larger ones required up to 7 seconds on the Sun and up to 18 seconds (for the same file) on the PC. We did not attempt to determine why the PC was slower. The reading time was calculated by running the same test with two different numbers of repetitions and using the equation TotalTime = (ReadTime + (RunTime x repetitions)). The reading time was also observed on the PC performance meter. Where reading times were more than a second, the run times were calculated using the equation just given. Reading times are out of the scope of comparing the algorithms we were comparing. They are effects of the test harness, and we compensated for them. The other effect of the test harness we identified was the time taken by the “for” loop that repeats the test. Each time around that loop, each node in the graph is marked UNOPENED, since Dijkstra search requires that marking when it starts up. This is a very small amount of processing compared with the processing done on nodes in Dijkstra search, so we did not compensate for it.
RULE OF THUMB 16: Use representative test cases. The graphs we used were constructed (by a graph-building program we wrote) to produce graphs with the characteristics described earlier. The user of the program specifies number of nodes, the branching factor, and an upper bound on arc cost. In real problems, a constant branching factor seems unlikely. We doubt that the algorithms would have compared differently if we had used variable branching factors, but we have neither an analysis nor experimental data to substantiate that. Since our graph construction methods were not selected to produce graphs similar to those found in any specific application, we cannot claim that the test graphs are representative. An equally severe problem was picking the start and goal nodes for each test case. Clearly, in each graph we constructed, some pairs of nodes would be connected by a short cheap path while other pairs would be connected only by more expensive longer paths. Finding the least expensive path would be relatively easy for the short cheap paths and relatively hard for the long expensive paths. To get average results, in each graph, we could have randomly selected a set of pairs, repeated the tests for all pairs in the set, and averaged the results. This would have required a much larger amount of testing than we were prepared to do. Instead, for each graph we randomly selected a set of 7 pairs, timed all 7 pairs using AVL and only a few repetitions to identify the pair with median time, and used that one pair as the representative for the graph in testing with List and Tabs and retesting with AVL. This selection procedure still left substantial differences in the relative difficulty of the test cases. When run time was plotted against problem size for the algorithms being tested, the resulting lines were rather jagged. But the three curves zigged and zagged together, implying the zigs and zags were effects of problem difficulty, not the algorithms being tested. This suggested factoring out the difficulty of the representative problem by plotting the ratios of the times, not the actual times, and that is what we did. For a specific instance of a test case, the time taken can be viewed as the relative difficulty of the test case (compared with the average difficulty) multiplied by the average time taken. If the average time taken is given by T = F(N), then letting DCase be the relative difficulty, the equations for time taken for a specific test case are: TListCase = DCase x FList(N), TTabsCase = DCase x FTabs(N), and TAVLCase = DCase x FAVL(N). When the ratio of any two times is taken, the Dcase in the numerator cancels with the Dcase in the denominator, removing the effect of the difficulty of the case. RULE OF THUMB 17: Use standard test case sets, if available and appropriate. We are not aware of any standard test case sets for pure graph search using the range of sizes and branching factors we have used.
RULE OF THUMB 18: Collect secondary data showing what the algorithm is doing internally. We collected secondary data for three purposes: (i) to be sure List, AVL, and Tabs were behaving identically where they were supposed to be doing so, (ii) to determine how the Dijkstra algorithm behaves on problems with different sizes and branching factors, (iii) to measure those things that analysis indicated the three algorithms would do differently. We collected secondary data by adding conditionally compiled code to the source code files for the three systems. Timing tests were conducted with versions of the executable systems compiled without data collection. A subset of the same tests were repeated with versions of the systems compiled with data collection. To be sure the systems were behaving identically where they should be identical, two files were generated: one listing the node numbers in the order in which they were opened and giving the total number of nodes opened, and the other listing the total number of nodes open each time around the node processing loop of the Dijkstra algorithm. For each test case, files generated on the Sun by the three systems were compared and the data items just mentioned were found to be identical. For a few test cases, similar files were also generated on the PC. All data that should be identical were found to be identical, even the maximum 2,417,260,900 comparisons. RULE OF THUMB 19: Deal with measurement error. When testing on the PC, a digital watch reading in seconds was used to time the tests. Since this automatically introduces a random error of one second, all tests on the PC were adjusted to run for at least 30 seconds, so that the random error from reading the watch would not be more than about 3% of the time being measured. Timing for the PC was spot-checked using the PC’s performance monitor. Timing on the Sun was done with the time command; spot checks were done with a digital watch and an analog clock. RULE OF THUMB 20: At widely separated times, repeat tests performed earlier. This rule was followed throughout testing. No significant increases in variability occurred.
5.
Conclusion
This paper has presented 20 rules of thumb to follow in comparing algorithms performing the same function that might be used in an intelligent system. An example was provided of how the rules were applied in comparing three algorithms for maintaining the collection of open nodes in Dijkstra search. For some rules, the example described a pitfall that was avoided by having followed the rule. For other rules, the example showed how difficult it can be to follow the rules. The rules of thumb presented here can certainly be improved, and surely there are other rules it would be helpful to add. The intent of these rules is to help builders of intelligent systems make better decisions among competing algorithms. We hope they will be useful for that purpose.
6.
References
[1] Adelson-Velskii, G. M. and Landis, E.M., “An Algorithm for the Organization of Information”, Doklady Akademiia Nauk SSSR, Vol. 146, No. 2, 1962, pp. 263-266. [2] Baeza-Yates, R., “Height Balance Distribution of Search Trees”, Information Processing Letters, Vol. 39, No. 6, 1991, pp. 317-324. [3] Balakirsky, Stephen B., Lacaze, Alberto, “Value-Driven Behavior Generation for an Autonomous Mobile Ground Robot”, in Proceedings of the SPIE 16th Annual International Symposium on Aerospace/Defense Sensing, Simulation and Controls, Orlando, FL, April 1-5, 2002. [4] Balakirsky, Stephen B., and Kramer, Thomas R., “NOT (Faster Implementation ==> Better Algorithm), A Case Study”, in Proceedings of the PerMIS ‘03 Workshop, NIST Special Publication 1014, 2003. [5] Dijkstra, E. W., “A note on two problems in connexion with graphs,” Numerische Mathematik, Vol. 1, 1959, pp. 269271. [6] Hooker, J. N., “Needed: An Empirical Science of Algorithms”, Operations Research, Vol. 42, No. 2, MarchApril 1994, pp. 201-212. [7] Knuth, Donald E., The Art of Computer Programming, Volume 3 Sorting and Searching, Addison Wesley, Reading, Massachusetts, 1973, [8] McGeoch, C. C., “Experimental Analysis of Algorithms”, Notices of the AMS, Vol 48, No. 3, March 2001, pp. 304-311. [9] Priebe, V., Average-case complexity of shortest-paths problems, Ph.D. dissertation, University of Saarland, 2001, available at http://www.mpi-sb.mpg.de/~priebe/diss.pdf. [10] Schneiderman, Ben, “Jump Searching: A Fast Sequential Search Technique”, Communications of the ACM, Vol. 21, No. 10, 1978, pp. 831-834. [11] Sedgewick. R., Algorithms, Addison Wesley, Reading, Massachusetts, 1983, pp. 12-16. [12] Tarjan, R. E., Updating a Balanced Search Tree in O(1) Rotations, Information Processing Letters, Vol. 16, No. 5, 1983, pp. 253-257.