A concise qualitative analysis of the session is presented before reporting results .... to in this particular software
INTERNATIONAL CONFERENCE ON ENGINEERING DESIGN, ICED'11
ABSTRACT This paper presents the results of comparing designing across different domains. It is claimed that designing involves ontological issues and processes that can be observed and appear across all domains in contrast to the belief that designing is unique to its domain. A case study of designing in three different domains, architectural design, software design, and mechanical design, was conducted. A concise qualitative analysis of the session is presented before reporting results from quantitative measurement of the design issues and processes in the three design sessions. We found differences in terms of design issues and processes in the three design sessions. The results from this case study support the claim that an ontologically based approach allows for comparisons of designing across multiple domains. Keywords: Design ontology, protocol analysis, linkography Is designing unique to its domain of practice or is designing a general activity practiced in multiple domains? There have been numerous design cognition studies of designers within their own domain. These studies have examined a wide range of variables but have kept the domain fixed. There have been very few studies comparing the design cognition of designers from different domains. One of the more commonly used methods to study design cognition is protocol analysis [1] [2]. Whilst protocol analysis has been used extensively to study designing there has been a lack of comparability of results from different studies due to the use of different coding schemes applied by different researchers [3]. The Design Thinking Research Symposia 2 [4] and 7 [5] are examples of researchers using the same data set but with different kinds of models and analysis methods, producing a rich and wide range of results. However, the differences in methods make it difficult if not impossible to compare and validate results from various researchers. The extant studies of designers from various domains have produced results that cannot be compared. Kan [6] used a framework of methods to study design protocols quantitatively and uniformly. Methods based on design ontology [7], sequential analysis [8], linkography [9], and information theory [10] were developed. The combinations of these methods quantify designing in terms of issues, processes and idea development opportunities. These methods of analyzing design protocols are laborious. A tool [11] has been developed to automate all the calculational methods of the analysis. This paper uses this generic tool to compare and contrast designing in three different design domains. The analysis methods are independent of design domain, number of designers, expertise of designers, whether tools are used and what kinds of tools are used [3] [11]. The three different design domains of architectural design, software design and mechanical design have been studied using generic methods that allow for comparisons. This experiment is a case study of three design sessions, one for each domain. All the three sessions were in-vitro design sessions that involved two collocated participants collaborating to design for 30 to 60 minutes. The architectural design session was about designing an art gallery. The mechanical design session was about designing a device for elderly and disabled to open and close a window. The software design session was about designing a traffic flow simulation program. Section 2.1 presents a brief qualitative overview of each session. 2.1 Qualitative Analysis of the three sessions The participants in the software and architectural design sessions were experts while the participants of the mechanical session were novices. In the experts’ sessions, participants spent less time in studying the brief/requirements while in the novice session participants spent more time in
ICED’11/Paper number (Contribution ID)
1
understanding the brief. Participants in both the software and mechanical design sessions used a whiteboard to draw and document their design. The participants in the architectural designe session used tracing paper to draw, sketch and document their design. 2.1.1 Architectural Design Session
In the architectural design session, the participants were one senior architect and one architect. The senior architect took the leadership role, made most of the decisions, and produced most of the sketches. Observing the session, it can be divided into four parts. In the first part they dealt with the brief and site (about 3.5 minutes). In the second part they analyzed, planned and developed concepts in the plan (about 9 minutes); issues like location of main entrance and service entrance, icon to capture attention were discussed. In the third part they developed the 3D form in elevation (about 9 minutes); ideas like “ribbon”, “hole in the middle” were suggested. In the final part they worked on the layout and calculated the required areas until the end of the session (about 8.5 minutes). 2.1.2 Software Design Session
In the software design session, the participants were both experienced designers. This session can be classified into three parts. In the first part they studied the brief individually without verbalizing (about 5 minutes). In the second part they tried to understand the required simulation by drawing an analogy from real world traffic (about 25 minutes). Different objects and variables were discussed such as cars, signals, and intersections. In the last part, they focused on the program structure until the end of the session (about 28 minutes). Participant 1 seemed to take the leadership role and did most of, if not all, the drawing and writing on the board. 2.1.3 Mechanical Design Session
In the mechanical design session, the participants were undergraduate engineering students. They were give access to a specific website to provide them the necessary information regarding the requirements. The division of activities of this session is not as clear as the two other sessions, however it can be divided into three parts; in the first part the major activities were to learn and understand the problem which was interwoven with the proposing of solutions. In the second part, they developed their ideas of crank system, pulley and gears which were intertwined with the learning aspect. In the last part they tried to document their ideas but prompted design activities as well.
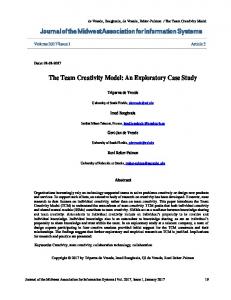
3.1 Design Protocol Protocol analysis uses verbal protocols and concurrent reporting as qualitative data from which quantitative data is derived for studying thought processes. In the standard procedure of studying design using protocol analysis there are five steps: conducting experiments that produce the protocols, transcribing protocols, parsing the transcription into segments, encoding segments according to a coding scheme, and interpreting the encoded protocols [12]. The experiment, in the first step, is derived from the research aim and method, which also delineates the coding scheme. However, there are theories about designing that assume the fundamental issues and processes involved in designing are the same unrelated to what is being designed and the environment within which designing occurs [13] [7]. Within a theoretical framework, in a typical protocol analysis study, design issues and design processes are usually encoded separately. In this method, instead of encoding processes we only encode design issues and use additional steps to derive design processes from the design issues. The additional steps are: construction of a linkograph and consequentially deriving design processes from the coded segments and links. 3.2 FBS Design Ontology Based Coding Scheme We study designers’ thinking in terms of the FBS ontology, Figure 1 [7]. In this ontology there are fundamentally only five design issues a designer focuses on: function or purpose (F); expected behavior of the resulting design (Be); behavior derived from the proposed design (Bs); a mental representation of the design itself called structure (S) and an external representation or description of structure (D). In addition there is the issue that comes from the client in the form of requirements (R). Designing commences with requirements (R) and ends with design descriptions (D). The
ICED’11/Paper number (Contribution ID)
2
transformations between design issues are the design processes, which are not separate from and are a consequence of the design issues. There are 8 design processes from the design issues. Formulation is the design process of transforming requirements (R) into functions (F) and transforming functions into expected behaviors (Be). Synthesis is the process of transforming expected behaviors into structure or form (S). Analysis is the process of deriving the actual behavior (Bs) from the structure, and evaluation is the process of comparing the expected behavior and analyzed behavior. Documentation is the process of externalizing the design issues into drawings or other kinds of descriptions. There are three reformulation processes of introducing new structures, behaviors and functions, Figure 1.
Figure 1. The FBS ontology of fundamental design issues and processes
Protocols are segmented and coded as design issues according to this framework. Unlike other protocol analyses there is an isomorphism between segments and design issues and hence their codes. Examples of some of the segments and design issues are presented in Section 4.2, which is an excerpt from the architectural design session 3.3 Design Issues Software Design In designing physical objects, structure design issues (S) usually resemble some physical aspect. However, in the design of software the structure (S) will not have any physicality. In a typical objectoriented program, we refer to the objects as structure design issues. The programmers (designers) formulate the expected behaviors from the functions of these objects. With these expected behaviors they can synthesize the codes or the relationships of codes of those objects. With these objects they can derive their behaviors by either running that part of the program or mentally simulating their behaviors. For example in this set of data, the input, roads and intersections are objects that were considered as part of the (program) structure (S). During designing there were discussions concerning the expected behavior such as: drag and drop environment of the input; signal timing of the intersections. An example of behavior derived from structure is the time for cars to travel between intersections. The architectural design session lasted for 30 minutes and had 357 design issues. In the 58 minutes of the software design session, 602 design issues were identified and segmented. The mechanical design session last about an hour and 15 minutes and contained 236 design issues. The segments and codes of the software and mechanical sessions were arbitrated by two researchers with inter-coder agreement above 80% while the architectural session was self-arbitrated with agreement of over 90%. The segments were of different length of time and varied in the number of words. Table 1 shows the average number of words, and their standard deviations, per segment of the three sessions. Table 1. The average number of words in segment of the three sessions
Average no. of words in segment Standard deviations
ICED’11/Paper number (Contribution ID)
Architectural Design 15.85 14.50
3
Software Design 10.31 7.27
Mechanical Design 13.34 10.02
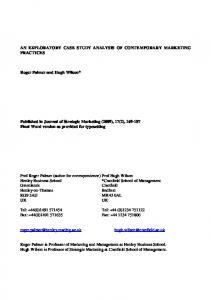
4.1 Design Issues Table 2 and Figure 2 show the distributions of design issues in the three sessions. The distributions of the independent design issues of the three sessions are very different; two tailed pair-t tested returns p > 0.99 for any combinations of the two sessions. In this case, the architects were more concerned with the function and requirement issues of the design than the other two design domains. The software designers were more concerned with behavior than structure while the mechanical and architectural designers had approximately equal concern for structure issues. The software designers had little consideration of the functional issues; this could due to in this particular software design exercise, they emphasized on the data modeling part of the software. They were more concern about the behavior of the objects in their data model rather than the functions of those objects. Table 2. The percentage distribution of design issues of the three sessions
Issue Distribution (%) Requirement (R) Function (F) Expected Behavior (Be) Behavior from Structure (Bs) Structure (S) Description (D)
Architectural Design 5.1 6.8 19.2 13.5 42.5 13
Software Design 2.8 0.5 31.1 18.8 30.8 16
Mechanical Design 3.1 1.8 10.7 31.3 42.9 10.1
Figure 2. The distributions of design issues for the three sessions
4.2 Variation of Design Issues during Session From the qualitative observations some issues cluster more at the beginning of a session, for example function and requirement issues. Figure 3 counts the design issues with a dynamic 30 segment window across the whole session [11]. It indicates the issues they were focusing on during different times in the design session. With a design ontology that starts with design requirements and ends with design descriptions, one would expect a pattern with more function and requirement issues at the beginning of a session and more structure and description at the end. This is the case for the first 50 segments of the architectural design session as can observed in Figure 3(a). Software designers appear to be only concerned with function issues at the beginning of the session, Figure 3(b). The mechanical designers, Figure 3(c) had requirements and function issues over the first two thirds of the session.
ICED’11/Paper number (Contribution ID)
4
(a)
(b)
(c) Figure 3. Dynamic distributions of design issues of (a) architectural, (b) software and (c) mechanical design session
4.2 Design Processes Measurement: Derived from Sequential Analysis Design protocols have been analyzed by statistical methods that often contain the assumption that each segment is an independent event. Markov chains describe the probability of one event leading to another. Kan [6] used Markov analysis to examine the sequence of occurrence of the FBS design issues. If we consider the sequence of design issues in Figure 4, there is a high chance that the move from one design issue to its consecutive design issue represents a design process. For example moving from segment 50 to 51 is the formulation process. Moving from segment 51 to 52 is the synthesis process. Gero et al [11] called this kind of sequence a “syntactic link” that produces a weak model of designing. Figure 5 shows the distributions of these syntactic processes. Details of the method can be found in [14]. It is claimed that this weak design process model provides information about the characteristics of a design session. Equations 1, 2, and 3 are the Markov probability matrices of the three design sessions.
Figure 4. Example of sequence of design issues, construction of linkograph, and deriving
ICED’11/Paper number (Contribution ID)
5
design processes from links and design issues
Figure 5. Percentage distributions of syntactic design processes of the three sessions
In the architectural design session, the highest probability of moving from one issue to another is found in equation 1 as 0.54 and is from description to structure. This matches the understanding of how architects design [15] [16] [17], they interpret their sketches as they design. In the software design session, equation (2), it can be observed that the probabilities of moving to function related design issues are very small. The probabilities of design issues after a design description are split between expected behavior (0.41) and structure (0.43). The highest probability is from function to expected behavior design issued (0.67), which indicates a formulation process. The probability from expected behavior to structure is also high (0.52), which implies a synthesis event. For the mechanical design session, equation (3), the probability of moving from description to structure is the highest, which is similar to the architectural design session. The next highest move probability is from structure to structure behavior and reverse (0.43 and 0.52). Comparing equations (1), (2), and (3) we can observe the distribution of high and low probabilities cluster in different part of the matrices.
(1)
(2)
(3)
ICED’11/Paper number (Contribution ID)
6
Figure 6 shows the dynamic distributions of the syntactic design processes of the three sessions with a window of 30 segments. The distributions of syntactic processes of the three sessions are different. In the architectural design session formulation appears throughout the session whereas it only appears at the beginning of the software and mechanical session.
(a)
(b)
(c) Figure 6. Dynamic distributions of syntactic design processes of (a) architectural, (b) software and (c) mechanical design sessions
The mean first passage time is the average number of steps traversed before reaching a design issue from other issues. Equations (4), (5) and (6) are the normalized mean first passage time matrices of the three design sessions. In these equations, the number of steps equals the total number of segments times the individual elements in the matrix. For example the shortest passage in the architectural design session is from Be to S and the mean passage time is 2 (357 * 0.56/100). The shortest passage in the software design session is from F to Be and the mean passage time is 1.98 (601*.33/100); and the shortest passage in from Bs to S and the mean passage time is 1.89 (326*.58/100). Table 3 shows the design processes associated with the five shortest mean first passage times of the three sessions in descending order. The possible design processes associated with these passages are shown in the brackets. Table 3 suggests the architectural design processes are based heavily on synthesizing and reformulating together with formulating expected behaviors. Software design involves, in order of importance, formulation, evaluation, type one reformulation and synthesis. Mechanical design involves mainly type one reformulation and analysis.
ICED’11/Paper number (Contribution ID)
7
!"#
(4)
$%&#
(5)
'$#(
(6)
Table 3. Design processes associated with the five shortest mean first passage times of the three sessions
Architectural Design Be>S (Synthesis) D>S (Reformulation I) S>S (Reformulation I) F>Be (Formulation) Bs>S
Software Design F>Be (Formulation) R>S Bs>Be (Evaluation) D>S (Reformulation I) Be>S (Synthesis)
Mechanical Design Bs>S S>S (Reformulation I) D>S (Reformulation I) Bs>Bs S>Bs (Analysis)
4.3 Design Processes Measurement: Derived from Linkograph Linkography was first introduced to protocol analysis by Goldschmidt [9] to assess the design productivity of designers. Like other protocol studies, protocols are segmented according to intentions and a linkograph is constructed by linking related segments. The links are established by discerning, using domain knowledge, whether a segment is semantically connected to any previous segments. Kan [6] used the ontological coding scheme and linkograph to derive ontological design processes. A constructed linkograph and its relation to the design issues is shown in Figure 4. The dots outside the segments represent links between segments. The arrows represent the derived design processes that maps onto the FBS ontology. Only four (formulation, synthesis, analysis and documentation) of the eight possible design processes are in Figure 4. Figure 7 compares the percentage distribution of design processes derived from the semantic links of the three design sessions. Of the 601 segment of the software design session, only the first 130 segments were studied with linkography. The results generally are in agreement with the Markov analysis of the mean first passage time: comparatively type one reformulation is high in both architectural design and mechanical design sessions; evaluation is high in the software design session. However, Figure 7 also shows additional information – type two reformulation is high for the software design session.
ICED’11/Paper number (Contribution ID)
8
Figure 7. Percentage distributions of semantic design processes of the three domains
Figure 8 shows the dynamic design processes of the three sessions. It shows the intensity of different design processes across the design session.
(a)
(b)
(c) Figure 8. Dynamic distributions of semantic design processes of (a) architectural, (b) software and (c) mechanical design sessions
ICED’11/Paper number (Contribution ID)
9
In this case study the software designers spent most of the time over behavior issues of the software being developed, while the architectural and mechanical designers focused more on structure issues. In the sequential analysis, the probability matrices also show the high probability events cluster around behavior issues in the software design session and in the architectural design and mechanical design sessions they cluster around structure issues. The mean first passage time shows the expectancy of different design processes. The expectancy of synthesis and type one reformulation is high in the architectural design session while the expectancy of formulation and evaluation is high in the software design session. In the mechanical design session, possibly because they were students, the expectancy of design processes is lower than the other two sessions. However, type one reformulation and analysis are of high expectancy. This case study has shown that it is feasible to study designing across domains. Utilizing a generic coding methodology and a standardized set of measurements provides the foundation for statistically robust comparisons, notwithstanding the high initial cost of carrying out the segmentation and coding. [1] Cross N., Christiaans H., and Dorst K. Introduction: the Delft protocols workshop, pp. 1–14, 1996, (John Wily & Son) [2] Ericsson K.A. and Simon H.A. Protocol Analysis: Verbal Reports as Data. revised edition 1993, (The MIT Press) [3] Gero J.S. Generalizing design cognition research. In Design Thinking Research Symposium 8, 2010 (University of Technology, Sydney) [4] Cross N., Christiaans H., and Dorst K., eds. Analysing Design Activity 1996, (John Wiley & Sons) [5] McDonnell J. and Lloyd P., eds. About: Designing. Analysing Design Meetings 2009.(CRC Press) [6] Kan W.T. Quantitative Methods for Studying Design Protocols. Ph.D. thesis, The University of Sydney, Faculty of Architecture, Design & Planning, Key Centre of Design Computing and Cognition, 2008. [7] Gero J.S. Design prototypes: a knowledge representation schema for design. AI Magazine, 1990. 11(4), 26–36. [8] Gottman J.M. and Roy A.K. Sequential Analysis: A Guide for Behavioral Researchers, 1983 (Cambridge University Press) [9] Goldschmidt G. Linkography: assessing design productivity. In Cyberbetics and System ’90, R. Trappl, ed., 1990 pp. 291–298. [10] Shannon C.E. A mathematical theory of communication. The Bell System Technical Journal, 1948. 27, 397–423. [11] Gero J.S., Kan J.W., and Pourmohamadi M. Analysing design protocols: Development of methods and tools. In Research into Design, Research Publishing, A. Chakrabarti, ed., 2011 pp. 3–10. [12] van Someren M.W., Barnard Y.F., and Sandberg J.A. The Think Aloud Method: A Practical Guide to Modelling Cognitive Processes. Knowledge-Based Systems, 1994 (Academic Press) [13] Asimov M. Introduction to design, 1962 (Prentice Hall) [14] Kan J.W.T. and Gero J.S. A generic tool to study human design activity. In Human Behavior in Design, M. Norell Bergendahl, M. Grimheden, L. Leifer, P. Skogstad, and U. Lindemann, eds., 2009 pp. 123–134. [15] Suwa M. and Tversky B. What do architects and students perceive in their design sketches? a protocol analysis. Design Studies, 1997. 18(4), 385–403. [16] Suwa M., Purcell T., and Gero J.S. Unexpected discoveries and s-invention of design requirements: important vehicles for a design process. Design Studies, 2000. 21(6), 539–567. [17] Goldschmidt G. The backtalk of self-generated sketches. Design Issue, 2003. 19(1), 72–88.
ICED’11/Paper number (Contribution ID)
10