Comparing Human and Automatic Face Recognition Performance Andy Adler
Michael E. Schuckers
Systems and Computer Engineering, Carleton University, Ottawa, Canada
[email protected]
Mathematics, Computer Science and Statistics Department, St. Lawrence University, Canton, NY, USA and Center for Identification Technology Research (CITeR) West Virginia University, Morgantown, WV, USA
[email protected] Abstract
Face recognition technologies have seen dramatic improvements in performance over the past decade, and such systems are now widely used for security and commercial applications. Since recognizing faces is a task that humans are understood to be very good at, it is common to want to compare automatic (AFR) and human (HFR) face recognition in terms of biometric performance. This paper addresses this question by: 1) conducting verification tests on volunteers (HFR) and commercial AFR systems, and 2) developing statistical methods to support comparison of the performance of different biometric systems. HFR was tested by presenting face image pairs and asking subjects to classify them on a scale of “Same”, “Probably Same”, “Not sure”, “Probably Different”, and “Different”; the same image pairs were presented to AFR systems and the biometric match score measured. To evaluate these results, two new statistical evaluation techniques are developed. The first is a new way to normalize match score distributions, where a normalized match score, tˆ, is calculated as a function of the angle from a representation of (FMR, FNMR) values in polar coordinates from some center. Using this normalization we develop a second methodology to calculate an average detection error trade-off (DET) curve, and show that this method is equivalent to direct averaging of DET data along each angle from the center. This procedure is then applied to compare the performance of the best AFR algorithms available to us in the years 1999, 2001, 2003, 2005 and 2006, in comparison to human scores. Results show algorithms have dramatically improved in performance over that time. In comparison to the performance of the best AFR system of 2006, 29.2% of human subjects performed better, while 37.5% performed worse.
I. I NTRODUCTION Biometric technologies allow automatic (ie. computer based) verification of individuals based on their behavioral or biological characteristics [32]. Recent years have seen significant technical advances in such technologies, and systems to recognize biometrics features such as face, fingerprint, and iris images are being implemented in many national security, police and commercial applications. Of all such technologies, the one most commonly compared to human capabilities is automatic face recognition (AFR). AFR differs from fingerprint and iris recognition systems, for which few, except trained experts, are able to properly interpret images to determine identity. Face recognition, on the other hand, is a task which almost all people use almost everyday. The value of face recognition for the task of identification is illustrated by the early use (1840’s) of photographs by police [10]. Automatic face recognition (AFR) technology compares an enrolled image of a person to a (newly captured) test image, and calculates a match score (or similarity score) which is a measure of the similarity between the images – biometric comparisons with higher match scores are more likely to be from the same individual. In a biometric verification system, an application specific threshold is chosen; match scores above the threshold are taken to indicate a match (images are from the same person), and scores below the threshold indicate a non-match (images from different people). Such an assessment can result in two possible errors: a false match – the system declares a match when the images are from different people, and a false non-match – the system declares a non-match with images of the same person. The performance of the biometric verification system may be quantified by the rates of each error, measured
by the false match rate (FMR ) and the false non-match rate (FNMR ). Typically, a detection error trade-off (DET) curve is calculated as the graph of FMR vs. FNMR for different values of the threshold. The FMR , FNMR terminology is prefered [21] to that of false accept rate (FAR) and false reject rate (FRR ) since the latter also includes application errors (ie. reject after three attempts) and errors due to a failure to acquire. AFR technology has made significant progress over the past 15 years. While the possibility of face recognition by computer was being investigated as early as the 1960’s [10], the field was invigorated by the work of Turk and Pentland [30] in the early 1990’s. Since then, many companies and academic groups have developed software for AFR [33]. The performance of AFR systems has been measured by a series of tests conducted by the U.S. NIST, such as FERET [25] and the FRVT 2000 [2] FRVT 2002 [27] and the current FRVT 2006. While AFR has been subject to detailed and careful performance testing, the capabilities of human face recognition (HFR) have been investigated in very different ways. The primary goal of HFR research has been to understand how the brain recognizes and processes face images (eg. [9][13][24][29]), while the actual level of performance has been of less interest. Gong et al [12] and Zhao et al [33] review recent work in the cognitive mechanisms of HFR. While, previously, little work has been done to quantify HFR performance, this has now become an important question. Many government and other security agencies are looking to implement AFR systems for applications such as border control and passport issuance, and they need to know how such systems perform in comparison to the staff they currently employ to do similar tasks. A direct comparison of human vs. automatic face recognition was performed by Burton et al [5] using variants of PCA based face recognition algorithms (based on [30]). In [4], human subjects were asked to perform a biometric identification amongst 10 subjects, and results showed that automatic face recognition accuracies outperform human results. This study is limited by its use of older and lower performance automatic face recognition systems. Also, the database chosen appears to have little age changes between images, which may give an advantage to automatic systems, which have significant difficulty with age changes [27]. Several studies of human face recognition capabilities have been performed [4][6][19], yielding widely different performance levels. In addition to studies published in the open literature, we are also aware that several governments have conducted classified studies of this nature. Kemp et al [19] analyzed the ability of supermarket cashiers to identify shoppers from photos on credit cards, and discovered overall poor performance. Bruce et al [4] investigated the ability to recognize faces from a database of young white male police trainees. The subjects were motivated students and were given no time limit for the task. Overall, results were judged to be “highly error prone” (correct responses of 68–79%). Liu et al [6] analyzed the ability of people to match poor-quality video footage against high-quality photographs, and showed a 75% success rate. One of the difficulties in measuring HFR capabilities is that the results depend strongly on many external factors, such as motivation, fatigue, training, and required processing speed. For example, a difference in motivation may help explain the difference in performance between the results of [19] and [6]. The supermarket cashiers studied in [19] were not rewarded for face recognition performance, and were thus likely to concentrate their effort on other tasks. In this paper, we describe an approach to measure and compare AFR and HFR performance. The paper is organized as follows: first, we describe our experimental protocol for human and automatic face recognition performance (Sec. II); next, we develop a new set of statistical methods that can be used to compare biometric algorithm performance performance (Sec. III); and finally, we compare AFR and HFR results and comment on their significance (Sec. IV). II. M ETHODS : FACE R ECOGNITION T ESTS A test protocol was developed to allow direct comparison of human (HFR) to automatic (AFR) face recognition performance. In order to clarify our terminology, we use the term “system under test” or
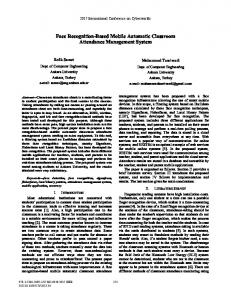
“face recognizer” to refer to either the software or human volunteer, as appropriate. We use the term “performance” to refer only to match performance in terms of error rates. We do not consider match speed, throughput, or other performance measures in this paper. The common feature offered by all AFR systems is the ability to compare two input images of frontal faces, while some are able to use more information, such as multiple enrollment images, different poses, video data from a subject, or 3D information. Thus, to be able to test all AFR systems available to us, we limited the test to consider comparison of two frontal face images. We designed the test to present two unfamiliar images, and required the system under test to make a decision as to whether they were the same person. Thus, our system models biometric verification, as opposed to the identification process (eg. [5]). A. Test Database Images were obtained from the NIST Mugshot Identification Database (MID) [23], using the section of the database with multiple images of subjects, which provides overall 338 frontal images of 131 different subjects. The MID is a collection of frontal and profile poses taken by law enforcement officials; it is considered to be one of the more difficult for AFR [26][31] largely because of the variability in image quality and the large age range over which different image of individuals are acquired. Each MID image is a large (at least 600×600 pixel) scan of a grayscale photograph of the subject. The image quality ranges between excellent and very poor. The pose of the subjects is full frontal, with very little variability. Subjects are almost entirely male (327 of 338 images, or 126 of 131 subjects). The age in years of each subject at the time of photo capture is provided with the database. The average age is 32.2, with a minimum of 17, and a maximum of 60. The average age difference between images for each subject is 6.55, with a minimum of 0, and maximum of 37. A set of sample images of the same person from the MID is shown in figure 1, illustrating how large age differences make identity verification difficult. Pairs of frontal pose face images were randomly created from this database, subject to the constraint that two-thirds of the pairs were impostors (images of different persons), and one third were genuines (different images of the same person). A total of 540 image pairs were created (356 impostors, and 184 genuines). Since the MID provides up to five images of each subject, there were no duplicate genuine images used. No special effort was made to select images of the same gender or ethnicity for the impostor pairs. This decision differs from [9] in which gender and ethnicity matched pairs were used. Our reasoning is that such matching is effectively an unfair help to the AFR algorithms – the human test designers are performing a presorting task, which the human subjects will have no difficulty with, but may help the algorithms. B. Human Face Recognition Performance In order to estimate an upper bound to HFR performance, we designed a test to measure results for motivated, interested people who were not under time performance pressure. Test design: The test was designed to allow participants to use an Internet browser. Test software was written in Perl using the Apache web server. Participants would first log in to the application, and would then be presented a set of test screens, in which an image pair was presented and a set of response buttons provided. No time limit was imposed for the test. Tests were presented in a random order to each participant (with no repetition), and no feedback on the accuracy of choices was given. Each response and the timing of the response was measured and recorded in the application database. An example test screen image is shown in Fig. 1. In each case, an image pair was presented, and the participant was required to select among the choices of “Same”, “Probably Same”, “Not Sure”, “Probably Different”, and “Different”. The participant’s choice was converted to a match score value, such that “Same” = 5 and “Different” = 1, with the other values distributed between these values. Instructions: Participants were recruited using an introductory presentation on the test and its overall goal: “to test human versus machine face recognition performance”. They were shown how to log into the
Fig. 1. Screenshot of the software application for testing of human face recognition performance. After logging into the application, participants were presented a series of pairs of images, and were required to choose one of the selections. Instructions were to strive for “accuracy”, and no time limit was given.
system and given an example of the test screen (Fig. 1). Participants were instructed to strive for “accurate responses”, and to complete as much of the test as possible, but without fatigue. The distinction between false match and false non-match was not discussed, and the goal of “accuracy” was not further clarified. Specifically, no guidance was given as to whether to prefer false matches or false non-matches. Participants were not compensated, except with the encouragement that “you will be helping the understanding of face recognition technology”. Subjects: Participants were employees of AiT corporation (now 3M Security Systems Division) who were invited to be tested during a company meeting. Tests were unsupervised, and performed in each participants’ office, using the Internet browser on their office PC. Tests were performed in July 1999. Twenty one people (16 male, 5 female) participated in the experiments. They were predominantly Caucasian and in the age range 20 to 40. On average, 123 tests were completed by each participant. Participants took on average 10.0 seconds per image pair, with a standard deviation of 7.7 seconds. C. Automatic Face Recognition Performance Between 1999 and the time of writing, we have had the opportunity to test fifteen different commercial AFR software packages from seven different vendors. Each AFR system was tested on the data set described in Sec. II-A. Each pair of images was presented to each AFR software package, and the
algorithm match score calculated, using the verification mode of the software if a choice was available. Software was developed as required to support these tests; in some cases vendors supplied command line test software, in other cases software was written to interface with SDKs, while in other cases web or GUI automation tools were developed. Some AFR software packages require a database of face exemplars for training of the feature extraction or segmentation algorithms. For those software packages, images were provided from the portion of the MID that was not part of the test, including landmark locations (for eyes, nose and mouth positions, if required) selected manually. Based on this protocol, each face recognizer, whether human or software could be analyzed in the same way. Each system was presented a collection of genuine and impostor image pairs and outputs a match score value for each pair. The match score was either an integer in the range 1–5 (for humans) or a real number over each software package’s match score range. III. M ETHODS : S TATISTICAL In this section, we develop novel statistical tools that are necessary in order to analyze the data measured in the previous section. The key challenge is that each system under test calculates match scores according to a different scale. For example, one AFR system scores on the range 0–10, with a decision threshold at the equal error rate of about 7.0, while another scores on 0–1 with a corresponding threshold of 0.85. Some human testers would almost never be certain of a match (score = 5); others would tend to use “not sure” (= 3) where another would put “probably different’ (= 2). Because of these differences, it is not statistically correct to directly compare score values between two systems. To address this problem, we develop methods to calculate normalized scores, and then perform tests on those values. One common way to represent the performance of a biometric classification algorithm is the detection error trade-off (DET) curve. A sample population containing matching (genuine) and non-matching (impostor) image pairs is presented to the biometric algorithm and the match score, t, calculated to estimate the genuine, g(t), and impostor, f (t), match score distributions. From these distributions, the DET is typically plotted as the false match rate (FMR ) on the x-axis against the false non-match rateR(FNMR ) on R τ the y-axis, by varying a threshold τ , and calculating FMR (τ ) = τ∞ f (x)dx and FNMR (τ ) = −∞ g(y)dy. The DET summarizes the verification performance of the biometric algorithm on the sample population on which it is calculated. These data can also be represented by a variant of the DET, the receiver operating characteristic (ROC), which plots the true match rate (TMR = 1 − FNMR ) vs. the FMR . Technology evaluations, such as the FRVT [22] and FpVTE [27] tests use the DET or ROC to to describe their biometric verification results. In this paper we are specifically motivated by how to average the separate DET curves of human volunteers who were asked to perform face recognition tasks. Because a DET is inherently a two dimensional curve it is difficult to average the curves in a way that properly maintains the importance of both dimensions. In order to address this problem, we develop a technique to calculate an average DET based on regeneration of normalized match scores and distributions. We then show that this is equivalent to a geometrical averaging directly on the DET curves. Here we are motivated to develop methods for a composite DET curve given classification pairs (FMR (τ ), FNMR (τ )) from multiple sources in which the original genuine and impostor distributions are either lost, or the match score values, t, are calculated in different spaces. Four types of DET or ROC averaging have been proposed. Bradley [3] suggests using an average based upon the ith ordered threshold in DET space. However, this method leads to difficulties when the number of thresholds tested varies greatly from curve to curve. Vertical averaging (along the FMR ) has been suggested by Provost et al [28], but this method is only appropriate if one of the error rates is more important for some a priori reason. When the data to be averaged have very different error rates this method can produce very non-intuitive results, such as if one system reaches FNMR = 1.0 at non-zero FMR . Fawcett [8] proposes averaging at the thresholds; however, this method fails when the systems use different match score scales.
Finally, Karduan et al [18] proposed averaging the log-odds transformation of one error rate given the other. In this paper we propose a new method for averaging based on the radial sweep methodology of Macskassy and Provost [20]. This approach, described below, transforms each curve from the (FMR , FNMR ) space to polar coordinates. A collection of J biometric score distributions are available. Each distribution, j, is measured with a (j) different biometric algorithm, and provides Njg genuine match scores, Gi , 1 ≤ i ≤ Njg and Njf impostor (j) match scores, Fi , 1 ≤ i ≤ Nif . There are no conditions on the match scores other than they be real scalar, and increase with match likelihood. Each algorithm is characterized by its own incompatible match score tj . The continuous genuine, f (j) (tj ), and impostor, g (j) (tj ), distributions for algorithm j are calculated: Ng
j 1 X (j) δ(tj − Gi ) g (j) (tj ) = g Nj i=1
(1)
Nf
j 1 X (j) f (j) (tj ) = f δ(tj − Fi ) Nj i=1
(2)
where δ represents the Dirac delta function. We formulate the distributions over a continuous match score in order to clarify the regenerated distributions in the normalized match score space. Based on these distributions, the false match rate (FMR j ) and false non-match rate (FNMR j ) for biometric system j may be calculated as FMR j (τ ) FNMR j (τ )
Z
=
∞
f (j) (t)dt = 1 −
τ− Z τ−
=
Z
τ+
f (j) (t)dt
(3)
−∞
g (j)(t)dt
(4)
−∞
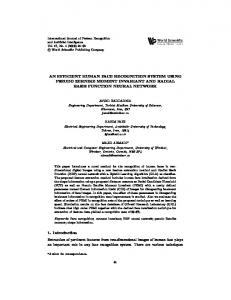
by varying the threshold τ . This calculation is illustrated in Fig. 2. Here, it is important that the calculation of either FMR or FNMR , but not both, include the distribution value at τ ; we include it in the FMR . Without loss of generality, this assumes that the decision process is to accept if the match score is greater than or equal to the threshold, τ . A. Normalized match scores via polar coordinates In order to perform further analysis on multiple DET curves, it is necessary to calculate a normalized match score common to all curves. In this section, we describe an approach, based on representing the curve in polar coordinates, as illustrated in Fig. 2. (j) (j) We have FMR , FNMR coordinate pairs (xi , yi ), i = 1 . . . Nj ; j = 1 . . . J, where Nj = Njg +Njf , for (j) (j) (j) a series of J DET curves. By the monotonicity of the DET curves, we know that x1 ≤ x2 ≤ . . . ≤ xNj (j) (j) (j) and y1 ≥ y2 ≥ . . . ≥ yNj . For any point, (x, y), on a DET curve, we calculate an angle, θ and distance r from a center point (cx , cy ) (we later recommend cx = cy = 1). !
(5)
(cx − x)2 + (cy − y)2
(6)
θ = tan
−1
r=
q
cx − x cy − y
We define an angle with respect to the bottom-right of the DET, since at τ = −∞, FMR = 1 and FNMR = 0. The DET curve moves left and upward with increasing τ . The limits for θ are θmin = tan−1 ((cy − 1)/cx ) and θmax = tan−1 (cy /(cx − 1)) Since we wish to calculate a normalized match score tˆ in the range 0 . . . 1 from θ, we define the normalized match score tˆ, as θ − θmin tˆ = (7) θmax − θmin
Fig. 2. Calculation of FMR and FNMR from sample distributions and regeneration of match score t using polar coordinates. Given the discrete genuine and impostor distributions shown on the left, the DET curve on the right is calculated. From a center at (cx , cy ) an angle, θ, and distance, r, is calculated to each FMR , FNMR point. A normalized match score t is then calculated from θ. In this example, the distributions are discrete, and the DET curve uses a linear interpolation between points.
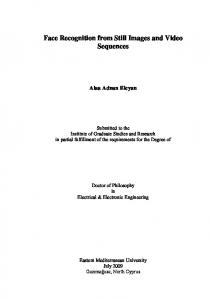
B. Comparison of DET curves As explained above, it is not possible to directly compare the performance of two biometric algorithms from match score data, since the algorithm match scores are incompatible. One application of the normalized match score is to compare relative algorithm error performance, in order to decide if one is better than another. In order to test at a match score, tˆ, we calculate r for each algorithm. If the radial spoke does not intersect the DET curve, then we linearly interpolate between the closest two points. From r, we calculate FNMR (tˆ) = cy − r cos θ and FMR (tˆ) = cx − r sin θ, where θ = θmin + (θmax − θmin )tˆ. In order to simply test if algorithm A performs better than B, we can compare if rA > rB at match score tˆ. However, rather than simply considering performance at a single match score, it is normally useful to consider a range of scores, tˆmin ≤ tˆ ≤ tˆmax . Over this range, we may say algorithm A is better than B, if rA > rB throughout the range, and vice-versa. However, if neither rA > rB or rB > rA is always true throughout the range, we conclude that neither algorithm outperms the other (the better algorithm is indeterminate). C. Distributions from DET curves In this section, we use the polar-coordinate representation, to reconstruct candidate genuine, gˆ(tˆ), and impostor, fˆ(tˆ) distributions. Based on the equations 3 and 4, for each DET curve j, dFMR j (8) f (j) (tˆ) = − dtˆ dFNMR j g (j)(tˆ) = . (9) dtˆ Fig. 3 illustrates the calculations. Since FMR and FNMR data are not continuous, but are sampled from the DET, the distributions must be defined in terms of discrete approximations to the derivative. One consequence of using this approximation is that gˆ and fˆ may be noisy, but this does not matter for this application.
Fig. 3. Reconstructed genuine, gˆ(tˆ), and impostor, fˆ(tˆ), distributions: From the DET curve of Fig. 2 the FMR (upper left) and FNMR (lower left) are calculated as a function of the normalized match score tˆ. From these curves, the impostor (upper right) and genuine (lower right) distributions are calculated as − ddtˆ FMR and ddtˆ FNMR , respectively.
Using this calculation, we now have a collection of distributions gˆ(j) , fˆ(j) for j = 1 . . . J, which are all based on compatible match scores, tˆ. It is thus possible to combine the distributions, weighted by the number of samples in each (if known). If the number of samples is unknown, all Njf and Njg values are assumed to be equal for all j. The average genuine, f¯, and impostor, g¯, distributions are ¯ tˆ) = f( g¯(tˆ) =
J 1 X Njf fˆj (tˆ) f N j=1 J 1 X N g gˆj (tˆ) N g j=1 j
(10) (11)
where N f = Njf and N g = Njg are the total number of impostor and genuine samples. However, this expression may be shown to be equivalent to a direct averaging of the DET curves in (FMR , FNMR ) space, as follows: P
P
ˆ (tˆ) FNMR
=
Z
τ−
Z
τ−
Z
τ−
g¯(t)dt
−∞
=
−∞
=
−∞
=
J 1 1 X dFNMR j (t)dt g N j=1 dt
J 1 1 X Njg dFNMRj (t)dtˆ g N j=1 dt
J 1 X Njg (FNMR j (tˆ) − FNMR j (−∞)) Ng i=1
Njg FNMR j (tˆ) = g N j=1 J X
(12)
0.5 1999 2001 2003 2005 2006 Male Female HFR Avg
0.45
False Non−Match Rate
0.4 0.35 0.3 0.25 0.2 0.15 0.1 0.05 0
0
0.05
0.1 0.15 False Match Rate
0.2
0.25
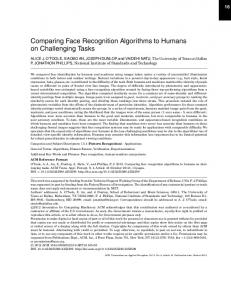
Fig. 4. Detection error trade-off curve for human and software face recognition performance. Human results are shown as a function of match score threshold. The average DET for human face recognizers is the dotted line. Continuous curves show results for the highest performing AFR software available to us in the years 1999, 2001, 2003, 2005, 2006. Line symbols indicate resampled normalized match score values.
Similarly, Njf ˆ (τ ) = FMR FMR j (tˆ) f N j=1 J X
(13)
Thus, the average DET at each angle θ may be calculated by a (possibly weighted) average of the distance of each curve from (cx , cy ). IV. R ESULTS Tests for face recognition performance were conducted for 21 human participants and 15 face recognition algorithms using the protocol outlined. Using these data, DET curves were calculated for each system, and results are shown in Fig. 4. AFR DET curves were resampled using cx = cy = 1 to calculate a normalized match score, tˆ, sampled at 100 points (shown at line symbols). This choice of center is discussed below. In order to compare AFR performance to average human results, the approach of Sec. III-C was used to calculate the average DET curve for all human scores (Fig. 4). This average curve is seen to be strongly affected by the small number of very poor human face recognizers. There was wide variability in the results from AFR systems, and certain of the poorer performing systems achieved performances close to random. We are not able to publish all AFR results and vendor names as is required by the nature of the license agreements with some AFR vendors. Instead, Fig. 4 shows the best AFR results available to us in each test year, independent of the vendor of the software. Overall, AFR performance has shown marked improvement over the last eight years, with significant improvements in each year measured. Results for human participants also varied dramatically. The best face recognizers had an order of magnitude lower error rates than the poorest face recognizers. There does not appear to be a significant difference in error rates between male and female participants, although female participants showed more of tendancy to choose false non-matches over false matches in comparison to males. Since the MID
database consists primarily of male faces, the improved capability of females to recognize female faces [15] is not evident in these data. AFR software did tend to have a lower FMR at high FNMR than human scores. This may be due to the tuning of AFR systems to give good FMR performance for biometric identification applications. In order to compare the relative recognition performance between Human and AFR results, we used the technique of Sec. III-B to compare the best AFR DET in each year to each HFR curve. The comparison range was selected to be 0.4 ≤ tˆ ≤ 0.6, corresonding to the segment of the DET curve between FMR = 0.15 and FNMR = 0.15. The fraction of HFR curves that were better (lower errors), worse (higher errors), and indeterminate are shown in Table I. The ratio of HFR performance better than AFR to HFR worse than AFR is also shown. This ratio has dramatically decreased over the years of this study; in 1999 very few participants performed worse than AFR, while current results are competitive to or better than median human performance. TABLE I H UMAN (HFR) PERFORMANCE IN COMPARISON TO BEST AFR PERFORMANCE FOR EACH YEAR Year 1999 2001 2003 2005 2006
HFR better(%) 87.5 87.5 45.8 37.5 29.2
HFR worse(%) 4.2 8.3 16.7 33.3 37.5
Indeterminate(%) 8.3 4.2 37.5 29.2 33.3
Better/Worse 21.0 10.5 2.75 1.13 0.78
V. D ISCUSSION In this paper we have developed an approach to compare the performance of face recognition by humans against that of automatic software systems. Face recognition experiments were designed and conducted on human participants and software algorithms, and novel statistical methods were developed to analyze the results. The choice of face image database was based on the “three bears” criterion [21]; it was necessary to have a sufficiently difficult database in order for error levels to be sufficiently large to make meaningful comparisons. Initially, we considered that it may be necessary to artificially chose a subset of the MID [23] which was more difficult, but this proved to be unnecessary. Humans are able to perform well on poor quality images, images with non-frontal pose, poor lighting, and outdoors (not been addressed is this work). Clearly, humans are able to use extra information efficiently, as shown by the improved ability to recognize familiar faces (whether of famous people, or of close acquaintances) [33]. Since the MID is public, it probable that AFR algorithms vendors use images from the MID (amongst thousands of others) in internal development and evaluation of these algorithms. We are unable to quantify the significance of this effect; however, since the images used in this study are a tiny fraction of all of the publically available face recognition test images, we feel that the level of this effect would be low. This work presents a preliminary study of complex phenomenon; it has studied the abilities of untrained, motivated, human volunteers, working with single frontal images of unfamiliar persons. Since human performance varies dramatically depending on the task context, we attempted to establish an upper bound for performance by creating a context in which participants would be motivated and unhurried. However, several important issues are left unanswered by this study, such as: How do humans perform as familiarity increases? What is the effect of motivation? What is the effect of routine and boredom? Do experts outperform untrained recognizers? What characterizes good recognizers from poor ones? and Are there specific image types on which humans (or algorithms) perform better than the other? In this paper we have also presented a new methodology for combining and averaging DET or ROC curves. This approach was motivated by the need to create a composite DET curve for human evaluators
of human faces. This methodology was developed independently of [20]; however, it uses the same basic technique of radially sweeping across the DET curve to create a normalized match score. This permits the creation of normalized distributions for FMR and FNMR that are a composite of individual DET curves. This normalization is a significant advance in and of itself and adds to a growing body of methods for this purpose [17]. We have used this normalization to average and compare normalized radial match scores. Given its ubiquity, it is perhaps somewhat surprising that few statistical methods have been proposed for analysis and interpretation of DET data in biometric classification. On the other hand, there is a large body of research in the statistical literature, e.g. Zhou et al [34], and a growing body of work in the machine learning/artificial intelligence literature, e.g. Hern´andez-Orallo et al [16], and Drummond et al [7]. ROC analysis is used in a wide variety of classification settings including radiography, human perception, and industrial quality control. Zhou et al [34] provide a excellent overview of this work. One limitation of inferential tools for ROC’s is the common assumption of Gaussian distributions for g(t) and f (t), e.g. Green and Swets [11]. The methodology we propose here does not depend on any distributional assumptions. Another focal area for this research has been the area under the curve or AUC, e.g. Hanley and McNeil [14]. Biometric authentication has emphasized the equal error rate (EER) as an overall summary of system performance rather than the AUC. Several issues arise from radial sweeping of DET curves. The first is where to locate the center of the sweeping. Because we would like the averaging to not depend on which error rate is on which axis, we limited possible center points to (c, c) for some constant c = cx = cy . It is clear that choosing a center along the FMR = FNMR line results in an average curve that is independent of the selection of axes and preserves EER. We considered three possible values for c: 0, 1 and ∞. Choosing c = 0 often resulted in composite or average curves that were counter-intuitive because of the acute angles near the axes. This is especially important for biometric systems which are often placed in settings where low FMR ’s are required. There was little difference between the curves when c = 1 and c = ∞. However, we prefer c = 1 because the radial angles match the typical curvature of a DET curve and, hence, are more likely to be perpendicular to such curves. The choice of c = ∞ results in averaging across parallel 45◦ lines. The question of inferential methods based on the radial mean DET is one that is important for future study. Here we are interested in creating confidence bands for an individual curve (as in [20]) as well as being able to create a confidence band for the difference of two DET curves. It would also be of interest to test a single observed DET against a hypothetical DET curve. This last case may take the form of a Kolmogorov-Smirnov type test. VI. C ONCLUSION This paper has proposed an approach to measure and compare the abilities of human and automatic (software) face recognition systems based on comparison of frontal pose images. In order to analyze these results, we have introduced novel statistical techniques for analysis of DET curves. From the comparison of human and automatic performance, we make the following conclusions: 1) There is a wide variability in the face recognition ability of humans. Differences in error rates of an order of magnitude were observed. 2) Over the last eight years, AFR technology has shown dramatic improvements. The best performing systems in 1999 were at the level of the poorest performing human participants. However, in comparison to the performance of the best AFR system of 2006, 29.2% of human subjects performed better, while 37.5% performed worse. ACKNOWLEDGMENT This work is supported by NSERC Canada (Adler), and by NSF grants CNS-0325640 and CNS-0520990 (Schuckers). CNS-0325640 is cooperatively funded by the National Science Foundation and the United States Department of Homeland Security.
R EFERENCES [1] Adler, A., Maclean, J.: “Performance comparison of human and automatic face recognition” Biometrics Consortium Conference Sep. 20–22, Washington, DC, USA, 2004. [2] Blackburn D M, Bone J M, Phillips P J, FRVT 2000 Evaluation Report, 2001 http://www.frvt.org/DLs/FRVT\_2000.pdf [3] Bradley, A. P.: “The use of the area under the ROC curve in the evaluation of machine learning algorithms.” Pattern Recognition 7, 1145–1159, 1997. [4] Bruce, V., Henderson, Z., Greenwood, K., Hancock, P., Burton, M., Miller, P, “Verification of face identities from images captured on video”, Journal of Experimental Psychology: Applied, 5:339–360, 1999. [5] Burton, A. M., Miller, P., Bruce, V., Hancock, P. J. B., Henderson, Z.: “Human and automatic face recognition: a comparison across image formats” Vision Research, 41:3185–3195, 2001. [6] Liu C H, Seetzen H, Burton A M, Chaudhuri A “Face recognition is robust with incongruent image resolution: Relationship to security video images”, Journal of Experimental Psychology: Applied. 9:33–41, 2003. [7] Drummond, C., Holte, R. C.: “What ROC Curves Can’t Do (and Cost Curves Can)” In Proc. 1st Workshop ROC Analysis in AI:ROCAI, 19–26, 2004. [8] Fawcett, T.: ROC graphs: Notes and practical considerations for data mining researchers, Technical Report HPL-2003-4. HP Labs. 2003. [9] Furl, N., O’Toole, A.J., Phillips, P. J., “Face recognition algorithms as models of the other race effect.” Cognitive Science, 96:1–19, 2002. [10] Gates, K “The Past Perfect Promise of Facial Recognition Technology” ACDIS (Arms Control, Disarmament, and International Security) GAT:1.2004 http://www.acdis.uiuc.edu/Research/OPs/Gates/GatesOP.pdf [11] Green, D. M., Swets, J. A.: Signal Detection Theory and Psychophysics. John Wiley & Sons, New York, 1966. [12] Gong S, McKenna S J, Psarrou A, Dynamic Vision: From Images to Face Recognition Imperial College Press, London, UK, 2000. [13] Hancock, P. J. B., Bruce, V., Burton, M. A.: “A comparison of two computer-based face identification systems with human perceptions of faces” Vision Research 38:2277–2288, 1998. [14] Hanley, J. A., McNeil, B. J.: “The meaning and use of the area under a receiver operating characteristic (ROC) curve” Radiology 143 29–36, 1982. [15] Herlitz C L “Sex differences in face recognition–women’s faces make the difference”, Brain & Cognition 50:121–128, 2002. [16] Hern´andez-Orallo, J., Ferri, C., Lachiche, N. Flach, P.A.,ed.: ROC Analysis in Artificial Intelligence, 1st Int. Workshop, ROCAI-2004, Valencia, Spain, 2004. [17] Jain, A.K, Nandakumar, K.: Ross, A.: “Score Normalization in Multimodal Biometric Systems”, Pattern Recognition, 38:2270–2285, 2005. [18] Karduan, J., Karduan, O.: “Comparative diagnostic performance of three radiological procedures for the detection of lumbar disk herniation” Methods Inform. Med. 29:12–22, 1990. [19] Kemp R, Towell N, Pike G When seeing should not be believing: Photographs, credit cards and fraud. Applied Cognitive Psychology 11:211–222, 1997. [20] Macskassy, S., Provost, F.: “Confidence Bands for ROC Curves: Methods and an Empirical Study.” In Proc. 1st Workshop ROC Analysis in AI:ROCAI, 61–70, 2004. [21] Mansfield, T., Wayman J. L.: Best Practices in Testing and Reporting Performance of Biometric Devices, www.cesg.gov.uk/site/ ast/biometrics/media/BestPractice.pdf, 2002. [22] NIST: Fingerprint Vendor Technology Evaluation (FpVTE) 2003 http://fpvte.nist.gov/ [23] NIST: NIST Special Database 18: Mugshot Identification Database (MID) http://www.nist.gov/srd/nistsd18.htm [24] O’Toole, A. J., Roark, D., Abdi, H., “Recognizing moving faces: A Psychological and Neural Synthesis”, Trends in Cognitive Sciences, 6:261–266, 2002. [25] Phillips P J, Martin A, Wilson C L, (2000) “An Introduction to Evaluating Biometric Systems” IEEE Computer, 33(2):56–63 [26] Phillips P J, Newton E M, (2002) “Meta-analysis of face recognition algorithms” Proc. IEEE Int Conf. Automatic Face Gesture Recog. 5:224–230 [27] Phillips P J, Grother P, Micheals R J, Blackburn D M, Tabassi E Bone J M, (2003) FRVT 2002: Evaluation Report http://www.frvt.org/DLs/FRVT 2002 Evaluation Report.pdf [28] Provost, F. J., Fawcett, T., Kohavi, R., “The case against accuracy estimation for comparing induction algorithms” In Proc. 15th Int. Conf. Machine Learning, 445–453 (1998). [29] Roark, D.A., O’Toole, A.J., Abdi, H., “Human recognition of familiar and unfamiliar people in naturalistic video Analysis and Modeling of Faces and Gestures”, IEEE Int. Workshop Analysis Model. Faces Gestures, 17 Oct. 2003 Page(s):36 - 41 [30] Turk, M., Pentland, A. “Eigenfaces for Recognition,” J. Cognitive Neuroscience, 3:71–86. 1991. [31] Wallhoff F, Muller S, Rigoll G “Recognition of Face Profiles from the MUGSHOT Database Using a Hybrid Connectionist/HMM Approach” IEEE Int. Conf. Acoustics Speech Signal Proc. Salt Lake City , Utah, July 2001 [32] Wayman J L “Fundamentals of Biometric Authentication Technologies,” Proc. Card Tech/Secure Tech, 1999 also: http://www.engr.sjsu.edu/biometrics/nbtccw.pdf [33] Zhao W, Chellappa R, Phillips P J, Rosenfeld A “Face recognition: A literature survey” ACM Computing Surveys 35(4):399–458, 2003. [34] Zhou, X.-H., McClish, D. K., Obuchowski, N. A.: Statistical Methods in Diagnostic Medicine John W. Wiley & Sons, 2002.