Brief Report
Comparing Simple Scoring With IRT Scoring of Personality Measures: The Navy Computer Adaptive Personality Scales
Applied Psychological Measurement 2015, Vol. 39(2) 144–154 Ó The Author(s) 2014 Reprints and permissions: sagepub.com/journalsPermissions.nav DOI: 10.1177/0146621614559517 apm.sagepub.com
Frederick L. Oswald1, Amy Shaw1, and William L. Farmer2
Abstract This article analyzes data from U.S. Navy sailors (N = 8,956), with the central measure being the Navy Computer Adaptive Personality Scales (NCAPS). Analyses and results from this article extend and qualify those from previous research efforts by examining the properties of the NCAPS and its adaptive structure in more detail. Specifically, this article examines item exposure rates, the efficiency of item use based on item response theory (IRT)–based Expected A Posteriori (EAP) scoring, and a comparison of IRT-EAP scoring with much more parsimonious scoring methods that appear to work just as well (stem-level scoring and dichotomous scoring). The cutting-edge nature of adaptive personality testing will necessitate a series of future efforts like this: to examine the benefits of adaptive scoring schemes and novel measurement methods continually, while pushing testing technology further ahead. Keywords NCAPS, adaptive testing, IRT, scoring methods Personnel selection and classification systems in the military have long recognized the value of measuring a recruit’s non-cognitive characteristics, under the key premise that when predicting job performance, job satisfaction and commitment, and attrition, it is not enough to measure what a recruit can do as might be measured by a cognitive ability or job knowledge test; it is also critically important to measure what a recruit will do (i.e., typical performance) as is evidenced through noncognitive measures of personality traits, interests, and work values (Campbell, Hanson, & Oppler, 2001). Focusing on personality measurement, this article analyzes a large data set containing sailors’ scores on 10 personality traits measured by the Navy Computer Adaptive Personality Scales (NCAPS; see Houston, Borman, Farmer, & Bearden, 2006). These traits are ADF (Adaptability/Flexibility), ADL (Attention to Detail), AV 1
Rice University, Houston, TX, USA Navy Personnel Research, Studies and Technology, Millington, TN, USA
2
Corresponding Author: Frederick L. Oswald, Department of Psychology, Rice University, 6100 Main Street, MS-25, Houston, TX 77005, USA. Email:
[email protected]
Downloaded from apm.sagepub.com at RICE UNIV on February 9, 2015
Oswald et al.
145
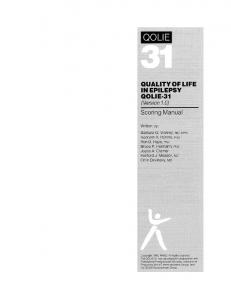
Figure 1. Sample NCAPS item measuring the dimension of leadership. Note. NCAPS = Navy Computer Adaptive Personality Scales.
(Achievement), DEP (Dependability), DUT (Dutifulness/Integrity), SO (Social Orientation), SRL (Self-Reliance), ST (Stress Tolerance), VIG (Vigilance), and WTL (Willingness to Learn). A sample item is shown in Figure 1, where the examinee must choose between two stems that reflect different levels of a given trait, where stem levels were estimated by averaging subject matter expert (SME) ratings obtained from Navy researchers and organizational psychologists. NCAPS is adaptive in the sense that the computer selects the stems to be paired together based on a sailor’s previous pattern of responses to test questions. Once NCAPS is fully operational, the system stops the test whenever a sailor’s personality score on a given trait, called an EAP (Expected A Posteriori) score, achieves a prespecified standard of accuracy (i.e., level of measurement reliability). The version of NCAPS examined here presents a static and finite number of items per trait to the test taker, and there are 106 to 194 stems in the computerized bank for each trait (see Table S1 in Supplementary Materials). Previous research by Houston et al. (2006) reported that the 10 NCAPS personality scales predicted supervisory ratings of job performance with validity as high or higher than most personality measures (r = .37). Another measure with a similar format as NCAPS (called PreVisor Computer Adaptive Personality Scales [PCAPS]) also demonstrated reasonable validity for similar criteria (r = .25; see Schneider, McLellan, Kantrowitz, Houston, & Borman, 2009), converging with findings from related lab and field studies (e.g., Bartram, 2007; Jackson, Wroblewski, & Ashton, 2000). Future research might further examine the validity of supervisory ratings of both task and interpersonal dimensions of performance (vs. ratings of overall job performance). In addition to useful levels of validity, NCAPS promises faster testing time, automated scoring, and rapid test updating. Central to this article is how NCAPS invokes a complex scoring model based on item response theory (IRT). Typically, IRT models used in psychological testing assume a dominance (or cumulative) model. Typically, the dominance model is appropriate for cognitive ability testing, because a person who tends to answer hard items on a cognitive ability test correctly will be more likely to answer all easier items correctly as well; conversely, a person who cannot answer easy items correctly will be less likely to answer harder items correctly. The appropriateness of the dominance model can be unclear for personality constructs; for instance, the IRT model used for NCAPS personality traits uses the ideal-point (or unfolding) model instead, which operationalizes the assumption that test-takers will be more likely to endorse personality
Downloaded from apm.sagepub.com at RICE UNIV on February 9, 2015
146
Applied Psychological Measurement 39(2)
items that are ‘‘closest to’’ their self-perceived actual trait level (see Coombs, 1950; Stark & Drasgow, 2002; Thurstone, 1927; Zinnes & Griggs, 1974). For instance, the IRT ideal-point model assumes that a test-taker who is average on the construct of Achievement would be less likely to endorse items reflecting a very low or very high level of Achievement, whereas the dominance model would assume instead that this person would endorse items on the very low end but not on the very high end. In short, as a test taker responds to items on an adaptive personality such as NCAPS, the ideal-point model will (a) estimate an individual’s trait standing at that time and with that estimate (b) decide on the trait levels of the two stems that will get paired together to form the next forced-choice item that intends to achieve a more accurate measurement on the individual. Measurement can halt when the estimated accuracy of an individual’s trait level has reached a prespecified level (or when a pre-established maximum number of item pairs per trait is reached, whichever comes first). The ideal-point IRT model has also been extended to personality tests that ask examinees to compare sets of stems that belong to multiple dimensions, which has the potential to improve model fit even further and with greater efficiency—for example, the Tailored Adaptive Personality Assessment System (TAPAS) measure (see Drasgow et al., 2012) and the Occupational Personality Questionnaire (OPQ32r; see Brown & Bartram, 2009). Note that any increase in fit may be in part because there are more parameters to estimate, which increases the flexibility of the model to fit data—but this also increases model complexity. There is always a trade-off between model complexity and model fit: More complex models tend to achieve better fit, but they also have a greater chance of capitalizing on idiosyncrasies of the particular set of data being modeled (e.g., in the IRT context, see Wilson, 2003). Therefore, model fit is not the single goal of a good model; a good model is also appropriately parsimonious (Pitt & Myung, 2002; Preacher, 2006). Finding an appropriate trade-off between model fit and model complexity can sometimes be operationalized in terms of model fit indices (e.g., Akaike information criterion [AIC] or Bayesian information criterion [BIC]; Vrieze, 2012), such that more complex models may be theoretically appealing than simpler models are and may fit a single sample of data better, yet simpler models may have parameters with a better chance of fitting the data from new samples and testing occasions (a form of Occam’s Razor: Adopt the model that is the most parsimonious yet accounts for the data reflecting the phenomenon of interest). Recent work on IRT ideal-point models has argued for more research examining this trade-off between model fit and model complexity (Ferrando, 2006). Although there is no single gold standard for how to optimize this trade-off, it remains informative from a practical standpoint to determine whether the additional model complexity of the IRT ideal-point model embedded within the NCAPS technology might translate into additional practical benefit in a Navy personnel testing system or whether simpler models and scoring might be preferred instead, assuming they capture the empirical value of the measure just as well as complex models. This article makes one specific attempt at evaluating the complexityfit trade-off by comparing scores based on simple-scoring rules to scores derived from an IRT ideal-point model.
Method Data Set The data set under investigation reflects NCAPS data for 8,956 U.S. Navy sailors across 16 Navy technical training schools. Available demographic data reflect the composition of active duty personnel, where the mean age was 20.9 years (standard deviation = 4.5); 81.9% were male; and the race/ethnicity of the sample was 61.4% White, 17.2% Black, 13.4% Hispanic,
Downloaded from apm.sagepub.com at RICE UNIV on February 9, 2015
Oswald et al.
147
6% Asian/Pacific Islander, and 2% Native American/Alaskan Native (see the Supplemental Materials for data selection criteria). The test consists of 12 items (stem pairs) for each of 10 NCAPS traits (120 items total). The NCAPS system is adaptive in the sense that the system selects item-stem pairs based on the test taker’s estimated trait score (EAP) up to that point, then based on the test taker’s response to the current item, the EAP gets reestimated, as does its associated reliability estimate (posterior standard deviation [PSD]). This adaptive estimation procedure is applied to all traits (note that because traits are correlated, trait estimates could inform one another; DeSarbo & Hoffman, 1987). After all items are administered, each participant obtains a final NCAPS EAP and PSD value for each of 10 traits. Note that the statements for each trait that were paired together to form items were identified only by ID number, meaning that the specific item content in this data set was confidential and not available to the authors. Therefore, item content was not considered here, though examination of this content associated with the current analyses may certainly inform future efforts to understand and further refine the NCAPS measure.
NCAPS Items and Item Administration The authors analyzed a database of 1,494 NCAPS personality item stems distributed across 10 measured personality traits. Within each trait, the NCAPS computer algorithm selects two stems and pairs them to form an item for a particular test and test taker (a sample item is in Figure 1). Given a trait with p item stems, there are as many as p(p 2 1)/2 unique pairs of stems that could form an item. For example, Adaptability/Flexibility has 191 stems, and therefore, 18,145 items (stem pairs) are mathematically possible. However, there are constraints placed on how stems are selected that reduce the number of possible pairs seen in practice by a fair amount. Specifically, item stems are selected based on the person’s current EAP (IRT-based trait score) for a given personality trait, such that a response to a given item provides diagnostic information about the pair of stems to select for creating the next item. For instance, if a test taker selected a stem that was much higher than his/her current EAP estimate, then the next pair of stems would have levels that are slightly higher than the newly revised EAP estimate (incidentally, the level of a stem is also on the EAP scale, because IRT scales both test takers and items are located on the same metric). In other words, the IRT-driven selection of items in NCAPS is adaptive, meaning that there are differential (nonrandom) rates of exposure of the item stems; therefore, item security concerns might be higher for some stems and less for others. Other forces also cause nonrandom exposure to item stem content. For example, at the start of taking NCAPS, there is no prior EAP information, the case where the best estimate of every person’s EAP is the overall mean. Therefore, the rule for selecting and pairing item stems to generate the first item for each NCAPS trait should be the same for every test taker, potentially leading to overexposure of item stems given initially (Chang & Ying, 2007). There may be other reasons for some stems to receive more exposure than others. For instance, because personality traits are approximately normally distributed in broad samples of people (Markon, Krueger, & Watson, 2005), the trait extremes contain fewer people; therefore, to the extent NCAPS items adapt to a person’s EAP, stems providing more precise measurement at the extremes could be exposed less.
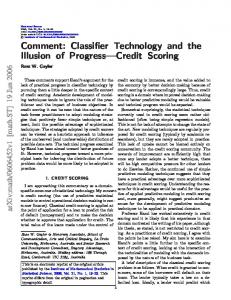
Results and Discussion NCAPS Item-Stem Exposure To investigate stem exposure within the current data set, the authors generated histograms of exposure frequency across the 10 NCAPS traits in the database. For each trait in Figure 2, the
Downloaded from apm.sagepub.com at RICE UNIV on February 9, 2015
148
Applied Psychological Measurement 39(2)
Adaptability/Flexibility (191 stems)
Achievement (108 stems) 40%
50%
40%
Percent
Percent
30%
30%
20%
20%
10% 10%
1.00
2.00
3.00
1.00
4.00
Item exposure over total item exposures by domain for ADF
3.00
4.00
Dependability (185 stems)
50%
50%
40%
40%
30%
30%
Percent
Percent
Attention to Detail (164 stems)
20%
2.00
Item exposure over total item exposures by domain for AV
20%
10%
10%
1.00
2.00
3.00
1.00
4.00
2.00
3.00
4.00
Item exposure over total item exposures by domain for ADL
Item exposure over total item exposures by domain for DEP
Dutifulness/Integrity (152 stems)
Stress Tolerance (119 stems) 30%
20%
30%
Percent
Percent
40%
20%
10% 10%
0% 1.00
2.00
3.00
4.00
1.00
5.00
2.00
3.00
4.00
Item exposure over total item exposures by domain for DUT
Item exposure over total item exposures by domain for ST
Social Orientation (114 stems)
Vigilance (106 stems)
30%
Percent
Percent
30%
20%
20%
10%
10%
0%
0% 1.00
2.00
3.00
1.00
4.00
2.00
3.00
4.00
Item exposure over total item exposures by domain for SO
Item exposure over total item exposures by domain for VIG
Self-Reliance (199 stems)
Willingness to Learn (156 stems)
50%
40%
Percent
Percent
40%
30%
20%
30%
20%
10%
10%
1.00
2.00
3.00
4.00
Item exposure over total item exposures by domain for SRL
1.00
2.00
3.00
4.00
Item exposure over total item exposures by domain for WTL
Figure 2. Exposure of NCAPS stems across traits. Note. The graphs below provide (a) stem exposure rates on the x-axis and (b) percentage of stems with that exposure rate on the y-axis. Across facets, most stems are exposed less than 0.25% of the time, but some stems are exposed up to 4% of the time. NCAPS = Navy Computer Adaptive Personality Scales.
Downloaded from apm.sagepub.com at RICE UNIV on February 9, 2015
Oswald et al.
149
x-axis represents the percentage of time that a stem was exposed across all NCAPS administrations in the data set, and the y-axis represents the percentage of NCAPS stems that demonstrated each percentage of exposure. Thus, the figure indicates that 70% to 80% of stems for a trait are exposed less than 1% of the time; however, some stems are exposed 3% to 4% of the time, and generally, this happens more often for those NCAPS traits with smaller banks of stems available (e.g., Achievement, Vigilance) than for other traits with larger banks (e.g., Adaptability, SelfReliance). Overall, the authors view the range of differential stem exposure to be acceptable, and the stems’ random positioning (top vs. bottom) and flexible pairing (with many other possible trait-relevant stems) may reduce any negative effect of these exposure rates even further.
IRT-EAP Scoring Versus Simpler Scoring Procedures In addition to the previous analysis that are relevant to the reliability and stability of the NCAPS trait scores, the authors also sought to determine whether the complex IRT-based scoring that leads to EAP estimates could be replaced by a much simpler scoring procedure that might yield personality trait that are similar to (if not essentially the same as) the EAPs. As a preface, note that in NCAPS, the IRT method pairs stems together to form an item by using average SME ratings as the trait level for each stem, along with the test taker’s current estimated EAP score on a trait. IRT-based empirical estimates of each stem’s trait level could have been used instead of SME ratings (because IRT scales examinees and items simultaneously); however, recent research found the two approaches to correlate over .90 and up to .97 (Stark, Chernyshenko, & Guenole, 2011). Two alternative methods of scoring were investigated; they are much simpler than IRT-based EAP scoring and will be examined individually and jointly. The first method of scoring is called the stem-level scoring method, best illustrated by example: Take the NCAPS items reflecting the personality trait of Self-Reliance. Each item has a pair of Self-Reliance stems, where one stem is higher on the trait than the other as determined by SME ratings. Under the stem-level scoring method, examinee’s Self-Reliance score is the mean of the SME ratings for those SelfReliance stems that were selected. Thus, if the stem with the higher SME rating were always selected for each item, that examinee would receive a very extreme score, though, of course, most people do not score at the extremes. The second method of scoring is called the dichotomous scoring method, awarding a test taker 1 point for endorsing the higher level stem in a pair and 0 points for the lower level stem, then averaging across the number of items responded to for the given trait. The score given under this method, then, is literally the proportion of the time that a test taker endorsed the stem in the item that had the higher SME level. It follows that test takers who always select the stem with the higher level of Self-Reliance would receive a score of 1. Most scores, however, will fall between 0 and 1. A fundamental way to think of stem-level scoring versus dichotomous scoring, then, is to think of stem-level scoring as an absolute scoring method (i.e., How trait-relevant is each stem that the test-taker selected, as judged by SMEs?), whereas dichotomous scoring is a relative scoring method (i.e., Was each stem that the test-taker selected more trait-relevant than the stem with which it was paired?). Adaptive IRT methods attempt to balance both ideas. In the IRT-scoring framework, the information provided by a paired item tends to increase in direct proportion to the distance between the stems (Stark & Drasgow, 2002). If this principle is taken to its extreme, then the most useful items across all test takers are those that pair stems at the high end of the personality trait continuum with stems at the low end. Most mean SME ratings of NCAPS stems, in fact, fall at either the upper and lower ends of each continuum of the 12 traits. However, in addition to these types of items, the adaptive nature of the NCAPS test can lead to creating
Downloaded from apm.sagepub.com at RICE UNIV on February 9, 2015
150
Applied Psychological Measurement 39(2)
Table 1. IRT-EAP Scores Correlated With Stem-Level Scores and With Dichotomous Scores (N = 8,956).
ADF ADL AV DEP DUT SO SRL ST VIG WTL
ADF
ADL
AV
DEP
.63/.81 .19 .21 .20 .15 .19 .08 .24 .20 .21
.30 .68/.83 .26 .36 .23 .15 .04 .20 .30 .24
.35 .39 .52/.77 .21 .15 .12 .09 .19 .20 .18
.30 .51 .37 .66/.87 .24 .13 .03 .20 .28 .23
DUT
SO
SRL
.24 .32 .11 .34 .19 .07 .27 .20 .17 .38 .21 .09 .55/.77 .21 .00 .09 .59/.82 2.12 .01 2.06 .61/.80 .11 .12 .09 .16 .11 .08 .15 .14 .00
ST
VIG
WTL
.40 .29 .31 .35 .21 .24 .14 .69/.87 .19 .19
.32 .45 .37 .48 .31 .22 .14 .36 .51/.88 .18
.35 .34 .32 .38 .30 .26 .02 .34 .35 .63/.82
Note. Stem-level correlations on lower diagonal (and on left in boldface). Dichotomous correlations on upper diagonal (and on right in boldface). Correlations with an absolute value ..01 are statistically significant (p \ .01). IRT-EAP = item response theory–Expected A Posteriori; ADF = Adaptability/Flexibility; ADL = Attention to Detail; AV = Achievement; DEP = Dependability; DUT = Dutifulness/Integrity; SO = Social Orientation; SRL = Self-Reliance; ST = Stress Tolerance; VIG = Vigilance; WTL = Willingness to Learn.
items with stems whose levels are closer to the person’s estimated EAP; this might be especially useful when the test taker’s EAP is getting increasingly reliable, and these items tailored to the estimated EAP can help refine it further. But there is a possible trade-off: If the usefulness of stems paired together from the extremes of the trait is much more informative than the usefulness of adapting items (stem pairs) to a test taker’s given EAP, then both stem scoring and dichotomous scoring should serve as highly useful alternatives to EAP scoring. Conversely, if item stems need to be tailored to an EAP, then these two simpler scoring methods just described may offer less benefit. It is this empirical question that the present authors explored at a general level, but future research could conduct specific analyses that examine the distance between stems more closely. Tables 1 and 2 provide correlations between IRT-based EAP scoring, stem-level scoring, and dichotomous scoring methods, yielding some revealing patterns of relationship. Table 1 (lower diagonal of the matrix) shows that EAP scoring and stem-level scoring demonstrate high levels of convergence on their corresponding traits, with correlations ranging between .51 and .69. Also, these correlations are high when compared with discriminant correlations that correlate the different scores for non-corresponding traits; those correlations range between -.06 and .36, with most correlations less than .20. Furthermore, as will be shown next, the results correlating dichotomous scoring with the EAPs indicate that the directions of the chosen item stems matter just as much as their levels. Table 1 (upper diagonal of the matrix) also summarizes the correlations between IRT-based EAP scoring with dichotomous scoring. Here, the convergent correlations between corresponding traits are between .77 and .88—high in absolute magnitude and higher than the discriminant correlations (most of these being less than .35). Furthermore, these convergent correlations are also higher than the convergent correlations between EAP scoring and stem-level scoring, even though dichotomous scoring is based on coarser data than the stem-level scores. These correlations might be high because, as mentioned, stem levels tend to be far apart. The implications for IRT-based EAP scoring converging with both stem-level scoring and dichotomous scoring methods are limited when each source of convergence is examined independently. Considering them jointly, one learns that these scoring methods are not only relatively independent from one another; together they predict nearly all the variance in EAP scores for a given NCAPS trait. More specifically, Table 2 reports low correlations between
Downloaded from apm.sagepub.com at RICE UNIV on February 9, 2015
Oswald et al.
151
Table 2. Correlation Between 10 NCAPS Traits: Stem-level Scores (rows) Versus Dichotomous Scores (columns; N = 8,956).
ADF ADL AV DEP DUT SO SRL ST VIG WTL
ADF
ADL
AV
DEP
DUT
SO
SRL
ST
VIG
WTL
.08 .17 .14 .15 .08 .14 .07 .19 .11 .16
.18 .15 .26 .14 .07 .03 .14 .15 .17
2.12 .17 .08 .08 .10 .13 .11 .13
.23 .16 .08 .04 .18 .18 .19
2.07 .09 .00 .10 .09 .13
.05 2.05 .13 .08 .13
.04 .06 .04 2.02
.26 .13 .16
.06 .15
.10
Note. Correlations with an absolute value ..01 are statistically significant (p \ .01). Convergent correlations are in boldface on the main diagonal. NCAPS = Navy Computer Adaptive Personality Scales; ADF = Adaptability/Flexibility; ADL = Attention to Detail; AV = Achievement; DEP = Dependability; DUT = Dutifulness/Integrity; SO = Social Orientation; SRL = Self-Reliance; ST = Stress Tolerance; VIG = Vigilance; WTL = Willingness to Learn.
Table 3. Stem-Level Scores and Dichotomous Scores Predicting Variance in IRT-EAP Scores (N = 8,956).
ADF ADL AV DEP DUT SO SRL ST VIG WTL
rEAP-level (Table 1)
rEAP-dichot (Table 1)
rdichot-level (Table 2)
R2level
R2dichot
R2both
.63 .68 .52 .66 .55 .59 .61 .69 .51 .63
.81 .83 .77 .87 .77 .82 .80 .87 .88 .82
.08 .18 2.12 .23 2.07 .05 .04 .26 .06 .10
.40 .46 .27 .44 .30 .35 .37 .48 .26 .40
.66 .69 .59 .76 .59 .67 .64 .76 .77 .67
.98 .98 .97 .98 .96 .97 .97 .99 .98 .98
Note. All correlations and R2 values are statistically significant (p \ .01). IRT-EAP = item response theory–Expected A Posteriori; dichot = dichotomous scores; level = stem-level scores; ADF = Adaptability/Flexibility; ADL = Attention to Detail; AV = Achievement; DEP = Dependability; DUT = Dutifulness/Integrity; SO = Social Orientation; SRL = SelfReliance; ST = Stress Tolerance; VIG = Vigilance; WTL = Willingness to Learn.
simple-scoring methods, with correlations on corresponding traits ranging from 2.07 to .26. This is clearly indicative of two different simple methods for scoring NCAPS, yet the methods both correlate highly with EAP scoring. Thus, the EAP scoring procedure accounts for not only the absolute level of the item stems (as in stem-level scoring) but also its relative level (as in dichotomous scoring), due to the fact that the stems are presented to the test taker in pairs. Table 3 indicates that both contribute uniquely to EAP scoring, yet together account for 95% to 99% of the variance in EAP scoring. Additional refined analyses might investigate the spacing or distance between the levels of the stems that are paired together to determine how strongly stem distances for each item is related to stem-level scoring, dichotomous scoring, and the accuracy of the test taker’s EAP (e.g., as measured through the PSD or through other simpler methods).
Downloaded from apm.sagepub.com at RICE UNIV on February 9, 2015
152
Applied Psychological Measurement 39(2)
Final Considerations This article concludes with two considerations. First, the comparability between methods might be, at least to some extent, affected by the fact that the IRT method itself was used to select (adapt) which items were administered. That said it is hard to imagine that simple scoring and IRT scoring would not be highly correlated otherwise. At the very least, this is an important empirical question, given the current strong relationships between scoring methods found in the present study. Furthermore, other personality measures, multidimensional IRT methods, different samples and criteria, and innovative computer simulations can continue to investigate whether the complexity of IRT-based item selection (and not just item scoring) in NCAPS is a necessary benefit over simpler test forms, such as if examinees were to receive unique sets of items independent of their EAPs (e.g., everyone receives items containing stem pairs with levels always at the opposite extremes). Second, detailed information at the item level—such as criterion-related validity and subgroup mean differences—might inform future algorithms determining the number and type of items administered adaptively for each NCAPS trait. For NCAPS, there may be a larger or smaller number of items suggested for each trait, beyond which additional items add little to criterion-related validity (Houston et al., 2006, Chapter 5; Schneider et al., 2009). Several different IRT-scoring and simple-scoring models might be compared with one another as well in this context, similar to what has been done when comparing ideal-point with dominance IRT models (e.g., Stark, Chernyshenko, Drasgow, & Williams, 2006). The literature on IRT generally suggests that trait-level estimation of individuals using the simpler classical test theory (CTT) approach (e.g., operationalizing a trait score as the average response across relevant items) often correlates with its more complex IRT counterpart as high as .97 and even higher (see Embretson & Reise, 2000; Fan, 1998; Thorndike, 1982). Likewise in the current context with NCAPS, the authors conclude that IRT-driven test scoring is certainly no worse than simpler methods but may not always be decisively better (see Oswald & Schell, 2010; Roberts, Laughlin, & Wedell, 1999, for relevant discussion). Thus, when computerized tests are unavailable, then it is possible that simple CTT-driven approaches to item selection and item scoring may do no worse, which is heartening as a matter of convenience. This fact also paves the way for additional psychometric research to understand more specifically where the benefits of IRT item scaling, selection, and scoring reside in the context of unfolding models for computerized adaptive personality measures. Declaration of Conflicting Interests The author(s) declared no potential conflicts of interest with respect to the research, authorship, and/or publication of this article.
Funding The author(s) disclosed receipt of the following financial support for the research, authorship, and/or publication of this article: This research was conducted under the support of Navy Personnel Research, Studies and Technology (NPRST, Millington, Tennessee; Contract N00140-07-D-0015). Financial support received from Office of Naval Research Grant ONR BAA #05-023.
References Bartram, D. (2007). Increasing validity with forced-choice measurement formats. International Journal of Selection and Testing, 15, 263-272.
Downloaded from apm.sagepub.com at RICE UNIV on February 9, 2015
Oswald et al.
153
Brown, A., & Bartram, D. (2009). Development and psychometric properties of OPQ32r: Supplement to the OPQ32 technical manual. Thames Ditton, England: SHL Group. Campbell, J. P., Hanson, M. A., & Oppler, S. H. (2001). Modeling performance in a population of jobs. In J. P. Campbell & D. K. Knapp (Eds.), Exploring the limits of personnel selection and classification (pp. 307-333). Mahwah, NJ: Erlbaum. Chang, H.-H., & Ying, Z. (2007). To weight or not to weight? Balancing influence of initial items in adaptive testing. Psychometrika, 73, 441-450. Coombs, C. H. (1950). Psychological scaling without a unit of measurement. Psychological Review, 57, 145-158. DeSarbo, W. S., & Hoffman, D. L. (1987). Constructing MDS joint spaces from binary choice data: A multidimensional unfolding threshold model for marketing research. Journal of Marketing Research, 24, 40-54. Drasgow, F., Stark, S., Chernyshenko, O. S., Nye, C. D., Hulin, C. L., & White, L. A. (2012). Development of the Tailored Adaptive Personality Assessment System (TAPAS) to support Army selection and classification decisions (U.S. Army Research Institute for the Behavioral and Social Sciences, Technical Report 1311). Retrieved from http://www.dtic.mil/cgi-bin/GetTRDoc?AD=ADA564422 Embretson, S. E., & Reise, S. P. (2000). Item response theory for psychologists. Mahwah, NJ: Erlbaum. Fan, X. (1998). Item response theory and classical test theory: An empirical comparison of their item/ person statistics. Educational and Psychology Measurement, 58, 357-381. Ferrando, P. J. (2006). Two item response theory models for analyzing normative forced-choice personality items. British Journal of Mathematical and Statistical Psychology, 59, 379-395. Houston, J. S., Borman, W. C., Farmer, W. L., & Bearden, R. M. (2006). Development of the Navy Computer Adaptive Personality Scales (NCAPS) (NPRST-TR-06-2). Millington, TN: Navy Personnel Research, Studies, and Technology. Jackson, D. N., Wroblewski, V. R., & Ashton, M. C. (2000). The impact of faking on employment tests: Does forced choice offer a solution? Human Performance, 13, 371-388. Markon, K. E., Krueger, R. F., & Watson, D. (2005). Delineating the structure of normal and abnormal personality: An integrative hierarchical approach. Journal of Personality and Social Psychology, 88, 139-157. Oswald, F. L., & Schell, K. L. (2010). Developing and scaling personality measures: Thurstone was right—But so far, Likert was not wrong. Industrial and Organizational Psychology, 3, 481-484. Pitt, M. A., & Myung, I. J. (2002). When a good fit can be bad. Trends in Cognitive Sciences, 6, 421-425. Preacher, K. (2006). Quantifying parsimony in structural equation modeling. Multivariate Behavioral Research, 41, 227-259. Roberts, J. S., Laughlin, J. E., & Wedell, D. H. (1999). Validity issues in Likert and Thurstone approaches to attitude measurement. Educational and Psychological Measurement, 2, 211-233. Schneider, R. J., McLellan, R. A., Kantrowitz, T. M., Houston, J. S., & Borman, W. C. (2009). Criterionrelated validity of an innovative CAT-based personality measure. In D. J. Weiss (Ed.), Proceedings of the 2009 GMAC Conference on Computerized Adaptive Testing. Retrieved from http:// publicdocs.iacat.org/cat2010/cat09schneider.pdf Stark, S., Chernyshenko, O. S., Drasgow, F., & Williams, B. A. (2006). Examining assumptions about item responding in personality assessment: Should ideal point methods be considered for scale development and scoring? Journal of Applied Psychology, 91, 25-39. Stark, S., Chernyshenko, O. S., & Guenole, N. (2011). Can subject matter experts’ ratings of statement extremity be used to streamline the development of unidimensional pairwise preference scales? Organizational Research Methods, 14, 256-278. Stark, S., & Drasgow, F. (2002). An EM approach to parameter estimation for the Zinnes and Griggs paired comparison IRT model. Applied Psychological Measurement, 26, 208-227. Thorndike, R. L. (1982). Educational measurement: Theory and practice. In D. Spearritt (Ed.), The improvement of education and psychology: Contributions of latent trait theory (pp. 3-13). Melbourne: Australian Council for Educational Research. Thurstone, L. L. (1927). A law of comparative judgment. Psychological Review, 34, 273-286.
Downloaded from apm.sagepub.com at RICE UNIV on February 9, 2015
154
Applied Psychological Measurement 39(2)
Vrieze, S. I. (2012). Model selection and psychological theory: A discussion of the differences between the Akaike Information Criterion (AIC) and the Bayesian Information Criterion (BIC). Psychological Methods, 17, 228-243. Wilson, M. (2003). On choosing a model for measuring. Methods of Psychological Research Online, 8, 1-22. Zinnes, J. L., & Griggs, R. A. (1974). Probabilistic, multidimensional unfolding analysis. Psychometrika, 39, 327-335.
Downloaded from apm.sagepub.com at RICE UNIV on February 9, 2015