Journal of Rehabilitation Research and Development Vol. 40, No. 5, September/October 2003 Pages 407–414
Comparison of breathing patterns during exercise in patients with obstructive and restrictive ventilatory abnormalities Margaret Nield, PhD; Ashim Arora, MD; Kathleen Dracup, DNS; Guy W. Soo Hoo, MD, MPH; Christopher B. Cooper, MD VA Greater Los Angeles Healthcare System, Los Angeles, CA; Departments of Medicine and Physiology, UCLA School of Medicine, University of California, Los Angeles, CA; University of California, San Francisco, CA
further insight into the pathophysiology of the two conditions and the contribution of dynamic hyperinflation to dyspnea.
Abstract—Patients with obstructive and restrictive ventilatory abnormalities suffer from exercise intolerance and dyspnea. Breathing pattern components (volume, flow, and timing) during incremental exercise may provide further insight in the role played by dynamic hyperinflation in the genesis of dyspnea. This study analyzed the breathing patterns of patients with obstructive and restrictive ventilatory abnormalities during incremental exercise. It also explored breathing pattern components with dyspnea at maximum oxygen uptake (VO2 max). Twenty patients, thirteen obstructive patients (forced expiratory volume 38% ± 13% predicted, forced expiratory volume in 1 s/forced vital capacity ratio 39 ± 8%), and seven restrictive patients (forced vital capacity 55 ± 16% predicted, forced expiratory volume in 1 s/forced vital capacity ratio 84% ± 11%) performed symptom-limited incremental exercise tests on a cycle ergometer with breath-by-breath determination of ventilation and gas exchange parameters. Breathing patterns were analyzed at baseline, 20, 40, 60, 80, and 100 percent of VO2 max. Dyspnea was measured at end-exercise with a 100 mm visual analogue scale. The timing ratio of inspiratory to expiratory time (TI /TE) and the flow ratio of inspiratory flow to expiratory flow ratio ( V· I / V· E ) were different (p < 0.008) between obstructive and restrictive patients at all exercise intensity levels. The timing components of expiratory time (TE) and inspiratory time to total time (TITTOT) were significantly different (p < 0.008) at baseline and maximum exercise. Dyspnea scores were not significantly different. For obstructive patients, correlations were noted between TI /TE, V· I / V· E , TITTOT and dyspnea (p < 0.05). Breathing pattern-timing components, specifically TI /TE, in patients with obstructive and restrictive ventilatory abnormalities during exercise provided
Key words: breathing pattern, dyspnea, exercise, obstructive ventilatory abnormality, restrictive ventilatory abnormality.
INTRODUCTION Patients with obstructive and restrictive ventilatory abnormalities suffer from dyspnea and exercise limitation. Dyspnea, a complex symptom with multilayered pathophysiology [1], remains the most distressing symptom for those with progressive obstructive and restrictive lung disease. Furthermore, dyspnea is debilitating with
Abbreviations: ANOVA = analysis of variance, CI = confidence interval, COPD = chronic obstructive pulmonary disease, VAS = visual analogue scale, VO2 max = maximum oxygen uptake. This material was based on work supported in part by T32 NR 07072 and Rehabilitation Research Career Development Award D0926CD, Department of Veterans Affairs. Address all correspondence and requests for reprints to Margaret Nield, VA West Los Angeles Healthcare Center, Pulmonary Section 111Q, 11301 Wilshire Boulevard, Los Angeles, CA 90073; work: 310-268-4593; home: 310-393-4769; fax: 310246-4206; email:
[email protected]. 407
408 Journal of Rehabilitation Research and Development Vol. 40, No. 5, 2003
significant impact on health-related quality of life [2]. Dyspnea management has focused on pharmacologic therapies, with limited benefit. Nonpharmacologic approaches, such as breathing strategies and positioning, are recognized for their capability to provide dyspnea relief but are underused [3]. The breathing patterns of patients with obstructive and restrictive lung disease during exercise are likely to be important contributory factors in the genesis of dyspnea. Both groups are ventilatory-limited during exercise with high breathing frequency (fR) and high minute ventilation (VE). Obstructive patients are able to maintain or increase their tidal volume (VT), while restrictive patients quickly become tachypneic with their VT encroaching on their inspiratory capacity. Cardiac status does not usually limit exercise performance. This study analyzed the breathing patterns of patients with obstructive and restrictive ventilatory abnormalities during incremental exercise for a better understanding of the relationships among ventilatory abnormalities, breathing pattern changes with dynamic hyperinflation, and dyspnea. We reviewed our experience with these two groups of patients during exercise, with a focus on the timing and flow parameters of breathing patterns. We then explored relationships between these parameters and dyspnea.
MATERIALS AND METHODS Study Subjects The inclusion criteria for patients with an obstructive ventilatory abnormality were a forced expiratory volume in 1 s of less than 70 percent of the predicted value and forced expiratory volume in 1 s/forced vital capacity ratio less than 70 percent [4]. The inclusion criteria for patients with a restrictive ventilatory abnormality were a forced vital capacity of less than 70 percent of the predicted value and forced expiratory volume in 1 s/forced vital capacity ratio greater than 70 percent [4]. These values represent standard spirometric criteria for obstructive and restrictive ventilatory defects. The institutional review board approved the study as an analysis of existing data. Study Design This study involved a consecutive retrospective review of maximal exercise tests performed in the clinical exercise physiology laboratory at a large university-based hospital in southern California over a period of
3 years (1995–1998). Each of these studies provided an array of physiological variables with which to evaluate the subject in terms of aerobic capacity, cardiovascular response, ventilatory response, and gas exchange response to symptom-limited maximal exercise. Each exercise study was preceded by spirometry and measurement of maximal voluntary ventilation. Patients with only obstructive or restrictive ventilatory abnormalities were selected for breathing pattern analysis. Minimal duration of the exercise phase from the end of warm-up to the start of recovery was set at 4 min to allow sufficient data points for analysis. Methods The symptom-limited maximal incremental exercise tests were all performed with the use of a standard protocol administered by the same staff on an electromagnetically braked cycle ergometer (Ergoline, 800S). This protocol consisted of a period of equilibration at rest, breathing through the mouthpiece, followed by unloaded pedaling for 3 min, then a ramp increase in work rate to symptom-limited maximum. The rate of work rate increment was determined at the time of testing for each individual based on clinical evaluation of his or her level of impairment or physical fitness with the goal of obtaining 10 min of incremental exercise data. Ventilation and gas exchange were continuously measured with the use of a metabolic cart (Sensormedics 2900). The physiological indexes were displayed graphically and printed in tabular format for subsequent analysis. Immediately after cessation of exercise, breathlessness was measured with a horizontal 100 mm visual analogue scale (VAS). The line was anchored at one end (0 mm) with the words “not at all breathless” and at the other end (100 mm) with the words “extremely breathless.” All subjects were asked to mark the line at a point that best described their breathlessness at maximum exercise. The psychometric properties of the VAS for measuring breathlessness have been established in similar clinical populations [5,6]. Analysis Breathing patterns were assessed in terms of VE, VT, fR, inspiratory time, expiratory time, inspiratory time to expiratory time, total breath time, inspiratory time to total time, mean inspiratory flow, mean expiratory flow, and mean inspiratory flow to expiratory flow. These variables were determined during unloaded pedaling and at 20, 40,
409 NIELD et al. Breathing patterns during exercise
60, 80, and 100 percent of VO2 max by averaging three consecutive breaths at each level of exercise intensity. Descriptive and inferential statistical analyses were performed with SPSS, (Statistical Package for the Social Sciences) version 10.0 [7]. The timing, volume, and flow components of the breathing pattern were compared between obstructive and restrictive patients at different exercise intensities with the use of analysis of variance (ANOVA). Bonferroni corrections were used to account for multiple comparisons at six exercise intensities. Pearson product-moment correlation was used to explore the relationships between indexes of breathing pattern and dyspnea. Breathing pattern components at maximal exercise that might explain the variance in dyspnea were explored with multiple linear regressions.
RESULTS Data were obtained from 13 patients with obstructive ventilatory abnormalities and 7 patients with restrictive ventilatory abnormalities. The selected patients were considered “ventilatory limited” as defined by the conventional criterion of their maximum minute ventilation being within 15 L·min–1 of their previously measured maximal voluntary ventilation [8]. Table 1 shows demographic and clinical information for these subjects. Smoking-related chronic obstructive pulmonary disease (COPD) was the clinical diagnosis for all patients with Table 1. Demographic and physiological characteristics of subjects. Values indicate mean ± standard deviation.
Characteristics Number (male/female) Age (yr) MVV (L·min–1) FEV1 (L·min–1) FEV1 % Predicted FEV1/FVC % FVC % Predicted VO2 max (L·min–1) VO2 max % Predicted
Obstructive 13 (6/7) 68 ± 5 41 ± 20 0.97 ± 41 38 ± 13 39 ± 8 69 ± 18 0.95 ± 0.40 55 ± 22
Restrictive 7 (2/5) 68 ± 19 57 ± 15 1.46 ± 40 66 ± 23 84 ± 11 55 ± 16 0.80 ± 0.20 56 ± 22
MVV = maximum voluntary ventilation FEV1 % predicted = forced expiratory volume in 1 s percent predicted FEV1/FVC % = forced expiratory volume in 1 s/forced vital capacity ratio FVC % predicted = forced vital capacity percent predicted VO2 max = maximal oxygen uptake
obstructive ventilatory abnormalities. The clinical diagnoses for the restrictive ventilatory abnormalities were pulmonary fibrosis, either idiopathic or related to scleroderma or radiotherapy for lung cancer. The average duration of the exercise phase from the end of warm-up to the start of recovery was 5.8 min for the obstructive patients and 5.6 min for the restrictive patients. Breathlessness was the first stated reason for exercise termination for 11 of 13 obstructive patients and 4 of 7 restrictive patients. Other reasons for exercise termination were fatigue (generalized and leg fatigue), anxiety, and bigeminy. The volume, flow, and timing components of the breathing pattern were compared during unloaded pedaling and at five levels of exercise intensity. The traditional parameters of breathing pattern, i.e., V· E , V· T , and fR did not distinguish between the two patient groups (Table 2). During incremental exercise, while VT tended to remain smaller and fR higher in the restrictive group, the differences were generally not statistically significant. Comparison of VE shows the similar ventilatory response between the two groups (Figure 1). Table 3 shows the flow components of breathing pattern along with inspiratory flow/expiratory flow ratio ( V· I / V· E ). Neither the inspiratory nor the expiratory flows differed between the two groups, but V· I / V· E was distinctly different. The timing components of the breathing pattern are shown in Table 4. The clearest distinction between the obstructive and restrictive groups can be seen in terms of V· I / V· E and inspiratory to expiratory time (TI /TE). Both ratios were consistently different at unloaded pedaling and all levels of exercise intensity. In Figure 2, the differences in TI /TE were most pronounced at 80 percent (0.49, 95% CI [confidence interval] 0.14 to 0.72, p = 0.002) and 100 percent (0.53, 95% CI 0.30 to 0.83, p < 0.000) of VO2 max. The differences in TI /TE ratios between the two groups largely are due to longer expiratory time in the obstructive group as seen in Table 4. Dyspnea scores at maximum exercise were not significantly different (p = 0.39) between obstructive patients (mean ± SEM [standard error of mean] 77 ± 5) and restrictive patients (68 ± 11). Table 5 shows correlation coefficients for the various parameters of breathing pattern and dyspnea at maximum exercise. The timing components, TI /TE and TI /TTOT, showed a significant negative correlation with dyspnea in the obstructive patients (r = 0.57, p = 0.04), and a positive correlation with V· I / V· E . By multiple linear regression analysis, TI /TE and VT at maximal exercise accounted for 43 percent of
410 Journal of Rehabilitation Research and Development Vol. 40, No. 5, 2003
Table 2. Breathing pattern analysis at baseline, 20, 40, 60, 80, and 100 percent VO2 for patients with obstructive (O) or restrictive (R) ventilatory abnormalities. Traditional breathing pattern parameters are minute ventilation (VE ) , breathing frequency (fR), and tidal volume (VT). Values are mean ± standard error of the mean.
% VO2 max Base 20 40 60 80 100
VE (L·min–1) O 19.8 ± 2.2 23.6 ± 1.8 27.0 ± 2.2 27.8 ± 3.1 30.4 ± 3.8 39.8 ± 4.2
fR (min–1) R
15.4 ± 2.2 20.8 ± 3.2 24.1 ± 3.0 27.4 ± 3.6 33.0 ± 4.7 37.4 ± 4.9
VT (L)
O
R
O
R
22 ± 1 24 ± 1 25 ± 1 27 ± 1 29 ± 2 32 ± 2*
24 ± 2 30 ± 3 32 ± 3 32 ± 3 37 ± 3 41 ± 2
0.92 ± 0.08 1.01 ± 0.10 1.09 ± 0.10 1.19 ± 0.12 1.23 ± 0.12 1.23 ± 0.11
0.64 ± 0.07 0.70 ± 0.07 0.77 ± 0.07 0.86 ± 0.09 0.90 ± 0.10 0.91 ± 0.10
Base = unloaded pedaling *p < 0.05 with Bonferroni corrections for six comparisons (critical value of p = 0.008) VO2 max = maximal oxygen uptake
the variance in dyspnea for obstructive patients (R2 = 0.43, p = 0.06). The same model was not significant for the restrictive patients (R2 = 0.30, p = 0.48).
DISCUSSION This study highlights the differences in breathing patterns during incremental exercise between patients with obstructive and restrictive ventilatory abnormalities. The
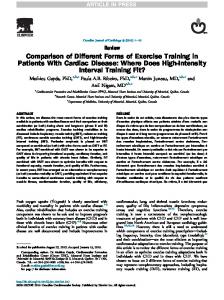
Figure 1. Relationship between minute ventilation (VE) and exercise intensity relative to maximum oxygen (% VO2 max) subjects with obstructive (∆) and restrictive (!) ventilatory abnormalities. Reference values of normal ( ) subjects (based on unpublished laboratory data) are shown with their regression (--).
°
differences were most noticeable in examination of the timing components of breathing patterns. The inspiratory to expiratory ratio and flow ratio differences were significantly different at all levels of exercise, with the magnitude of difference most pronounced at maximal exercise. For patients with obstructive ventilatory abnormalities, TI/TE was consistently lower and V· I / V· E was consistently higher than for those with restrictive ventilatory abnormalities. The V· I / V· E is similar to TI /TE ; it incorporates both inspiratory and expiratory timing parameters. It highlights the contribution of volume as well and thus is a helpful indicant of the overall changes that occur with increasing exercise intensity. The TI /TTOT data show consistently lower proportion of inspiratory time in relation to total breath cycle time (below 0.5) for obstructive patients as compared to the restrictive patients who spend a greater proportion of the breath cycle in inspiration. The breathing patterns that we observed for the obstructive group generally confirm findings previously noted at rest and with increased workloads for those with COPD [9–12]. The changes in breathing pattern with incremental exercise include increased fR, modest changes in VT, shorter expiratory times, and doubling of flow rates. Interestingly, the conventionally studied breathing pattern components of VE, fR, and VT during incremental exercise did not demonstrate differences between conditions as well as the timing components. As seen in Figure 1, VE was comparable at each exercise intensity. Only fR at maximal exercise was significantly different (Table 2).
411 NIELD et al. Breathing patterns during exercise
Table 3. Ventilatory flow analysis at baseline, 20, 40, 60, 80, and 100 percent VO2 for patients with obstructive (O) or restrictive (R) ventilatory abnormalities. Values are mean ± standard error of the mean.
VT /TI (L·s–1)
% VO2 max
O
Base 20 40 60 80 100
R
0.80 ± 0.10 0.90 ± 0.10 1.05 ± 0.11 1.27 ± 0.13 1.37 ± 0.16 1.69 ± 0.19
V· I / V· E
VT /TE (L·s–1) O
0.47 ± 0.09 0.65 ± 0.15 0.82 ± 0.14 0.93 ± 0.14 1.10 ± 0.19 1.16 ± 0.16
R
0.58 ± 0.05 0.67 ± 0.05 0.77 ± 0.07 0.86 ± 0.10 0.96 ± 0.12 1.12 ± 0.13
O
0.65 ± 0.09 0.81 ± 0.08 0.82 ± 0.06 0.92 ± 0.10 1.15 ± 0.15 1.36 ± 0.18
Base = unloaded pedaling < 0.05 with Bonferroni corrections for six comparisons (critical value of p = 0.008) < 0.01 with Bonferroni corrections for six comparisons (critical value of p = 0.002) VT /TI = inspiratory flow
R 0.13*
1.36 ± 1.39 ± 0.12* 1.47 ± 0.11* 1.66 ± 0.15* 1.55 ± 0.12* 1.55 ± 0.09†
0.76 ± 0.15 0.79 ± 0.16 0.97 ± 0.11 1.00 ± 0.08 0.95 ± 0.10 0.87 ± 0.06
VT/VE = expiratory flow V· I / V· E = inspiratory flow/expiratory flow VO2 max = maximal oxygen uptake
*p †p
Table 4. Ventilatory timing analysis at baseline, 20, 40, 60, 80, and 100 percent VO2 for patients with obstructive (O) or restrictive (R) ventilatory abnormalities. Values are mean ± standard error of the mean. % VO2 max
TI (s)
TE (s) O
TI /TE R
O
TTOT (s) R
TI / TTOT
O
R
O
R
Base
1.29 ± 0.12
1.55 ± 0.18
1.62 ± 0.11* 1.06 ± 0.15
0.82 ± 0.08* 1.65 ± 0.28
2.91 ± 0.18
2.61 ± 0.20
0.44 ± 0.02* 0.59 ± 0.04
20
1.21 ± 0.13
1.32 ± 0.22
1.49 ± 0.11
0.90 ± 0.10
0.77 ± 0.06* 1.54 ± 0.26
2.58 ± 0.17
2.21 ± 0.27
0.47 ± 0.04
0.58 ± 0.04
40
1.14 ± 0.15
1.04 ± 0.13
1.44 ± 0.11
0.96 ± 0.10
0.72 ± 0.06* 1.14 ± 0.15
2.47 ± 0.14
2.00 ± 0.21
0.46 ± 0.04
0.52 ± 0.03
60
1.01 ± 0.12
0.99 ± 0.10
1.44 ± 0.12
0.96 ± 0.09
0.67 ± 0.07* 1.05 ± 0.10
2.34 ± 0.13
1.95 ± 0.18
0.44 ± 0.05
0.51 ± 0.02
80
0.98 ± 0.11
0.88 ± 0.09
1.38 ± 0.16
0.81 ± 0.07
0.69 ± 0.05† 1.13 ± 0.12
2.25 ± 0.22
1.69 ± 0.15
0.45 ± 0.04
0.52 ± 0.02
100
0.75 ± 0.03
0.80 ± 0.03
1.17 ± 0.09* 0.69 ± 0.06
0.68 ± 0.05† 1.21 ± 0.12
1.92 ± 0.12
1.49 ± 0.08
0.40 ± 0.01† 0.54 ± 0.02
Base = unloaded pedaling < 0.05 with Bonferroni corrections for six comparisons (critical value of p = 0.008) < 0.01 with Bonferroni corrections for six comparisons (critical value of p = 0.002) TI = inspiratory time TE = expiratory time *p †p
A preferential increase in fR rather than VT in patients with restrictive ventilatory abnormalities has been previously noted [13,14]. Our restrictive patients with restrictive ventilatory abnormalities had smaller VT at baseline and tended to have higher fR during exercise as compared to those with obstructive ventilatory abnormalities. Presumably, adopting a more rapid, shallower breathing pattern optimizes work of breathing and helps avoid diaphragmatic muscle fatigue. As a consequence of the higher fR, the total breath time tended to be shorter compared to the patients with obstructive ventilatory abnormalities. Both inspiratory and expiratory times from 40 percent to maximal exercise were shorter in the restrictive group compared with the obstructive group. The timing difference was more pronounced for expiratory time. Shorter expiratory times com-
O
R
TI /TE = inspiratory time/expiratory time TTOT = total breath time (s) TI /TTOT = duty cycle VO2 max = maximal oxygen uptake
pared to inspiratory times in the restrictive group have been previously noted [14]. This difference may not be appreciated if only the duty cycle, TI /TTOT, is considered. When normal subjects exercise, VT increases both as a result of increased end-inspiratory lung volume and decreased end-expiratory lung volume. The fall in endexpiratory lung volume, which is a minor but important contribution to the increased VT, is thought to be facilitated by expiratory muscle recruitment. O’Donnell and Webb demonstrated normal breathing patterns and showed important differences in patients with COPD [15]. Increased airway resistance slows expiratory flow, prolonging lung emptying. Furthermore, airway collapse, especially in patients with emphysema, causes air trapping and prevents complete lung emptying. During exercise, as breath time shortens, insufficient time for expiration
412 Journal of Rehabilitation Research and Development Vol. 40, No. 5, 2003
Figure 2. Relationships between the ratio of inspiratory to expiratory time (TI / TE) and exercise intensity relative to maximum oxygen uptake (% VO2 max) in subjects with obstructive (∆) and restrictive (!) ventilatory abnormalities. Reference values of normal ( ) subjects (based on unpublished laboratory data) are shown with their regression line (--).
°
compounds these problems, resulting in dynamic hyperinflation as manifested by an increase in end-expiratory lung volume with increased end-inspiratory lung volume. This phenomenon is thought to contribute to exercise limitation by constraining the increase in VT and forcing operational lung volumes toward an unfavorable portion of the compliance curve for the respiratory system. The resulting increase in elastic work contributes to a vicious cycle of worsening breathing efficiency.
By contrast, in subjects with restrictive ventilatory abnormalities either because of reduced lung or chest wall compliance or because of respiratory muscle weakness, there may be insufficient time for adequate inspiration as fR increases and TTOT decreases. The decreased inspiratory flow (VT /TI) as compared to obstructive patients’ VT / TI reflects restricted lung expansion (Table 3). Marciniuk and colleagues found that end-expiratory lung volume did not fall significantly during exercise in interstitial lung disease [16]. Markovitz and Cooper drew attention to the changes in end-inspiratory and end-expiratory lung volumes with respect to the level of VE in patients with interstitial lung disease [17]. They identified a fall in endinspiratory lung volume and end-expiratory lung volume toward maximal exercise and referred to this phenomenon as “dynamic hypoinflation.” Dynamic hypoinflation, caused by inadequate time for lung inflation at a time of increased ventilatory demand, may limit exercise capacity and contribute to the sensation of dyspnea in those with restrictive ventilatory abnormalities. The timing components, TI /TE, V· I / V· E , and TI /TTOT, further underscore our current understanding of these exercise-associated changes in respiratory mechanics. Increases in dynamic hyperinflation for the obstructive patient are associated with proportionately slower expiratory flow rates as compared to inspiratory flow rates and would be manifested as increasing V· I / V· E . In restrictive patients, exercise is associated with increases in inspiratory flow, resulting in V· I / V· E ratios that approach unity and a TI /TTOT closer to 0.5. The assessment of the changes in end-inspiratory and end-expiratory lung volume observed in dynamic hyperinflation requires additional equipment and measurement, which is not usually performed in most
Table 5. Relationship of breathing pattern components with dyspnea at maximal exercise.
Ventilatory Abnormality
VE
VT
fR
TI
TE
TI /TE
–0.33
–0.13
–0.46
–0.02
0.42
–0.57* *
VT /TI
VT /TE
V· I / V· E
TTOT
TI /TTOT
0.33
–0.58*
–0.11
–0.48
0.59*
0.27
0.04
*
0.73
0.10
0.03*
0.49
0.12
0.31
–0.50
0.27
0.49
0.50
0.25
Obstructive r
0.26
0.67
0.12
0.96
0.15
0.04
r
0.21
0.04
0.22
–0.26
–0.56
0.48
–0.54
p
0.65
0.94
0.65
0.57
0.19
0.27
0.21
p Restrictive
VE = minute ventilation VT = tidal volume fR = breathing frequency TI = inspiratory time
TE = expiratory time TI /TE = inspiratory/expiratory time TTOT = total breath time V· I / V· E = inspiratory flow/expiratory flow
V· I / V· E = inspiratory flow/expiratory flow r = correlation coefficient p values = significance * p < 0.05
413 NIELD et al. Breathing patterns during exercise
exercise laboratories. These timing components could provide another avenue to assess these changes and is attractive given its derivation from current measures or derived parameters. We also compared breathing pattern parameters with dyspnea as quantified by VAS at maximum exercise. Significant correlations were found between dyspnea and the timing components of TI /TE and TI /TTOT as well as V· I / V· E for subjects with obstructive ventilatory abnormalities (p = 0.04). We did not find a significant relationship between mean expiratory flow and dyspnea as reported by Eltayara and colleagues in those with COPD [18]. These contradictory findings could be explained by the use of different methods for measuring expiratory flow and dyspnea. Eltayara and colleagues used an application of negative expiratory pressure to study expiratory flow at rest and measured dyspnea using a modified Medical Research Council dyspnea scale [18,19]. Our study derived mean expiratory and inspiratory flows from measured tidal volumes and the time components of the breath. We also found that while inspiratory flow rates were not associated with dyspnea, V· I / V· E was associated with dyspnea. To our knowledge, other investigators have not explored the relationship between TI /TE, V· I / V· E , and dyspnea. Studies of breathing pattern and dyspnea have implications for the teaching of breathing strategies. Since TI / TE and VT at maximal exercise explained 43 percent of the dyspnea variation for obstructive and not restrictive patients, the ventilatory disorder should direct the choice of breathing strategy. Prolonged expiratory times in relation to inspiratory times would likely decrease air trapping and reduce dynamic hyperinflation for those with obstructive ventilatory disorders and provide dyspnea relief. The focus on expiratory time may be more effective compared with the usual teaching instructions to increase VT or slow fR, since there would be direct emphasis on the breathing parameter more likely to bring dyspnea relief. Our findings suggest the need for further investigation of manipulation of the timing components of the breathing pattern during low-level exercise. Since dynamic hyperinflation is difficult to measure directly, use of noninvasive measures, such as the timing components of TI /TE and TI /TTOT, would be useful. The retrospective study design and the small number of subjects in each group limit the conclusions that can be drawn from this study. While the patients with ventilatory abnormalities were selected by pulmonary function crite-
ria, the groups were not matched based on gender or body mass index. Dyspnea was measured at maximum exercise only. The small number of subjects in each group may be responsible for Type II errors where there is insufficient power to detect a difference between groups, when such a difference might be present. For example, the expected differences in fR at baseline were not detected. However, despite the small number of subjects, differences were clearly present for TI /TE at all levels of exercise intensity studied.
CONCLUSIONS Patients with obstructive and restrictive ventilatory abnormalities have similar changes in VE , fR, and VT with incremental exercise. By contrast, analyses of the timing components of breathing pattern were consistently different between subjects with obstructive and restrictive ventilatory abnormalities. Diametrically opposite changes in TI /TE and V· I / V· E provide insight into their different pathophysiological mechanisms and highlight the contribution of dynamic hyperinflation in the genesis of dyspnea. Finally, we demonstrated a relationship between timing components and dyspnea at maximum exercise in subjects with obstructive ventilatory abnormalities.
REFERENCES 1. American Thoracic Society. Dyspnea: mechanisms, assessment, and management: a consensus statement—1998. Am J Respir Crit Care Med 1999;159:321–40. 2. Ferrer M, Alonso J, Morera J, Marrades RM, Khalaf A, Aguar MC, et al. Chronic obstructive pulmonary disease stage and health-related quality of life. Ann Int Med 1997; 127:1072–79. 3. Nield MA. Dyspnea self-management in African-Americans with chronic lung disease. Heart Lung 2000;29:50–55. 4. Morris JF. Spirometry in the evaluation of pulmonary function. West J Med 1976;125(2):110–18. 5. Gift AG. Visual analogue scales: measurement of subjective phenomena. Nsg Res 1989;38(5):286–88. 6. Adams L, Chronos N, Lane R, Guz A. The measurement of breathlessness induced in normal subjects: validity of two scaling techniques. Clin Sci 1985;69(1):7–16. 7. SPSS Inc. SPSS Advanced Statistics 10.0. Chicago: SPSS Inc., 1999. 8. Sue DY, Hansen JE. Normal values in adults during exercise testing. Clin Chest Med 1984;5:89–97.
414 Journal of Rehabilitation Research and Development Vol. 40, No. 5, 2003
9. Tobin MJ, Chadha TS, Jenouri G, Birch SJ, Gazeroglu HB, Sackner MA. Breathing patterns. 2. Diseased subjects. Chest 1983;84:286–94. 10. Dodd DS, Brancatisano T, Engel LA. Chest wall mechanics during exercise in patients with severe chronic airflow obstruction. Am Rev Resp Dis 1984;129:33–38. 11. Gallagher CG, Younes M. Breathing pattern during and after maximal exercise in patients with chronic obstructive lung disease, interstitial lung disease, and cardiac disease, and in normal subjects. Am Rev Res Dis 1986;133(4):581–86. 12. Vitacca M, Clini E, Bianchi L, Ambrosino N. Acute effects of deep diaphragmatic breathing in COPD patients with chronic respiratory insufficiency. Eur Resp J 1998;11:408–15. 13. Burdon JG, Killian KJ, Jones NL. Pattern of breathing during exercise in patients with interstitial lung disease. Thorax 1983;38:778–84. 14. Dimarco AF, Kelsen SG, Cherniack NS, Gothe B. Occlusion Pressure and breathing pattern in patients with interstitial lung disease. Am Rev Resp Dis 1983;127:425–30.
15. O’Donnell DE, Webb KA. Exertional breathlessness in patients with chronic airflow limitation. Am Rev Resp Dis 1993;148:1351–57. 16. Marciniuk DD, Stridhar G, Clemens RE, Zintel TA, Gallagher CG. Lung volumes and expiratory flow limitation during exercise in interstitial lung disease. J Appl Physiol 1994;77:963–73. 17. Markovitz GH, Cooper CB. Exercise and interstitial lung disease. Curr Opin Pulm Med 1998;4:272–80. 18. Eltayara L, Becklake MR, Volta CA, Milic-Emili J. Relationship between chronic dyspnea and expiratory flow limitation in patients with chronic obstructive pulmonary disease. Am J Respir Crit Care Med 1996;154:1726–34. 19. Fletcher CM, Ellmes PC, Wood CH. The significance of respiratory symptoms and the diagnosis of chronic bronchitis in a working population. Br Med J 1959;1:257–66.
Submitted for publication July 9, 2002. Accepted in revised form February 3, 2003.