RESEARCH ARTICLES
Comparison of data mining approaches for estimating soil nutrient contents using diffuse reflectance spectroscopy M. C. Sarathjith1, B. S. Das2,*, S. P. Wani3, K. L. Sahrawat3,† and A. Gupta2 1
International Crops Research Institute for the Semi-Arid Tropics, Bamako, BP-320, Mali Indian Institute of Technology Kharagpur, Kharagpur 721 302, India 3 International Crops Research Institute for the Semi-Arid Tropics, Patancheru, Hyderabad 502 324, India 2
Diffuse reflectance spectroscopy (DRS) operating in wavelength range of 350–2500 nm is emerging as a rapid and non-invasive approach for estimating soil nutrient content. The success of the DRS approach relies on the ability of the data mining algorithms to extract appropriate spectral features while accounting for non-linearity and complexity of the reflectance spectra. There is no comparative assessment of spectral algorithms for estimating nutrient content of Indian soils. We compare the performance of partialleast-squares regression (PLSR), support vector regression (SVR), discrete wavelet transformation (DWT) and their combinations (DWT–PLSR and DWT–SVR) to estimate soil nutrient content. The DRS models were generated for extractable phosphorus (P), potassium (K), sulphur (S), boron (B), zinc (Zn), iron (Fe) and aluminium (Al) content in Vertisols and Alfisols and were compared using residual prediction deviation (RPD) of validation dataset. The best DRS models yielded accurate predictions for P (RPD = 2.27), Fe (RPD = 2.91) in Vertisols and Fe (RPD = 2.43) in Alfisols, while B (RPD = 1.63), Zn (RPD = 1.49) in Vertisols and K (RPD = 1.89), Zn (RPD = 1.41) in Alfisols were predicted with moderate accuracy. The DWT–SVR outperformed all other approaches in case of P, K and Fe in Vertisols and P, K and Zn in Alfisols; whereas the PLSR approach was better for B, Zn and Al in Vertisols and B, Fe and Al in Alfisols. The DWT–SVR approach yielded parsimonious DRS models with similar or better prediction accuracy than PLSR approach. Hence, the DWT–SVR may be considered as a suitable data mining approach for estimating soil nutrients in Alfisols and Vertisols of India. Keywords: Diffuse reflectance spectroscopy, discrete wavelet transformation, partial-least-squares regression, soil nutrient contents, support vector regression. ASSESSMENT of soil nutrient content at different spatial and temporal scales is an important step in precision agriculture. Conventional nutrient analysis procedures are *For correspondence. (e-mail:
[email protected]) † Deceased. CURRENT SCIENCE, VOL. 110, NO. 6, 25 MARCH 2016
time consuming, laborious and expensive, especially for large sample numbers. Over the last two decades, diffuse reflectance spectroscopy (DRS) over visible to near- and shortwave-infrared (VNIR) region is being developed as an alternative for rapid and non-invasive characterization of different soil constituents1. Specifically, the DRS approach has been used for estimating soil constituents that directly influence the absorption characteristics of incident electromagnetic energy. Such soil constituents generally contain spectrally active functional groups and influence spectral reflectance, and are called as chromophores. The DRS approach is also used for estimating soil properties that do not influence reflectance directly but are strongly correlated with chromophores2. These spectrally inactive soil attributes are referred to as non-chromophores. Recently, Sarathjith et al.3 developed an average dependency index based on mutual information and showed that soil non-chromophores may be estimated by the DRS approach. Soil nutrients are generally non-chromophores and often exhibit strong dependency on soil chromophores. Therefore, the DRS approach is also used for estimating soil nutrients although only a few such studies have been reported for Indian soils. The DRS approach requires large soil spectral databases4 for developing soil-specific spectral algorithms. In India, limited efforts have been made for developing such libraries. For example, Saxena et al.5 developed a spectral database for 40 soils in the spectral range of 350 to 1800 nm from Uttaranchal. Similarly, significant correlations of soil albedo with soil Munsell colour value (r = 0.505), chroma (r = 0.496), soil organic carbon (SOC) contents (r = –0.39), clay (r = –0.263) and cation exchange capacity (CEC) (r = –0.405) were observed for the shrink–swell soils of Central India 6. Spectral algorithms for soil hydraulic properties were developed using reflectance over 350 to 2500 nm for 100 soil samples from a microwatershed near Chilika Lake, Odisha7. The DRS approach was also used to estimate aggregate size distribution parameters8 and SOC content9. While most DRS studies focused on soil textural components and SOC content, very few DRS studies are reported on nutrient assessment for Indian soils10. 1031
RESEARCH ARTICLES Typically, a multivariate regression relationship between spectral reflectance over the VNIR region (wavelength range: 350–2500 nm) and soil attributes is developed using a spectral library. The VNIR spectra are characterized by the electronic transitions of iron oxides11, overtones and combinations of fundamental vibrations of O–H, C–H, N–H and C=O functional groups in the midinfrared frequencies1. However, these characteristic features are mostly non-specific and weak 12. The success of the DRS approach to estimate soil attributes from such weak signatures relies on the ability of data mining algorithms to extract relevant features concealed in reflectance spectra12. Both linear and non-linear data mining algorithms for soil nutrients have been reported. Linear approach includes stepwise multiple linear regression (SMLR)13, principal component regression 2 and partial least squares regression (PLSR)14, whereas non-linear approaches include multivariate adaptive regression splines15 and back propagation neural network16 among others. As the results of different DRS studies vary with data mining approaches, the selection of a modeling approach is a challenging task17. Limited studies have compared different data mining approaches with the same dataset for the estimation of soil nutrient content16 . The PLSR approach is widely used for its ability to address the multi-collinear nature of reflectance spectra, automatic variable selection, statistical efficiency and computational performance18. However, it often fails to capture the inherent complexity of reflectance spectra 19. Recently, support vector machine regression (SVR) has gained attention in soil DRS studies for its ability to account for the non-linearity and noises involved in reflectance spectra12,19. The SVR approach is computationally more intensive than linear approaches. Similarly, the complexity of soil reflectance spectra may be resolved by discrete wavelet transformation (DWT)20. In the DWT approach, only high frequency spectral features are selected for developing spectral algorithms. Combinations of DWT and PLSR (DWT–PLSR) or SVR (DWT–SVR) have been evaluated for predicting SOC content, clay content, pH15 and crop residue mass21 in soil. However, their utility has not been examined for estimating soil nutrients. The objective of this study is to compare the performance of PLSR, SVR, DWT–PLSR and DWT–SVR approaches for estimating soil nutrients of selected Indian soils.
Materials and methods Soil samples and their analyses A total of 500 surface (0–10 cm) soil samples were collected from black (Vertisols) and red (Alfisols) soil regions in north (sampled area: 9,839 km2 ) and south (sampled area: 2,602 km2 ) Karnataka respectively3 . Both 1032
Vertisols and Alfisols differ with regard to pH, iron oxides, clay mineral, CEC, silica-sesquioxide ratio and parent material22. Air dried and ground samples sifted through 2 mm sieve were used for determining extractable phosphorus (P), potassium (K), boron (B), zinc (Zn), iron (Fe) and aluminium (Al) using inductively coupled plasma (ICP)–optical emission spectrometry (OES) (ICP–OES HD Prodigy, Leeman Labs, New Hampshire, USA). Spectral reflectance was measured using a contact probe (10 mm spot size) and a spectroradiometer (Model: FieldSpec3, Analytical Spectral Devices Inc., USA). Reflectance spectra were measured at each quadrant of a levelled soil surface using 50 g soil in an aluminum moisture box (10 cm diameter). The Spectralon white reference panel (Labsphere, USA) was used before scanning each soil sample.
Data processing Data analyses were performed using MATLAB (R2012a, The Mathworks). Initially, the frequency distribution of soil nutrient content was evaluated for normality using Kolmogorov–Smirnov (KS) test at 5% significance level. Nutrient contents with skewed distribution was transformed to natural logarithm or Box–Cox scale and examined for normality. Nutrient contents which failed KS test even after transformations were left untransformed. Representative spectrum of each soil sample was generated by averaging four reflectance spectra (one from each quadrant) after smoothing using a third-order Savitsky– Golay filtering algorithm with 9 nm span length 8. Soil samples which did not comply at 5% level of significance of residuals resulted from principal component regression between the first derivative (FD) spectra and nutrient contents were treated as outliers and excluded from the dataset. The rcoplot subroutine in MATLAB was used to implement this step. The sorting algorithm was used to divide the whole dataset into calibration and validation subsets at a ratio of 3 : 1 (ref. 8). Similarity between calibration and validation datasets with respect to mean and variance was evaluated using two-parameter Student’s t test and Levene’s F test respectively.
Data mining approaches In the PLSR23 approach, a set of selected orthogonal factors (latent variables) that maximize the covariance between the predictor and response variables is used to develop DRS models. The FD of the reflectance spectra were used as predictor variables in PLSR with the soil nutrient content. Optimum number of latent variables corresponds to first local minima in the plot of root-meansquared error (RMSE) of leave-one-out cross-validation versus the number of latent variables24. In the SVR25 approach, the goal is to estimate a function such that the deviation of predicted value from actual value is at most CURRENT SCIENCE, VOL. 110, NO. 6, 25 MARCH 2016
RESEARCH ARTICLES for each training point and the function is as flat as possible. To control the degree of flatness a penalty factor (C) is used. Here, we set to zero because we used a linear kernel; therefore, only one parameter C is to be optimized. Following Ramirez-Lopez et al.26, model for each property was calibrated for the four values of C: 103, 104, 105, and 106 and the optimal value of C was retained based on leave-one-out cross-validation approach27,28. In DWT approach, a set of parsimonious wavelet coefficients was generated by performing multi-resolution analysis (MRA) on soil reflectance spectra21. The pyramid algorithm20 using Haar wavelet was used to implement MRA in seven dilation levels. The wavelet coefficients at each dilation levels were arranged in the descending order of their variance (DWT-array). Those wavelet coefficients that explained 95% of the cumulative variance in the DWT-array were used as predictor variables in both PLSR (DWT–PLSR) and SVR (DWT–SVR) approaches. Developed DRS models were tested on the basis of coefficient of determination (R 2), RMSE, and the residual prediction deviation (RPD) n
(Y Yˆ )
2
(Y Y )
2
i
R2 1
i
i 1 n
(1)
, i
i 1
1 RMSE n RPD
n
(Yi Yˆi )2 i 1
0.5
n
(Yi Y ) i 1 n 1 (Yi Yˆi )2 n i 1
1 n 1
(2)
,
0.5
2
,
(3)
where Y and Yˆ denote the observed and the model predicted values respectively, Y the mean of the observed values, and n is the number of soil samples. The RPD value of validation was used as an accuracy criterion (accurate: RPD > 2, moderate: 1.4 > RPD < 2, poor: RPD < 1.4) to classify DRS models2. Although RMSE is an unbiased estimator, it does not have designated ranges similar to RPD for judging model performance. Hence, all the three statistics were used.
Results and discussion
sols. The distribution of all the soil nutrients (except P) were distinctly different across soil groups as revealed by the two-parameter Student’s t test and Levene’s F test at 5% significance level. Average P content in Vertisols and Alfisols were similar. Potassium and B content was high in Vertisols, while Zn, Fe and Al content was higher in Alfisols. Nutrients such as K and B in Vertisols and P, K, Zn and Fe in Alfisols showed log–normal distribution, while Zn, Fe and Al in Vertisols showed normal distribution only after Box–Cox transformation. Nutrients such as P in Vertisols and B and Al in Alfisols could not be suitably transformed to achieve normality and left untransformed. Results of both the Student’s t test and Levene’s F test ensured similar distribution of nutrient content values between calibration and validation datasets.
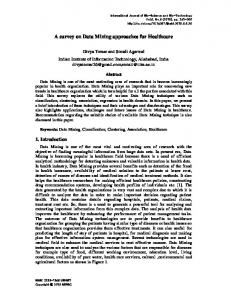
Predictor variables for DWT-based approaches Figure 1 shows the average wavelet coefficient values at each dilation level along with the wavelength regions (scatter plot). Based on the variance criteria, only the wavelet coefficients in dilation levels from 4 to 7 were selected as predictor variables for regression modelling. Among them, the dilation levels 5–7 were found to be the most significant descriptors of variance in DWT array, which were known for their ability to act as potential predictors of soil nutrient content. A total of 40 and 45 predictor variables selected using DWT approach were identical for all the soil nutrient content in Vertisols and Alfisols (except for B) respectively. In the case of B in Alfisols, the wavelet coefficient at 529 nm in dilation level 5 did not comply with the predictor variables selection criteria. Wavelet coefficients around the water absorption bands at 1400, 1900 or 2200 nm (ref. 14) were found to be the most prominent predictor variables across different dilation levels in both Vertisols and Alfisols. These wavelength regions are known for their ability to predict soil nutrient content. The reason for the occurrence of same spectral feature (e.g. water absorption bands) at different dilation levels is associated with the inherent multiresolution capability of DWT. In addition to water absorption bands, several other spectral features related to the electronic transitions of iron-bearing minerals in the visible region11, overtones and combinations of fundamental vibration of active functional groups (C–H, N–H and C=O) in the near- and shortwave-infrared regions1 were also identified as significant predictor variables at higher dilation levels.
Descriptive statistics of soil nutrient content
Comparison of different data mining approaches
Table 1 lists descriptive statistics for soil nutrients in calibration and validation dataset of Alfisols and Verti-
Figure 2 shows RPD values for soil nutrients from different data mining approaches. The PLSR approach yielded
CURRENT SCIENCE, VOL. 110, NO. 6, 25 MARCH 2016
1033
RESEARCH ARTICLES Table 1.
Descriptive statistics of soil nutrient content Calibration
Soil nutrient content (mg l−1 ) Vertisols P K S B Zn Fe Al Alfisols P K S B Zn Fe Al
n
Validation
Range
176 175 181 178 177 176 178
0.47–46.14 39–468 0.85–333 0.24–7.66 0.18–4.56 1.7–104.7 0.9–2.5
175 176 177 175 174 177 180
1.2–54.3 11–438 1.7–45.5 0.1–1.44 0.22–2.8 2–104.8 1.1–4.6
Mean
n
Range
Mean
8.06 (113) 232.95 (32) 27.25 (196) 1.42 (72) 0.58 (78) 7.65 (119) 1.51 (24)
59 58 61 60 59 59 59
0.63–42.87 68–428 1.2–344.6 0.26–14.72 0.18–2.4 1.7–29.6 0.9–2.4
8.13 (114) 230.84 (31) 30.11 (206) 1.59 (121) 0.57 (64) 7.29 (81) 1.49 (24)
11.82 115.32 5.24 0.49 0.92 14.81 2.08
59 59 59 59 58 59 60
1.4–57.4 14–438 1.7–19.6 0.1–1.52 0.24–2.4 2.6–42.1 1.1–4
12.23 (86) 115.66 (84) 5.02 (62) 0.5 (64) 0.91 (53) 14.3 (76) 2.07 (33)
(80) (83) (84) (61) (54) (86) (33)
n, Number of soil samples. † Values in parentheses are the coefficients of variation (%).
Figure 1.
Wavelength regions used in DWT-based approaches and corresponding wavelet coefficients.
high RPD values for B (RPD = 1.63), Zn (RPD = 1.49) in Vertisols and B (RPD = 1.36), Fe (RPD = 2.43) in Alfisols; while the SVR approach appeared to be most effective for Al (RPD = 1.40) in Vertisols and P (RPD = 1.26), K (RPD = 1.91) and Al (RPD = 1.36) in Alfisols. The DWT–PLSR was the least performing approach for most of the soil nutrients. The DWT–SVR outperformed all other approaches to predict P (RPD = 2.27), K (RPD = 1.22), Fe (RPD = 2.91) in Vertisols and Zn (RPD = 1.41) in Alfisols. In general, all the modelling approaches (except DWT–PLSR) provided 1034
similar prediction accuracy for most of the soil nutrients. Specifically, the DWT–PLSR approach failed to predict P, B, Zn, Fe and Al in Vertisols and Zn in Alfisols and, hence, may not be suitable for estimating soil nutrients. Among PLSR, SVR and DWT–SVR, the DWT–SVR used only 2% of the total number of predictor variables compared with both PLSR and SVR approaches (NSV = 2048). Table 2 lists the regression statistics for this modelling approach with the observed versus predicted nutrient content shown in Figure 3. In general, the calibration statistics were better than those of validation CURRENT SCIENCE, VOL. 110, NO. 6, 25 MARCH 2016
RESEARCH ARTICLES Table 2.
Regression statistics for soil nutrients using DWT–SVR approach Calibration
Soil nutrient content (mg l–1 ) Vertisols P¶ K S¶ B Zn§ Fe§ Al§ Alfisols P K S§ B¶ Zn Fe Al¶
Validation
PF
R2
RMSE
RPD
R2
RMSE
RPD
106 103 106 104 103 106 103
0.82 0.42 0.36 0.55 0.63 0.82 0.35
3.88 0.26 42.73 0.43 0.41 0.15 0.17
2.36 1.32 1.25 1.50 1.65 2.33 1.24
0.80 0.32 0.30 0.49 0.43 0.88 0.26
4.09 0.27 51.50 0.51 0.51 0.12 0.18
2.27 1.22 1.20 1.41 1.34 2.91 1.17
105 103 103 103 103 103 103
0.45 0.82 0.31 0.52 0.58 0.77 0.47
0.62 0.34 0.21 0.20 0.34 0.38 0.50
1.35 2.39 1.21 1.45 1.54 2.08 1.38
0.28 0.71 –0.08 0.37 0.49 0.81 0.42
0.73 0.44 0.25 0.25 0.37 0.33 0.51
1.19 1.89 0.97 1.27 1.41 2.32 1.33
Log-transformed nutrient content; §Box–Cox transformed nutrient content; ¶Untransformed nutrient content. PF, Penalty factor; R2 , Coefficient of determination; RMSE, Root-mean-squared error; RPD, Residual prediction deviation.
Figure 2.
Performance of data mining approaches for predicting nutrient contents in Vertisols and Alfisols.
for all the soil nutrient contents (except Fe) in both soils. Reverse trend for Fe may occur because of the presence of some calibration samples with values outside validation range (Table 1). Prediction was accurate for P and Fe in Vertisols and Fe in Alfisols, moderate for B and Zn in Vertisols and K and Zn in Alfisols while the predictions were poor for all the remaining soil nutrient contents. Regression statistics were comparable or often better than those reported in the literature for P, K29, Zn2, Fe29 and Al29. Thus, the DWT–SVR approach may be considered CURRENT SCIENCE, VOL. 110, NO. 6, 25 MARCH 2016
as the best calibration approach in terms of both model accuracy and parsimony to estimate soil nutrient contents in Alfisols and Vertisols samples.
Summary Diffuse reflectance spectroscopy provides a rapid and non-invasive alternative to wet chemistry-based methods for the simultaneous estimation of different soil properties. In this study, four different data mining approaches 1035
RESEARCH ARTICLES
Figure 3.
Observed versus predicted soil nutrient contents in Vertisols and Alfisols.
namely PLSR, SVR, DWT–PLSR and DWT–SVR were used to estimate soil nutrients for two Indian soils of Vertisols and Alfisols. The best DRS models yielded accurate predictions for P (RPD = 2.27), Fe (RPD = 2.91) in Vertisols and Fe (RPD = 2.43) in Alfisols; while B (RPD = 1.63), Zn (RPD = 1.49) in Vertisols, and K (RPD = 1.89), Zn (RPD = 1.41) in Alfisols were predicted with moderate accuracy. The DWT–SVR outperformed all other approaches in case of P, K and Fe in Vertisols and P, K, Zn in Alfisols; whereas, the PLSR approach was found to be better for B, Zn and Al in Vertisols and B, Fe and Al in Alfisols. The DWT–SVR approach yielded parsimonious DRS models with similar or even better prediction accuracy than PLSR approach. Hence, the DWT–SVR may be considered as the best calibration approach for the estimation of soil nutrient content for Alfisols and Vertisols of India.
3.
4.
5.
6.
7.
8. 1. Ben-Dor, E. and Banin, A., Near-infrared analysis as a rapid method to simultaneously evaluate several soil properties. Soil Sci. Soc. Am. J., 1995, 59, 364–372. 2. Chang, C., Laird, D. A., Mausbach, M. J. and Hurburgh, C. R., Near-infrared reflectance spectroscopy–principal components 1036
9.
regression analyses of soil properties. Soil Sci. Soc. Am. J., 2001, 65, 480–490. Sarathjith, M. C., Das, B. S., Wani, S. P. and Sahrawat, K. L., Dependency measures for assessing the covariation of spectrally active and inactive soil properties. Soil Sci. Soc. Am. J., 2014, 78, 1522–1530. Brown, D. J., Shepherd, K. D., Walsh, M. G., Mays, M. D. and Reinsch, T. G., Global soil characterization with VNIR diffuse reflectance spectroscopy. Geoderma, 2006, 132, 273–290. Saxena, R. K., Vermal, K. S., Srivastava, R., Av, A. K. B., Shiwalkar, A. A. and Londhel, S. L., Spectral reflectance properties of some dominant soils occurring on different altitudinal zones in Uttaranchal Himalayas. Agropedology, 2003, 13, 35–43. Srivastava, R., Prasad, J. and Saxena, R., Spectral reflectance properties of some shrink-swell soils of Central India as influenced by soil properties. Agropedology, 2004, 14, 45–54. Santra, P., Sahoo, R. N., Das, B. S., Samal, R. N., Pattanaik, A. K. and Gupta, V. K., Estimation of soil hydraulic properties using proximal spectral reflectance in visible, near-infrared, and shortwave-infrared (VIS–NIR–SWIR) region. Geoderma, 2009, 152, 338–349. Sarathjith, M. C., Das, B. S., Vasava, H. B., Mohanty, B., Sahadevan, A. S., Wani, S. P. and Sahrawat, K. L., Diffuse reflectance spectroscopic approach for the characterization of soil aggregate size distribution. Soil Sci. Soc. Am. J., 2014, 78, 369– 376. Srivastava, R., Sarkar, D., Mukhopadhayay, S. S., Sood, A., Singh, M., Nasre, R. A. and Dhale, S. A., Development of CURRENT SCIENCE, VOL. 110, NO. 6, 25 MARCH 2016
RESEARCH ARTICLES
10.
11.
12.
13.
14.
15.
16.
17. 18.
19.
hyperspectral model for rapid monitoring of soil organic carbon under precision farming in the Indo-Gangetic Plains of Punjab, India. J. Indian Soc. Remote Sensing, 2015, 43(4), 1–9. Das, B. S., Sarathjith, M. C., Santra, P., Sahoo, R. N., Srivastava, R., Routray, A. and Ray, S. S., Hyperspectral remote sensing: opportunities, status and challenges for rapid soil assessment in India. Curr. Sci., 2015, 108(5), 860. Sherman, D. and Waite, T., Electronic spectra of Fe (super 3+) oxides and oxide hydroxides in the near IR to near UV. Am. Mineral, 1985, 70, 1262–1269. Viscarra Rossel, R. A. and Behrens, T., Using data mining to model and interpret soil diffuse reflectance spectra. Geoderma, 2010, 158, 46–54. Malley, D. and Yesmin, L., Application of near-infrared spectroscopy in analysis of soil mineral nutrients. Commun. Soil Sci. Plant Anal., 1999, 30, 999–1012. Viscarra Rossel, R. A., Walvoort, D. J. J., McBratney, A. B., Janik, L. J. and Skjemstad, J. O., Visible, near infrared, mid infrared or combined diffuse reflectance spectroscopy for simultaneous assessment of various soil properties. Geoderma, 2006, 131, 59– 75. Shepherd, K. and Walsh, M., Development of reflectance spectral libraries for characterization of soil properties. Soil Sci. Soc. Am. J., 2002, 66, 988–998. Mouazen, A. M., Kuang, B., De Baerdemaeker, J. and Ramon, H., Comparison among principal component, partial least squares and back propagation neural network analyses for accuracy of measurement of selected soil properties with visible and near infrared spectroscopy. Geoderma, 2010, 158, 23–31. Friedman, J. H., Greedy function approximation: a gradient boosting machine. Ann. Stat., 2001, 29, 1189–1232. Boulesteix, A. and Strimmer, K., Partial least squares: a versatile tool for the analysis of high-dimensional genomic data. Brief. Bioinform., 2007, 8, 32–44. Vohland, M., Besold, J., Hill, J. and Fründ, H., Comparing different multivariate calibration methods for the determination of soil organic carbon pools with visible to near infrared spectroscopy. Geoderma, 2011, 166, 198–205.
CURRENT SCIENCE, VOL. 110, NO. 6, 25 MARCH 2016
20. Viscarra Rossel, R. A. and Lark, R. M., Improved analysis and modelling of soil diffuse reflectance spectra using wavelets. Eur. J. Soil Sci., 2009, 60, 453–464. 21. Sahadevan, A. S., Shrivastava, P., Das, B. S. and Sarathjith, M. C., Discrete wavelet transform approach for the estimation of crop residue mass from spectral reflectance. IEEE J. Sel. Top. Appl. Earth Observ. Remote Sensing, 2014, 7(6), 2490–2495. 22. Lotse, E. G., Datta, N. P., Tomar, K. P. and Motsara, K. P., Mineralogical composition of some red and black soils of India. In Proceedings of the National Science Academy, Springer, 1972, pp. 216–226. 23. Wold, S., Martens, H. and Wold, H., The Multivariate Calibration Problem in Chemistry Solved by the PLS Method. Springer, Berlin, Heidelberg, 1983, pp. 286–293. 24. Santra, P., Singh, R. and Sarathjith, M., Reflectance spectroscopic approach for estimation of soil properties in hot arid western Rajasthan, India. Environ. Earth, 2015, 1–43. 25. Vapnik, V., Golowich, S. E. and Smola, A., Support vector method for function approximation, regression estimation, and signal processing. In Advances in Neural Information Processing Systems 9, 1996, pp. 281–287. 26. Ramirez-Lopez, L., Schmidt, K., Behrens, T., van Wesemael, B., Dematte, J. A. and Scholten, T., Sampling optimal calibration sets in soil infrared spectroscopy. Geoderma, 2014, 226, 140–150. 27. Daubechies, I., Orthonormal bases of compactly supported wavelets. Commun. Pure Appl. Math., 1988, 41(7), 909–996. 28. Trygg, J. and Wold, S., PLS regression on wavelet compressed NIR spectra. Chemometr. Intell. Lab. Syst., 1998, 42(1), 209–220. 29. Abdi, D., Tremblay, G.F., Ziadi, N., Bélanger, G. and Parent, L.-É., Predicting soil phosphorus-related properties using nearinfrared reflectance spectroscopy. Soil Sci. Soc. Am. J., 2012, 76, 2318–2326.
Received 25 August 2015; accepted 30 October 2015
doi: 10.18520/cs/v110/i6/1031-1037
1037