Traffic flow is highly complex and not amenable to accurate ... In each stage an appropriate technique has to be used to .... the best trade-off between detection rate and false alarm rate. ... when an algorithm is implemented on-line in a large freeway .... Table 3. Performance of New Incident Detection Model and California ...
Comparison of Fuzzy-Wavelet Radial Basis Function Neural Network Freeway Incident Detection Model with California Algorithm Asim Karim1 and Hojjat Adeli2 Abstract: A multiparadigm general methodology is advanced for development of reliable, efficient, and practical freeway incident detection algorithms. The performance of the new fuzzy-wavelet radial basis function neural network 共RBFNN兲 freeway incident detection model of Adeli and Karim is evaluated and compared with the benchmark California algorithm #8 using both real and simulated data. The evaluation is based on three quantitative measures of detection rate, false alarm rate, and detection time, and the qualitative measure of algorithm portability. The new algorithm outperformed the California algorithm consistently under various scenarios. False alarms are a major hindrance to the widespread implementation of automatic freeway incident detection algorithms. The false alarm rate ranges from 0 to 0.07% for the new algorithm and from 0.53 to 3.82% for the California algorithm. The new fuzzy-wavelet RBFNN freeway incident detection model is a single-station pattern-based algorithm that is computationally efficient and requires no recalibration. The new model can be readily transferred without retraining and without any performance deterioration. DOI: 10.1061/共ASCE兲0733-947X共2002兲128:1共21兲
Introduction In recent years, researchers have investigated neural networkbased incident detection algorithms with promising performance results. Adeli and Samant 共2000兲 developed an adaptive conjugate gradient neural network pattern recognition model for freeway incident detection that employed data de-noising and enhancement. Discrete wavelet transformation and linear discriminant analysis are used for data de-noising and enhancement, respectively 共Samant and Adeli 2000兲. The model is tested using simulated data for several geometric and traffic flow conditions. Recently, Adeli and Karim 共2000兲 created a new single-station pattern-based freeway incident detection algorithm. The characterizing pattern used is a time series of the upstream lane occupancy and speed. Wavelet-based de-noising, fuzzy clustering, and neural network classification are used to reliably identify incident and nonincident conditions from the time-series pattern. The algorithm was tested using both simulated and real data, producing excellent performance results. In this paper, a general methodology is presented for development of reliable, efficient, and practical freeway incident detection algorithms. Next, the incident detection model of Adeli and Karim 共2000兲 is described briefly, followed by a discussion of California algorithm #8. Then the performance of Adeli and Karim’s incident detection model is evaluated and compared with 1 Graduate Research Associate, Dept. of Civil and Environmental Engineering and Geodetic Science, Ohio State Univ., Columbus, OH 43210. 2 Professor, Dept. of Civil and Environmental Engineering and Geodetic Science, Ohio State Univ., Columbus, OH 43210. Note. Discussion open until June 1, 2002. Separate discussions must be submitted for individual papers. To extend the closing date by one month, a written request must be filed with the ASCE Managing Editor. The manuscript for this paper was submitted for review and possible publication on December 20, 2000; approved on May 29, 2001. This paper is part of the Journal of Transportation Engineering, Vol. 128, No. 1, January 1, 2002. ©ASCE, ISSN 0733-947X/2002/121–30/$8.00⫹$.50 per page.
that of California algorithm #8 on typical urban freeway systems. The emphasis is to evaluate the robustness of the algorithms under various traffic flow and roadway geometry conditions, as a comprehensive indicator of their practical implementation in an areawide advanced transportation management system. Further, the new model is also tested using real incident data from the advanced regional traffic interactive management and information system 共ARTIMIS兲 implemented in Cincinnati, Ohio 共http:// www.artimis.org/兲 and the freeway service patrol 共FSP兲 project’s I-880 database for the I-880 freeway between Oakland and San Jose, Calif. 共http://www.path.berkeley.edu/FSP/兲.
New Traffic Incident Detection Methodology A freeway incident detection algorithm must produce consistently reliable results from remotely sensed data of traffic streams. This is a challenging problem, especially considering the nonhomogenous, turbulent, and often chaotic nature of traffic flow and the limited information available from sensors, and is further complicated by noise introduced in the data during its collection and transmission. This indicates that a wholly model-based approach is less likely to be successful than a model-free, adaptive pattern recognition approach. However, a pattern-based approach must not neglect traffic behavior information that can be used to improve the efficiency and performance of the algorithm. The pattern-based approaches presented in the literature often neglect this aspect and tend to be overly simplistic. To solve the complex freeway incident detection problem effectively, our approach is based on using advanced signal processing, pattern recognition, and classification techniques with appropriate heuristics derived from known traffic flow behavior. The rationale behind this methodology is as follows: • Traffic flow is highly complex and not amenable to accurate mathematical modeling. Therefore, reliance must be placed on adaptive algorithms that can learn and recognize patterns in an unsupervised manner.
JOURNAL OF TRANSPORTATION ENGINEERING / JANUARY/FEBRUARY 2002 / 21
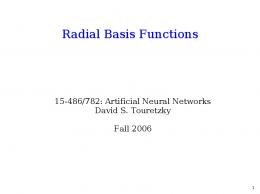
Fig. 1. New methodology for freeway incident detection algorithms
• Traffic data is often corrupted by noise. Noise elimination is essential to improve the performance of any algorithm. • The algorithm should require little or no calibration for its on-line implementation. That is, the algorithm’s performance must be independent of roadway geometry, existence of onand off-ramps, weather conditions, and changing traffic demand. • Traffic flow behavior and information from other sources must not be ignored. For example, knowledge of flow behavior should be used wherever possible to simplify the algorithm and improve performance. • The algorithm must be capable of real-time operation. Therefore, computationally intensive algorithms must be avoided. Fig. 1 presents a schematic view of the new methodology for development of advanced incident detection algorithms. Five sequential stages of processing are identified: 共1兲 preprocessing; 共2兲 de-noising; 共3兲 clustering; 共4兲 classification; and 共5兲 decisionmaking. In each stage an appropriate technique has to be used to achieve the desired result. These techniques may be unique in each stage, or two or more stages may use the same technique provided that the goals of each stage are achieved. In the following paragraphs, each of these five stages is described briefly. The preprocessing stage takes the raw traffic data obtained from sensors and transforms the data in the format needed for the algorithm. Common preprocessing approaches include calculating the cumulative values of time-series data and calculating the difference in values obtained from two sensors. The number, type, and format 共that is, the pattern兲 of traffic data is selected based on the behavior of traffic flow before, during, and after incidents and the performance of the algorithm. The second stage performs de-noising and enhancement of the signal output obtained from the preprocessing stage. This is an important stage because noise corruption is one of the primary
reasons for poor reliability of the incident detection algorithms. Noise is introduced during both data observation and transmission and depends on random factors such as environmental conditions, sensor calibration errors, and traffic anomalies. The goal of this stage is to produce a clean noise-free signal. Large fluctuations in values over a short period of time due to noise make it difficult for any algorithm to discriminate between an actual incident pattern and a noise-induced pattern. Noise can be effectively removed from a signal if it can be separated from the true signal. Transform-based techniques, such as discrete wavelet transform, provide the best solution. The third stage performs a feature extraction process. This stage reduces the dimensionality of the data and improves the performance of the following classification and decision-making stages. Several clustering techniques are available, including neural network 共Adeli and Hung 1995; Adeli and Park 1998兲, fuzzy logic, and statistical approaches. In general, the statistical discriminant analysis approaches are computationally intensive and require high CPU resources in order to be implemented in real time, a requirement for effective incident detection algorithms. Fuzzy clustering techniques such as the fuzzy c-means approach are both computationally efficient and capable of handling imprecision. The classification stage identifies patterns in data and places the data in relevant categories. This stage determines whether the data represent an incident or not. Neural network models are most appropriate for this stage of processing. The clustering and classification stages may be combined in an algorithm. The final decision is made in the decision-making stage, which can be used to merge information available from other sources such as surveillance cameras before making a decision. Techniques such as fuzzy logic and decision theory may be used in this stage, in addition to heuristics based on human judgment.
22 / JOURNAL OF TRANSPORTATION ENGINEERING / JANUARY/FEBRUARY 2002
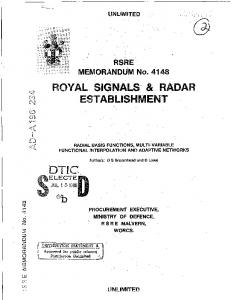
Fig. 2. Fuzzy-wavelet radial basis function neural network incident detection model
Fuzzy-Wavelet Radial Basis Function Neural Network Model for Incident Detection Recently, Adeli and Karim 共2000兲 developed a new multiparadigm incident detection model for freeway incident detection. The model is based on the general methodology for the development of reliable, robust, and efficient incident detection algorithms presented above. The model is self-calibrating once it is trained and does not need to be modified for different roadway geometries and flow conditions. The new incident detection algorithm is described briefly in this section. For complete details, the reader should refer to Adeli and Karim 共2000兲. This model is a single-station time-series pattern-recognition approach that uses advanced de-noising and classification techniques to minimize misclassification of the prevailing traffic flow conditions. Each decision pattern consists of 16 data points of the upstream lane occupancy and speed. The two time series are normalized by dividing the values in each by the average of all values. This approach reduces the effects of varying flow rates and thus improves algorithm portability. The normalized timeseries data are then de-noised by soft-thresholding the wavelet coefficients. The de-noised data series are then clustered using the fuzzy c-means approach. The de-noised and clustered data represent the essential characteristics of the traffic flow needed to differentiate incident flow conditions from nonincident flow conditions. This pattern is then classified by a trained radial basis function neural network 共RBFNN兲. The algorithm is shown schematically in Fig. 2 and summarized succinctly in the following steps. These steps represent the processing that is needed at each decision interval 共equal to the reporting interval for the sensors兲 and at each detector station. 1. Obtain the 16 most recent data values for the lane occupancy (x O 关 n 兴 ) and the lane speed (x S 关 n 兴 ). When data are available every 20 s, for example, then this process is performed every 20 s by adding the new reading and dropping the last reading in the sequence. 2. For each data sequence x 关 n 兴 (n⫽1, . . . ,16), perform the following computations: a. Normalize each sequence by dividing its values by the
average of the last 16 values. The normalized sequences are denoted by x ⬘ . b. Calculate the discrete wavelet transform 共DWT兲 of the normalized sequence (x ⬘ ) using the Daubechies wavelet system of length 8 共D8兲. The lowest scale resolved is 2. Therefore, the final number of scaling coefficients (c 2,k ) obtained is 4 and the final number of wavelet coefficients (d j,k ) obtained is 12. c. Filter the wavelet coefficients (d j,k ) using the softthresholding nonlinearity (d)⫽sgn(d)(兩d兩⫺t)⫹ to remove noise. In this equation (.) ⫹ is equal to 共.兲 when 共.兲 is positive and zero otherwise and the function sgn共.兲 returns the sign of its argument. The threshold t is given by t ⫽ 冑2 log(N) where N is the total number of data points 共equal to 16 in this work兲. Let ¯d j,k denote the filtered wavelet coefficients. d. Calculate the inverse DWT 共denoted by IWT in Fig. 2兲 with c 2,k as the scaling coefficients and ¯d j,k as the wavelet coefficients to obtain the de-noised normalized sequence ¯x 关 n 兴 . ¯ S 关 i 兴 其 (i⫽1,16). 3. Form the traffic pattern matrix xi ⫽ 兵¯x O 关 i 兴 ,x Use the fuzzy c-mean 共FCM兲 algorithm to reduce the dimensionality of x from 16⫻2 to 4⫻2, denoted by x⬘ . These eight data points represent the de-noised and clustered pattern that is used in the next classification step. 4. Feed-forward the pattern through the trained RBFNN. If the output y is greater than a preselected threshold, then an incident condition is signaled. Otherwise, no incident condition exists. The RBFNN is trained off-line from representative incident and nonincident patterns. Each pattern is processed by following steps 1 to 3 above. Note that the training has to be done only once. The trained RBFNN can then be implemented on all the detector stations in the freeway management system. This portability is possible because the algorithm depends on the shape of a pattern rather than on any magnitude to distinguish between incident and nonincident conditions. The RBFNN can even be trained using simulated data only and implemented on-line, which is the case in this evaluation.
JOURNAL OF TRANSPORTATION ENGINEERING / JANUARY/FEBRUARY 2002 / 23
Table 1. Definition of Parameters Used in California Algorithm #8 Parameter P1 P2 P3 P4 P5 P6
Definition Threshold of occupancy difference between consecutive stations Threshold of percent occupancy change at downstream station Threshold of percent occupancy difference between consecutive stations Threshold of occupancy at downstream station Another threshold of occupancy at downstream station Number of compression wave suppression periods
most widely known and accepted algorithms for traffic incident detection. They are often used as benchmarks for the evaluation of new algorithms. Both algorithms #7 and #8 are recognized as the ‘‘best’’ 共Levin and Krause 1979兲. However, algorithm #8, with its additional compression wave suppression logic, performs better in heavy traffic and produces fewer false alarms as compared to algorithm #7 共Levin and Krause 1979兲. For these reasons, we adopt California algorithm #8 for the comparative evaluation of the new fuzzy-wavelet RBFNN incident detection model.
Evaluation of Model Introduction
California Algorithm #8 The California Department of Transportation and its associates developed several algorithms for freeway incident detection in the 1970s that are collectively known as California algorithms. As many as 10 variations of these algorithms were developed. All of these algorithms use the lane occupancy values at one or two adjacent stations as input and compare them with preselected thresholds to characterize the state of the traffic flow. In the original California algorithm—also know as California algorithm #1— traffic flow is characterized as either incident or incident-free states based on a sequence of logic tests performed using three occupancy-based traffic patterns. Later algorithms extended this simple logic by increasing the number of logical decisions made and the number of traffic flow states reported by the algorithm. California algorithm #8 共Payne and Tignor 1978兲 incorporates incident persistence and compression wave suppression logic. The algorithm reports an incident only after the incident condition has persisted for a specified number of time periods. Further, it suppresses the signaling of an incident for 5 min after a compression wave is detected. California algorithm #8 uses both temporal and spatial occupancy values as input. It can classify traffic into five states: incident-free, compression wave, tentative incident, incident confirmed, and incident in progress. The compression wave state is further classified into five states that indicate the presence of a compression wave in the last 1, 2, 3, 4, or 5 min. The logic of California algorithm #8 can be described by a binary tree structure where each node, except the leaf 共end兲 nodes, performs a two-way decision made by comparing a traffic pattern 共an occupancy-based value兲 with a preselected threshold 共Payne and Tignor 1978; Levin and Krause 1979兲. Starting from the root node, a sequence of such decisions is made until a leaf node is reached that represents a traffic state. This algorithm needs six parameters for calibration; these are defined in Table 1. Five of them 共P 1 to P 5 兲 are thresholds for occupancy-based values, while parameter P 6 specifies the number of time periods the algorithm will wait for a compression wave condition to persist before signaling it. The performance of the algorithm depends on the choice of these parameters. The parameters are determined in a trial-anderror fashion by testing the algorithm on a given data set to obtain the best trade-off between detection rate and false alarm rate. The calibrated parameters are data dependent and may not be optimal for other data sets. This in turn means that the performance of the algorithm will not be optimal at all locations and at all times in a freeway management system. Thus, California algorithms are not readily transferable and need recalibrations for their effective network-wide implementation. Despite this shortcoming, the California algorithms—especially algorithms #7 and #8—are the
In general, there are two approaches to the evaluation of a new computational model. The first approach is to test the model using a standard representative data set and determine its performance. This data set should be recognized as the benchmark for comparative evaluations of such models. In the second approach, the model is evaluated using nonstandard but representative data sets and its performance compared to that of a benchmark model on the same data set. Presently, a standard data set is not available for evaluating freeway incident detection algorithms. Furthermore, real traffic data are not available in sufficiently large and varied quantities to allow any meaningful evaluations. Therefore, freeway incident detection algorithms are usually evaluated using representative simulated data for which the performance of both the new and a benchmark algorithm 共such as California algorithm #8兲 are compared. The use of simulated data has one more advantage not possible with real data: the algorithms can be tested and studied under different freeway traffic flow and geometric conditions. The fuzzy-wavelet RBFNN freeway incident detection model 共also abbreviated as the new algorithm/model in the rest of this article兲 is tested using both simulated and real data. Simulated data are used for comparative evaluations with California algorithm #8 共also abbreviated as California algorithm兲, whereas real data are used to test model robustness and portability.
Evaluation Criteria Three quantitative measures are commonly used to evaluate freeway incident detection algorithms. • Detection rate: defined as a percentage calculated by dividing the number of incidents correctly signaled by the algorithm to the total number of incidents in the data set. A value of 100% represents perfect performance. • False alarm rate: defined as the percentage calculated by dividing the number of incidents incorrectly signaled to the total number of decisions made by the algorithm. A value of zero represents perfect performance. As the ratio is calculated with respect to the total number of decisions made by the algorithm, even a small value for the false alarm rate can represent an unacceptable number of false alarms in practice. For example, a false alarm rate of 0.5% can produce 21.6 false alarms from a single station 共that reports every 20 s兲 per day. Urban freeway management systems usually have hundreds of detector stations, thus compounding the problem. Therefore, a very low false alarm rate is of utmost practical importance. • Detection time: defined as the time it takes the algorithm to signal the incident after its occurrence. A consistently short detection time is desirable so that emergency support can be dispatched to the scene and appropriate traffic control mea-
24 / JOURNAL OF TRANSPORTATION ENGINEERING / JANUARY/FEBRUARY 2002
sures can be taken quickly. An incident detection algorithm that correctly signals 100% of the incidents but takes a long time to do so is of little practical value. The quantitative measures defined above, however, do not completely describe the performance of an incident detection algorithm in practice. These performance measures are often determined from off-line tests on data for which the algorithm is calibrated. Such calibrations, however, are not practically feasible when an algorithm is implemented on-line in a large freeway management system. Thus, the network-wide performance degrades significantly from that reported in the tests. For this reason, the following qualitative measure must also be considered in the evaluation of freeway incident detection algorithms. • Portability: An algorithm is transferable if it performs at optimal or near-optimal levels under different conditions without recalibration or retraining. This qualitative measure is judged by the performance of the algorithm in terms of the three quantitative measures on different freeway traffic flow and geometric conditions. Ideally, an algorithm should not require any recalibration for its network-wide on-line implementation.
Traffic Data The new model is tested and evaluated using both simulated and real traffic data. Simulated traffic data are generated from the microscopic stochastic simulation software package TSIS/ CORSIM 共http://www.fhwa-tsis.com/兲. More than 110 h of traffic data are generated, representing different freeway geometric and traffic flow conditions. Traffic incidents are simulated by the blockage of one lane and the 50% reduction in capacity of the adjacent lane共s兲. The incidents have a duration of 10 min. Coupled loop detectors or sensors are used to obtain lane occupancy, speed, and flow rate at 20 s time intervals, and detector stations are spaced from 610 to 762 m apart. In all, more than 200 separate simulations are conducted with different random number seeds resulting in more than 225,000 reports of lane occupancy, speed, and flow rate from the sensors. Real traffic data are obtained from two sources: ARTIMIS for the Cincinnati-Northern Kentucky area freeway system, and the FSP project’s I-880 database for the I-880 freeway between Oakland and San Jose, Calif. ARTIMIS is an automated freeway management system that monitors and controls 142 km 共88 m兲 of freeways in the Northern Kentucky/Cincinnati, Ohio, area with 78 closed-circuit TV 共CCTV兲 cameras, 1,100 detectors, and numerous changeable message signs. Lane occupancy, speed, and flow rate data are available from the detectors every 30 s. Incidents are recorded by CCTV camera monitors and by proprietary incident detection logic. Very limited data were available for incident testing as the archived data period averaged over 15 min rather than 30 s. The FSP project’s database contains 30 s traffic lane occupancy, speed, and flow rate data from a 14.8 km 共9.2 m兲 segment of the I-880 freeway between Oakland and San Jose, Calif. Incidents are recorded by human observers traversing this freeway segment in patrol vehicles and noting incident location, type, and time of occurrence. The freeway has a varied geometry with three to five lanes in each direction, one- and two-lane on- and offramps, and lane drop-offs and add-ons.
incident-free patterns are used for training. These patterns are selected randomly from all the different simulations performed for this evaluation. In particular, the incident-free patterns contain samples from traffic compression waves, stop-and-go traffic, and traffic affected by on- and off-ramps. This selection is done to provide added robustness to the trained network in recognizing incident-free conditions as distinct from those caused by incidents. However, it should be noted that the model bases its decision on a pattern that is to a large extent independent of the prevailing traffic and freeway conditions. Once the network is trained and its weights established, the model is evaluated without any modifications. The California algorithm is calibrated with the same 60 incident and 60 incident-free traffic samples used for the training of the fuzzy-wavelet RBFNN model. Threshold calibration is done in a trial-and-error manner whereby the thresholds are modified after each run through the data set based on the determined detection rate, false alarm rate, and detection time. There is a tradeoff between the detection rate and the false alarm rate such that an increase in the detection rate results in an increase in the false alarm rate. In the calibration process, a ceiling for the detection rate is achieved and the thresholds are then modified to minimize the false alarm rate. This procedure is identical to that reported by Payne and Tignor 共1978兲 and Levin and Krause 共1979兲. The set of parameters obtained are P 1 ⫽13, P 2 ⫽⫺30, P 3 ⫽30, P 4 ⫽15, P 5 ⫽30, and P 6 ⫽2. Note that compression wave false alarm suppression is done for two time periods 共40 or 60 s兲, unlike the 5 min used by Payne and Tignor 共1978兲. This low value is chosen to avoid unacceptably long detection times. This set is used throughout the evaluation without modification.
Training and Calibration The new model is trained using simulated data. Following the procedure outlined in a previous section, 60 incident and 60
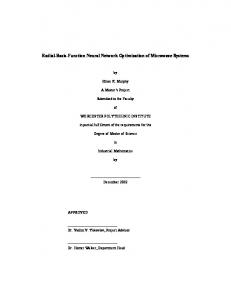
Fig. 3. Layout of freeway, detector stations, and incident locations for first simulation test
JOURNAL OF TRANSPORTATION ENGINEERING / JANUARY/FEBRUARY 2002 / 25
Table 2. Performance of New Incident Detection Model and California Algorithm #8 on Two-Lane Freeway New algorithm Flow rate 共vph per lane兲 1,000 1,000 1,000 1,000 1,500 1,500 1,500 1,500 2,000 2,000 2,000 2,000 Totals
Location 共m兲 152 305 457 610 152 305 457 610 152 305 457 610
California algorithm #8
Detections
False Alarms
Detection Time 共s兲
5/5 5/5 5/5 5/5 5/5 5/5 5/5 5/5 5/5 5/5 5/5 5/5 60/60 共100%兲
0/150 0/150 0/150 0/150 0/150 0/150 0/150 0/150 0/150 0/150 0/150 0/150 0/1,800 共0%兲
172 300 368 500 72 152 164 240 64 88 128 140
First Simulation Test—Parametric Evaluation In this test, the new model is evaluated under different freeway geometric, traffic flow, and detector station location conditions. The general freeway layout and the locations of the detector stations and the incidents are shown in Fig. 3. In this evaluation, the number of lanes is varied from two to four, the flow rate is varied from 1,000 to 2,000 vehicles per hour 共vph兲 per lane, and the location of the incident downstream of a detector station is varied from 152 to 610 m. Detector stations are spaced 762 m apart. An incident is modeled by the blockage of one lane and the 50% reduction in capacity of the adjacent lane. The blockage of a lane produces a bottleneck in the flow of traffic. If the prevailing flow rate is greater than the reduced capacity after the incident, a queue will develop on the upstream side. At some location upstream of the incident, the average speed will decrease and the occupancy will increase. This change, however, takes some time to develop and move upstream, depending on the prevailing flow rate, the remaining capacity of the freeway at the bottleneck, and the distance of the incident from the upstream detector station. Even when the reduced capacity after an incident is greater than the prevailing flow rate, a change may be noticeable in the upstream speed and occupancy close to the in-
Detections
False Alarms
Detection Time 共s兲
5/5 5/5 5/5 5/5 5/5 5/5 5/5 5/5 5/5 5/5 5/5 5/5 60/60 共100%兲
0/150 0/150 0/150 0/150 0/150 0/150 0/150 1/150 0/150 2/150 1/150 0/150 4/1,800 共0.22%兲
164 252 384 480 92 132 176 228 96 84 116 132
cident location. This change in flow pattern upstream of an incident is the basis for the detection of an incident by the fuzzywavelet RBFNN incident detection model. The performance of the new algorithm and California algorithm on a two-, three-, and four-lane freeway is presented in Tables 2, 3, and 4, respectively. The results include the detection rate, the false alarm rate, and detection time for each simulated situation. The fuzzy-wavelet RBFNN model is a single-station algorithm, and, as described in the previous paragraph, its detection time depends on the distance of the station from the incident, the prevailing flow rate, and the capacity reduction at the incident location. The detection times for the California algorithm also depend on the same factors. However, because the California algorithm has a two-station logic, its detection time variation with distance is less pronounced. This behavior is evident from Fig. 4, which shows the variation of detection times for the new and California algorithms with distance of incident from the upstream station on a four-lane freeway with a prevailing flow rate of 2,000 vph per lane. Notice that the detection time is longer for the California algorithm at shorter distances and shorter at longer distances as compared to the new algorithm. Nonetheless, this difference is not significant, and for most practical purposes both
Table 3. Performance of New Incident Detection Model and California Algorithm #8 on Three-Lane Freeway New algorithm Flow rate 共vph per lane兲 1,000 1,000 1,000 1,000 1,500 1,500 1,500 1,500 2,000 2,000 2,000 2,000 Totals
Location 共m兲 152 305 457 610 152 305 457 610 152 305 457 610
California algorithm #8
Detections
False Alarms
Detection Time 共s兲
5/5 0/5 0/5 0/5 5/5 5/5 5/5 5/5 5/5 5/5 5/5 5/5 45/60 共75%兲
0/150 0/150 0/150 0/150 0/150 0/150 0/150 0/150 0/150 0/150 0/150 0/150 0/1,800 共0%兲
156 — — — 80 124 244 280 64 96 136 160
26 / JOURNAL OF TRANSPORTATION ENGINEERING / JANUARY/FEBRUARY 2002
Detections
False Alarms
Detection Time 共s兲
5/5 0/5 0/5 0/5 5/5 5/5 5/5 5/5 5/5 5/5 5/5 5/5 45/60 共75%兲
0/150 0/150 0/150 0/150 0/150 1/150 0/150 0/150 1/150 0/150 0/150 0/150 2/1,800 共0.11%兲
248 — — — 96 132 208 264 76 92 136 148
Table 4. Performance of New Incident Detection Model and California Algorithm #8 on Four-Lane Freeway New algorithm Flow rate 共vph per lane兲 1,000 1,000 1,000 1,000 1,500 1,500 1,500 1,500 2,000 2,000 2,000 2,000 Totals
Location 共m兲 152 305 457 610 152 305 457 610 152 305 457 610
California algorithm #8
Detections
False Alarms
Detection Time 共s兲
5/5 2/5 2/5 1/5 5/5 5/5 5/5 5/5 5/5 5/5 5/5 5/5 50/60 共83.3%兲
0/150 0/150 0/150 0/150 0/150 0/150 0/150 0/150 0/150 0/150 0/150 0/150 0/1,800 共0%兲
180 390 250 320 76 124 208 272 68 84 136 144
algorithms have similar detection time performances. The detection times are long, especially when the flow rate is low. When flow rate is high 共2,000 vph per lane兲, the detection time varies from 64 to 180 s. To shorten the time of response further, which is critical in heavy traffic, the detector stations have to be spaced closer than 762 m. The detection time 共for both the new and California algorithms兲 does not depend on the number of lanes in the freeway, provided the flow rate remains the same. This behavior is evident from Fig. 5, which shows the variation of detection times of the new algorithm with distance on a two-, three-, and four-lane freeway with a prevailing flow rate of 2,000 vph per lane. As observed from the figure, the detection times are practically the same for all freeway lane configurations. The detection times do depend on the flow rate. Fig. 6 shows the variation of detection times of the new algorithm with distance on a four-lane freeway when flow rates are 1,000, 1,500, and 2,000 vph per lane. At a distance of 152 m the detection time varies from 68 to 180 s as
Fig. 4. Comparison of incident detection times for new model and California algorithm #8 on four-lane freeway with flow rate of 2,000 vph per lane
Detections
False Alarms
Detection Time 共s兲
5/5 2/5 0/5 0/5 5/5 5/5 5/5 5/5 5/5 5/5 5/5 5/5 45/60 共75%兲
0/150 0/150 0/150 0/150 0/150 1/150 0/150 0/150 0/150 2/150 1/150 1/150 5/1,800 共0.28%兲
168 440 — — 96 132 188 268 84 96 128 140
the flow rate increases from 1,000 to 2,000 vph per lane. In all these simulations the reduction in capacity is the same and thus does not impact the detection times. The effects of flow rate and capacity reduction on detection times are interrelated. The detection times would decrease when the capacity is reduced further or when the flow rate is increased. Both new and California algorithms detected all incidents on a two-lane freeway 共Table 2兲, yielding a detection rate of 100%. On three- and four-lane freeways, both algorithms failed to detect some incidents for the smallest flow rate of 1,000 vph per lane 共Tables 3 and 4兲. This is because the reduced capacity after incident is still greater than the prevailing flow rate, and the impact on traffic on the upstream side is minimal. Both algorithms detected all five incidents when the incident is closest 共152 m兲 to an upstream detector station. The new model, however, performed better on the four-lane freeway, where it also detected some incidents located at distances greater than 305 m 共Table 4兲, yielding an overall detection rate of 83.3% as compared to 75% for the California algorithm.
Fig. 5. Incident detection time variation with number of lanes when flow rate is 2,000 vph per lane
JOURNAL OF TRANSPORTATION ENGINEERING / JANUARY/FEBRUARY 2002 / 27
Fig. 6. Incident detection time variation with flow rate on four-lane freeway
The fuzzy-wavelet RBFNN model did not signal any false alarms in all the simulated conditions, thus yielding a perfect false alarm rate of zero. The California algorithm, on the other hand, signaled several false alarms, especially under heavy traffic conditions. The comparison of the false alarm rate on a four-lane freeway is shown in Fig. 7. The new model is thus significantly superior to the California algorithm when it comes to false alarm performance, and this is a very important consideration in the evaluation of freeway incident detection algorithms for networkwide implementation.
Second Simulation Test—Freeway with On- and Off-Ramps In this test, the false alarm rate performance of the new and California algorithms is evaluated on a freeway with on- and off-
Fig. 7. Comparison of false alarm rates of new model and California algorithm #8 on four-lane freeway when flow rate is 1,000, 1,500, and 2,000 vph per lane
Fig. 8. Freeway geometry and detector station locations for second simulation test
ramps. The purpose of this test is to determine the portability of the algorithms to conditions of varying flow rates and freeway bottlenecks. These conditions are known to generate false alarms because they create traffic compression waves, stop-and-go traffic, and traffic chaos near on- and off-ramps. The geometry of the freeway, the location of the detector stations, and the on- and off-ramps are shown in Fig. 8 as five contiguous segments identified by the detector station numbers noted at the bottom of each segment. It consists of two on-ramps and two off-ramps. There are three through lanes and one auxiliary lane of length 244 m for each on- and off-ramp. Detector stations are spaced 610 or 762 m apart, 305 or 610 m upstream of the off-ramps, and 305 m upstream and downstream of the on-ramps. In the simulation model the motorists are warned in advance to the presence of an on- or an off-ramp downstream so that they can make appropriate lane change maneuvers in time. Four traffic flow scenarios are simulated for this geometric setup, as defined in Table 5. Each scenario consists of three time periods, each having a different through, on-, and off-ramp flow rate. The second time period in all the scenarios has a larger through-traffic flow rate than the first time period. This simulates sudden spikes in traffic flow. In the third time period, the flow rates drop back to the values in the first time period. Scenarios 1 and 2 simulate moderate to heavy flow conditions with moderate on-ramp traffic, while scenarios 3 and 4 simulate the same with heavy on-ramp traffic.
28 / JOURNAL OF TRANSPORTATION ENGINEERING / JANUARY/FEBRUARY 2002
Table 5. Definition of Four Simulation Scenarios Evaluated for
Three-Lane Freeway with Ramps Time Entry flow Scenario period rate number number 共vph兲 1 1 1 2 2 2 3 3 3 4 4 4
1 2 3 1 2 3 1 2 3 1 2 3
4,500 4,800 4,500 5,250 5,500 5,259 4,000 4,500 4,000 5,500 6,000 5,500
On-ramp flow rate Off-ramp flow rate 共vph兲 共vph兲 A
B
A
B
300 300 300 300 300 300 600 600 600 600 600 600
500 500 300 500 500 300 600 600 600 600 600 600
225 240 225 260 275 260 200 225 200 275 300 275
450 480 450 525 550 525 400 450 400 550 600 550
The presence of on- and off-ramps produces nonhomogeneity in traffic flow as vehicles undergo lane change maneuvers, either to exit the freeway or to accommodate entering traffic. Traffic flow in the vicinity of ramps is therefore chaotic, with frequent congestions and occasional stop-and-go traffic behaviors. This is especially true upstream of an on-ramp, where vehicles on the freeway have to accommodate heavy traffic entering from the on-ramp. The lane occupancy and speed downstream of the onramp is not significantly affected. Similarly, chaotic traffic flow often occurs upstream of an off-ramp. The false alarm rate performance of the new and California algorithms for the four simulated scenarios is presented in Table 6. The new fuzzy-wavelet RBFNN model outperformed the California algorithm #8 consistently under various scenarios 共Fig. 9兲. The false alarm rate ranges from 0 to 0.07% for the new algorithm and 0.53 to 3.82% for the California algorithm. It is observed that the false alarm rate of the California algorithm increases severalfold when flow rate is increased. From scenarios 1 to 2, the false alarm rate jumped from 0.98 to 2.34%, and from 0.53 to 3.82% from scenarios 3 to 4. The false alarm rate is larger for scenarios 3 and 4 for both algorithms as compared to scenarios 1 and 2 because of the heavier on-ramp traffic in simulations 3 and 4. The freeway segment between stations 4 and 5 generated the most false alarms. For example, in scenario 4 the California algorithm signaled 227 false alarms out of 1,125 decisions, whereas the new model generated only four false alarms. This result highlights the poor portability characteristics of the California algo-
Fig. 9. Comparison of false alarm rates of new model and California algorithm #8 for freeway with on- and off-ramps 共second simulation test兲
rithm. As Fig. 9 shows, there are large differences in occupancy values between stations 4 and 5, causing the California algorithm, which has a comparative logic, to generate false alarms. The performance may be improved if the algorithm is recalibrated using data from this particular location. However, this is not a practical solution to the problem. On the other hand, the fuzzy-wavelet RBFNN model has a single-station logic where each traffic pattern is normalized before classification, thus eliminating portability problems. Moreover, the new model uses a sufficiently long 共5 min 20 s for 16 20 s time periods兲 time-series pattern that reduces the impact of sudden changes in traffic flow. As a result, the new model signaled only a few false alarms, primarily at detector station 4 due to the close proximity of the station to the off-ramp and chaotic traffic situation at that station.
Test Using Real Data To further evaluate the performance of the new algorithm, real traffic data from two sources are used for testing. Artimis Sixteen traffic incident data from ARTIMIS were used to evaluate the new model. Each incident data sample consists of 30 s lane occupancy, speed, and flow rate values obtained from the up-
Table 6. False Alarm Performance of New Incident Detection Model and California Algorithm #8 for Three-Lane Freeway with Ramps False Alarms 共out of 1,125 Decisions兲 Scenario 1
Scenario 2
Scenario 3
Scenario 4
Station number
NEW
CALIFORNIA
NEW
CALIFORNIA
NEW
CALIFORNIA
NEW
CALIFORNIA
1 2 3 4 5 6 Percent
0 0 0 2 0 0 0.03
0 3 0 51 1 0.98
0 0 0 0 0 0 0
0 1 1 130 0 2.34
0 0 0 2 1 0 0.04
0 1 0 27 2 0.53
0 1 0 4 0 0 0.07
0 0 5 207 3 3.82
JOURNAL OF TRANSPORTATION ENGINEERING / JANUARY/FEBRUARY 2002 / 29
Table 7. Performance of New Incident Detection Model and Califor-
nia Algorithm #8 Using Real Traffic Data FSP Project ARTIMIS Detections New
NEW
CALIFORNIA
NEW
CALIFORNIA
16/16 100%
20/21 95.2%
19/21 90.5%
0/480 0%
3/480 0.63%
Detections
False alarms
stream detector station for 10 min preceding the time the incident is signaled. The fuzzy-wavelet RBFNN model detected all 16 incidents, resulting in a 100% detection rate 共Table 7兲. Moreover, in all cases the algorithm detected the incident before it was reported by the on-line incident logic used in ARTIMIS. The exact time of occurrence of the incident is not known; therefore, the detection time cannot be determined. The ARTIMIS incident data were for one 共the upstream兲 station only; thus, the two-station California algorithm could not be tested using those data. FSP Project’s I-880 Database Both incident and incident-free data from the FSP project’s I-880 database are used to evaluate the new and California algorithms. Data for 21 incidents that block one or more lanes are used. The times of occurrence of incidents and their locations are only known approximately as this information is recorded by human observers in a subjective manner. Based on this information, 20 min of 30 s lane occupancy and speed data are extracted from the stations upstream and downstream of the incidents. Four hours of incident-free data are also extracted from the database and tested for false alarms. The performance of the new and California algorithms based on this data set is presented in Table 7. The fuzzywavelet RBFNN model outperformed the California algorithm in both detection rate and false alarm rate. The California algorithm signaled three false alarms in 480 decisions, whereas the new algorithm correctly identified all of them as incident-free conditions. This test again shows the robustness and superior performance of the fuzzy-wavelet RBFNN model as compared to the California algorithm #8. Neither the new nor the California algorithms are retrained or recalibrated for the real data test, highlighting the superior portability characteristics of the new model.
sults indicate the clear superiority of the new model over the California algorithm #8. Both the new and California algorithms detected all incidents in moderate to heavy traffic. However, in light traffic 共flow rate of 1,000 vph per lane兲 on a four-lane freeway, the new model performed better than the California algorithm, detecting incidents even when they are more than 305 m downstream of the detector station. The detection times for both algorithms are identical for practical purposes. For a freeway segment with no on- and off-ramps, the new model signaled no false alarms while the California algorithm reported several false alarms, especially in heavy traffic. False alarms are a major hindrance to the widespread implementation of automatic freeway incident detection algorithms. They are not only a nuisance but also costly to the freeway management system. As a result, the false alarm rate performance of an algorithm is of utmost practical importance, especially on congested urban freeways with on- and off-ramps. In such simulated situations, the new model is found to perform much better than the California algorithm. For example, on a three-lane freeway segment with two on- and off-ramps and heavy flow rates 共scenario 4兲, the new model produced a false alarm rate of 0.07% as compared to 3.82% for the California algorithm. To further evaluate the robustness and portability of the new model, real data from ARTIMIS and the FSP project’s I-880 database are also used for testing. Again, the new algorithm outperformed the California algorithm in both detection rate and false alarm rate. The new fuzzy-wavelet RBFNN freeway incident detection model is a single-station pattern-based algorithm that is computationally efficient and requires no recalibration. It consistently outperformed the California algorithm #8, which is considered the benchmark algorithm for freeway incident detection and the one most widely used. This shows the promise of the new model to solve the decades-long quest for reliable automatic freeway incident detection on urban freeways. This research shows that the new model can be readily transferred without retraining and without any performance deterioration.
Acknowledgment This manuscript is based on a research project sponsored by the Ohio Department of Transportation and Federal Highway Administration.
Conclusion
References
In this paper, the performance of the new fuzzy-wavelet RBFNN freeway incident detection model is evaluated and compared to the benchmark California algorithm #8 using both real and simulated data. One qualitative and three quantitative performance measures are used for comparison. Besides the commonly used measures of detection rate, false alarm rate, and detection time, the qualitative measure of algorithm portability is also evaluated. This additional measure is of utmost practical importance because retraining and/or recalibration is not a practically feasible solution to poor algorithm performance under varying conditions. Therefore, in all the tests performed in this evaluation, no recalibration or retraining is done, and the algorithms were compared based on the three quantitative measures. More than 110 h of simulated data are generated on various freeway geometries and with different flow rates for testing. Re-
Adeli, H., and Hung, S. L. 共1995兲. Machine learning—Neural networks, genetic algorithms, and fuzzy sets, Wiley, New York. Adeli, H., and Karim, A. 共2000兲. ‘‘Fuzzy-wavelet RBFNN model for freeway incident detection.’’ J. Transp. Eng., 126共6兲, 464 – 471. Adeli, H., and Park, H. S. 共1998兲. Neurocomputing for design automation, CRC Press, Boca Raton, Fla. Adeli, H., and Samant, A. 共2000兲. ‘‘An adaptive conjugate gradient neural network-wavelet model for traffic incident detection.’’ Comput. Aided Civ. Infrastruct. Eng., 15, 251–260. Levin, M., and Krause, G. M. 共1979兲. ‘‘Incident-detection algorithms. Part 1: Off-line evaluation.’’ Transp. Res. Rec., 722, 49–58. Payne, H. J., and Tignor, S. C. 共1978兲. ‘‘Freeway incident-detection algorithms based on decision trees with states.’’ Transp. Res. Rec., Transportation Research Board, Washington, D.C., 682, 30–37. Samant, A., and Adeli, H. 共2000兲. ‘‘An adaptive conjugate gradient neural network-wavelet model for traffic incident detection.’’ Comput.-Aided Civ. Infrastruct. Eng., 15共4兲, 241–250.
30 / JOURNAL OF TRANSPORTATION ENGINEERING / JANUARY/FEBRUARY 2002