November 2000
•
NREL/TP-520-29245
Comparison of Module Performance Characterization Methods for Energy Production
B. Kroposki and W. Marion National Renewable Energy Laboratory
D. King, W. Boyson, and J. Kratochvil Sandia National Laboratories
National Renewable Energy Laboratory 1617 Cole Boulevard Golden, Colorado 80401-3393 NREL is a U.S. Department of Energy Laboratory Operated by Midwest Research Institute • Battelle • Bechtel Contract No. DE-AC36-99-GO10337
November 2000
•
NREL/TP-520-29245
Comparison of Module Performance Characterization Methods for Energy Production
B. Kroposki and W. Marion National Renewable Energy Laboratory
D. King, W. Boyson, and J. Kratochvil Sandia National Laboratories Prepared under Task No. PVP1.7101
National Renewable Energy Laboratory 1617 Cole Boulevard Golden, Colorado 80401-3393 NREL is a U.S. Department of Energy Laboratory Operated by Midwest Research Institute • Battelle • Bechtel Contract No. DE-AC36-99-GO10337
NOTICE This report was prepared as an account of work sponsored by an agency of the United States government. Neither the United States government nor any agency thereof, nor any of their employees, makes any warranty, express or implied, or assumes any legal liability or responsibility for the accuracy, completeness, or usefulness of any information, apparatus, product, or process disclosed, or represents that its use would not infringe privately owned rights. Reference herein to any specific commercial product, process, or service by trade name, trademark, manufacturer, or otherwise does not necessarily constitute or imply its endorsement, recommendation, or favoring by the United States government or any agency thereof. The views and opinions of authors expressed herein do not necessarily state or reflect those of the United States government or any agency thereof. Available electronically at http://www.doe.gov/bridge Available for a processing fee to U.S. Department of Energy and its contractors, in paper, from: U.S. Department of Energy Office of Scientific and Technical Information P.O. Box 62 Oak Ridge, TN 37831-0062 phone: 865.576.8401 fax: 865.576.5728 email:
[email protected] Available for sale to the public, in paper, from: U.S. Department of Commerce National Technical Information Service 5285 Port Royal Road Springfield, VA 22161 phone: 800.553.6847 fax: 703.605.6900 email:
[email protected] online ordering: http://www.ntis.gov/ordering.htm
Printed on paper containing at least 50% wastepaper, including 20% postconsumer waste
Table of Contents 1.0 INTRODUCTION .................................................................................................................................. 1 2.0 MODULE PERFORMANCE CHARACTERIZATION TECHNIQUES......................................... 2 2.1 NREL TECHNIQUE ................................................................................................................................ 2 2.2 SANDIA TECHNIQUE .............................................................................................................................. 3 3.0 VALIDATION PARAMETERS............................................................................................................ 5 3.1 MODULE DESCRIPTIONS ........................................................................................................................ 5 3.2 DATA COLLECTION ................................................................................................................................ 5 3.3 DATA QUALITY ASSESSMENT AND TEST DATA USED ........................................................................... 6 4.0 VALIDATION RESULTS ..................................................................................................................... 7 4.1 DAILY ENERGY DIFFERENCES VS. DATE ............................................................................................... 9 4.2 DAILY ENERGY DIFFERENCE VS. INCIDENT SOLAR RADIATION .......................................................... 14 4.3 HOURLY ENERGY DIFFERENCES VS. DATE ......................................................................................... 19 4.4 HOURLY ENERGY DIFFERENCE VS. INCIDENT SOLAR RADIATION ....................................................... 25 4.5 HOURLY ENERGY DIFFERENCES VS. MODULE TEMPERATURE ............................................................ 30 4.6 USING SPECIFIC DAILY DATA TO MATCH MODULE ENERGY RATING DAYS ....................................... 35 4.7 ANNUAL ENERGY AND AVERAGE ENERGY PER DAY .......................................................................... 49 5.0 CONCLUSIONS ................................................................................................................................... 52 6.0 ACKNOWLEDGEMENTS ................................................................................................................. 54 7.0 REFERENCES...................................................................................................................................... 54
ii
List of Figures Figure 4.1 Daily Energy Difference (NREL vs. Measured) for Multi-Crystalline Silicon ............................. 9 Figure 4.2 Daily Energy Difference (SNL vs. Measured) for Multi-Crystalline Silicon ................................ 9 Figure 4.3 Daily Energy Difference (NREL vs. Measured) for Dual-Junction Amorphous Silicon ............ 10 Figure 4.4 Daily Energy Difference (SNL vs. Measured) for Multi-Crystalline Silicon .............................. 10 Figure 4.5 Daily Energy Difference (NREL vs. Measured) for Triple-Junction Amorphous Silicon .......... 11 Figure 4.6 Daily Energy Difference (SNL vs. Measured) for Triple-Junction Amorphous Silicon ............. 11 Figure 4.7 Daily Energy Difference (NREL vs. Measured) for CdS/CdTe .................................................. 12 Figure 4.8 Daily Energy Difference (SNL vs. Measured) for CdS/CdTe ..................................................... 12 Figure 4.9 Daily Energy Difference (NREL vs. Measured) for CIGSS........................................................ 13 Figure 4.10 Daily Energy Difference (SNL vs. Measured) for CIGSS......................................................... 13 Figure 4.11 Daily Energy Difference (NREL vs. Measured) for Multi-Crystalline Silicon ......................... 14 Figure 4.12 Daily Energy Difference (SNL vs. Measured) for Multi-Crystalline Silicon ............................ 14 Figure 4.13 Daily Energy Difference (NREL vs. Measured) for Dual-Junction Amorphous Silicon .......... 15 Figure 4.14 Daily Energy Difference (SNL vs. Measured) for Dual-Junction Amorphous Silicon ............. 15 Figure 4.15 Daily Energy Difference (NREL vs. Measured) for Triple-Junction Amorphous Silicon......... 16 Figure 4.16 Daily Energy Difference (SNL vs. Measured) for Triple-Junction Amorphous Silicon ........... 16 Figure 4.17 Daily Energy Difference (NREL vs. Measured) for CdS/CdTe ................................................ 17 Figure 4.19 Daily Energy Difference (NREL vs. Measured) for CIGSS...................................................... 18 Figure 4.20 Daily Energy Difference (SNL vs. Measured) for CIGSS......................................................... 18 Figure 4.21 Hourly Energy Difference (NREL vs. Measured) for Multi-Crystalline Silicon....................... 20 Figure 4.22 Hourly Energy Difference (SNL vs. Measured) for Multi-Crystalline Silicon.......................... 20 Figure 4.23 Hourly Energy Difference (NREL vs. Measured) for Dual Junction Amorphous Silicon ........ 21 Figure 4.24 Hourly Energy Difference (SNL vs. Measured) for Dual Junction Amorphous Silicon ........... 21 Figure 4.25 Hourly Energy Difference (NREL vs. Measured) for Triple Junction Amorphous Silicon ...... 22 Figure 4.26 Hourly Energy Difference (SNL vs. Measured) for Triple Junction Amorphous Silicon ......... 22 Figure 4.27 Hourly Energy Difference (NREL vs. Measured) for CdTe...................................................... 23 Figure 4.28 Hourly Energy Difference (SNL vs. Measured) for CdTe......................................................... 23 Figure 4.29 Hourly Energy Difference (NREL vs. Measured) for CIGSS ................................................... 24 Figure 4.30 Hourly Energy Difference (SNL vs. Measured) for CIGSS ...................................................... 24 Figure 4.31 Hourly Energy Difference (NREL vs. Measured) for Multi-Crystalline Silicon....................... 25 Figure 4.32 Hourly Energy Difference (SNL vs. Measured) for Multi-Crystalline Silicon.......................... 25 Figure 4.33 Hourly Energy Difference (NREL vs. Measured) for Dual Junction Amorphous Silicon ........ 26 Figure 4.34 Hourly Energy Difference (SNL vs. Measured) for Dual Junction Amorphous Silicon ........... 26 Figure 4.35 Hourly Energy Difference (NREL vs. Measured) for Triple Junction Amorphous Silicon ...... 27 Figure 4.36 Hourly Energy Difference (NREL vs. Measured) for Triple Junction Amorphous Silicon ...... 27 Figure 4.37 Hourly Energy Difference (NREL vs. Measured) for CdTe...................................................... 28 Figure 4.38 Hourly Energy Difference (SNL vs. Measured) for CdTe......................................................... 28 Figure 4.40 Hourly Energy Difference (SNL vs. Measured) for CIGSS ...................................................... 29 Figure 4.41 Hourly Energy Difference (NREL vs. Measured) for Multi-Crystalline Silicon....................... 30 Figure 4.42 Hourly Energy Difference (SNL vs. Measured) for Multi-Crystalline Silicon.......................... 30 Figure 4.43 Hourly Energy Difference (NREL vs. Measured) for Dual Junction Amorphous Silicon ........ 31 Figure 4.44 Hourly Energy Difference (SNL vs. Measured) for Dual Junction Amorphous Silicon ........... 31 Figure 4.45 Hourly Energy Difference (NREL vs. Measured) for Triple Junction Amorphous Silicon ...... 32 Figure 4.46 Hourly Energy Difference (SNL vs. Measured) for Triple Junction Amorphous Silicon ......... 32 Figure 4.47 Hourly Energy Difference (NREL vs. Measured) for CdTe...................................................... 33 Figure 4.48 Hourly Energy Difference (SNL vs. Measured) for CdTe......................................................... 33 Figure 4.49 Hourly Energy Difference (NREL vs. Measured) for CIGSS ................................................... 34 Figure 4.50 Hourly Energy Difference (SNL vs. Measured) for CIGSS ...................................................... 34 Figure 4.51 Measured Power vs. Modeled Power (Cold Sunny Day – Multi crystalline Silicon)................ 36 Figure 4.52 Measured Power vs. Modeled Power (Cold Cloudy Day – Multi crystalline Silicon) .............. 36 Figure 4.53 Measured Power vs. Modeled Power (Nice Day – Multi crystalline Silicon) ........................... 37 Figure 4.54 Measured Power vs. Modeled Power (Hot Cloudy Day – Multi crystalline Silicon) ................ 37 Figure 4.55 Measured Power vs. Modeled Power (Hot Sunny Day – Multi crystalline Silicon) ................. 38
iii
Figure 4.56 Measured Power vs. Modeled Power (Cold Sunny Day – Dual-Junction Amorphous Silicon) 38 Figure 4.57 Measured Power vs. Modeled Power (Cold Cloudy Day – Dual-Junction Amorphous Silicon) .............................................................................................................................................................. 39 Figure 4.58 Measured Power vs. Modeled Power (Nice Day – Dual-Junction Amorphous Silicon) ........... 39 Figure 4.59 Measured Power vs. Modeled Power (Hot Cloudy Day – Dual-Junction Amorphous Silicon) 40 Figure 4.60 Measured Power vs. Modeled Power (Hot Sunny Day – Dual-Junction Amorphous Silicon).. 40 Figure 4.61 Measured Power vs. Modeled Power (Cold Sunny Day – Triple-Junction Amorphous Silicon) .............................................................................................................................................................. 41 Figure 4.62 Measured Power vs. Modeled Power (Cold Cloudy Day – Triple-Junction Amorphous Silicon) .............................................................................................................................................................. 41 Figure 4.63 Measured Power vs. Modeled Power (Nice Day – Triple-Junction Amorphous Silicon) ......... 42 Figure 4.64 Measured Power vs. Modeled Power (Hot Cloudy Day – Triple-Junction Amorphous Silicon) .............................................................................................................................................................. 42 Figure 4.65 Measured Power vs. Modeled Power (Hot Sunny Day – Triple-Junction Amorphous Silicon) 43 Figure 4.66 Measured Power vs. Modeled Power (Cold Sunny Day – Cadmium Telluride) ....................... 43 Figure 4.67 Measured Power vs. Modeled Power (Cold Cloudy Day – Cadmium Telluride)...................... 44 Figure 4.68 Measured Power vs. Modeled Power (Nice Day – Cadmium Telluride)................................... 44 Figure 4.69 Measured Power vs. Modeled Power (Hot Cloudy Day – Cadmium Telluride) ....................... 45 Figure 4.70 Measured Power vs. Modeled Power (Hot Sunny Day – Cadmium Telluride) ......................... 45 Figure 4.71 Measured Power vs. Modeled Power (Cold Sunny Day – Copper Indium Diselenide) ............ 46 Figure 4.72 Measured Power vs. Modeled Power (Cold Cloudy Day – Copper Indium Diselenide)........... 46 Figure 4.73 Measured Power vs. Modeled Power (Nice Day – Copper Indium Diselenide)........................ 47 Figure 4.74 Measured Power vs. Modeled Power (Hot Cloudy Day – Copper Indium Diselenide) ............ 47 Figure 4.75 Measured Power vs. Modeled Power (Hot Sunny Day – Copper Indium Diselenide) .............. 48 Figure 4.76 Average Daily Energy per Month, Measured vs. Modeled for Multi-Crystalline Silicon Module.................................................................................................................................................. 49 Figure 4.77 Average Daily Energy per Month, Measured vs. Modeled for Dual-Junction a-Si Module...... 50 Figure 4.78 Average Daily Energy per Month, Measured vs. Modeled for Triple-Junction a-Si Module.... 50 Figure 4.79 Average Daily Energy per Month, Measured vs. Modeled for CdTe Module........................... 51 Figure 4.80 Average Daily Energy per Month, Measured vs. Modeled for Thin-Film CIGS Module ......... 51
iv
List of Tables Table 1. Module Descriptions........................................................................................................................ 5 Table 2. NREL Method. Differences in daily, hourly, and annual energy production, modeled vs. measured. .............................................................................................................................................. 52 Table 3. Sandia Method. Differences in daily, hourly, and annual energy production, modeled vs. measured. .............................................................................................................................................. 52 Table 4. Values for Module Energy Production (Wh) based on five selected days...................................... 53 Table 5. Differences (%) between calculated and measured daily energy for both models on five selected days. ...................................................................................................................................................... 53
v
1.0 Introduction In the early 1990s, researchers at both the National Renewable Energy Laboratory (NREL) and Sandia National Laboratories (SNL) started developing methodologies to predict module and array performance under actual operating conditions. In 1994, NREL conducted research to determine how well module energy rating techniques of that time predicted power output. From this research, NREL initiated an effort to develop a consensus-based approach to rating photovoltaic modules. This new approach was intended to complement the de facto standard for module power rating at Standard Reporting Conditions [1]. Using technical input from a number of sources and under the guidance of an industry-based Technical Review Committee, an approach was developed to predict module performance and to determine a module energy rating [2]. A module energy rating (MER) was developed that consists of 10 estimates of the energy produced by a module in one day: one estimate for each of five different weather/location combinations. The five weather and location combinations are representative of the range of environmental conditions anticipated for typical uses of PV modules in the contiguous United States. The final locations were chosen based on criteria developed by the Technical Review Committee for describing the following day types: Hot Sunny, Hot Cloudy, Cold Sunny, Cold Cloudy, and Nice (Cool Sunny). To correctly rate a PV module at the five weather conditions, an accurate way was needed to model PV module performance under all operating conditions. NREL has developed and validated one such method [3]. The NREL method characterizes the module performance under laboratory conditions and uses several established analytical models to translate this performance matrix to outdoor conditions using irradiance, air temperature, and spectral response of the module. In 1991, Sandia initiated an effort to develop improved outdoor performance measurement methods and a performance model for modules and arrays, with the goal of improving the performance models used for PV system design. The resulting methods were first applied in the field at the array level in 1995 [4]. The Sandia methods have continued to evolve, based on extensive outdoor module testing, now providing a method for predicting module output under any operating condition [5]. The Sandia method compensates for the influences of irradiance, temperature, air mass, and angle-of-incidence on module performance. Parameters required for module performance modeling are determined directly using specific outdoor test procedures, with the module mounted on a two-axis solar tracker during a period of one or more days. Sandia’s performance model was designed to be applicable to all module technologies, including Thin-Film and concentrators. This report compares the two methods of determining the performance of PV modules. The methods translate module performance characterized in a laboratory to actual or reference conditions using slightly different approaches. The accuracy of both methods is compared for both hourly and daily energy production over a year of data recorded at NREL in Golden, CO. The comparison of the two methods will be presented for five different PV module technologies: multicrystalline silicon (mc-Si), dual-junction amorphous silicon (a-Si/a-Si:Ge), triple-junction amorphous silicon (a-Si/a-Si/a-Si:Ge), cadmium telluride (CdTe), and copper indium diselenide (CIGSS).
1
2.0 Module Performance Characterization Techniques 2.1 NREL Technique The method developed at NREL is fully described in reference [2]. This method characterizes the PV module performance under laboratory conditions, and then uses translation procedures to estimate performance for the outdoor conditions. Three technical areas address implementing the NREL method: (1) determining PV module temperature and irradiance correction factors and functions, (2) determining the irradiance and PV module temperature for the desired time and location, and (3) translating a reference current-voltage (I-V) curve to the irradiance and PV module temperature conditions. Based on Annex A2 of ASTM E1036-96 [5], with modifications, the PV module temperature and irradiance correction factors and functions are determined from a matrix of short-circuit current (Isc) and open-circuit voltage (Voc) values resulting from I-V curve measurements over a range of six irradiances (150-1000 W/m2) and six operating temperatures (5°-60°C). Three correction factors and functions are determined: α, the Isc correction factor for temperature; β(E), the Voc correction for temperature as a function of irradiance, E; and δ(T), and the Voc correction for irradiance as a function of the PV module temperature, T. Solar radiation and meteorological data are used to model values of incident irradiance and PV module temperature for a desired hour. The incident irradiance is determined by:
∫ E (λ )SR(λ )dλ ⋅1000 W/m2 E= ∫ E (λ )SR(λ )dλ b
a b
a
INC
,
REF
(1) where: λ EINC(λ)
= wavelength = incident spectral irradiance
EREF(λ)
= AM1.5 spectral irradiance [6]
SR(λ)
= module spectral response per [7].
For series-connected multijunction modules, the spectral response of the junction that gives the smallest numerator (current at actual conditions) is used to evaluate the numerator, and the spectral response of the junction that gives the smallest denominator (current at reference conditions) is used to evaluate the denominator. Spectral responses for two junctions are required to evaluate equation 1 if one junction is the current-limiting factor at reference conditions and the other junction is the current-limiting factor at actual conditions. The model SEDES2 [8] is used to calculate the incident spectral irradiance. A model developed by Fuentes [9] for use in the simulation program PVFORM is used to determine PV module temperature from the air temperature, wind speed, solar radiation, and the PV module’s normal operating cell temperature (NOCT). Using the incident irradiance and the PV module temperature, Isc and Voc are calculated and a reference I-V curve is translated to determine maximum power. These procedures are based on modifications to ASTM E1036-96 and use equations 2 and 3 for Isc and Voc. In equations 2 and 3, the zero subscripts denote Standard Reporting Conditions (SRC).
2
Isc =
E ⋅ Isc 0 ⋅ [1 + α ⋅ (T − T0 )] E0
(2)
Voc = Voc 0 ⋅ [1 + β (E 0 ) ⋅ (T − T0 )][1 + δ (T ) ⋅ ln(E / E 0 )] .
(3)
For determining the I-V curve for desired conditions, a reference I-V curve is selected for translation from the matrix of I-V curves measured to determine the correction factors and functions. The I-V curve selected for the reference is the one measured under the conditions of irradiance and temperature closest to those desired. This minimizes errors caused by the I-V curve translation not accounting for changes in fill factor with changes in temperature and irradiance. Each I-V data pair of the reference I-V curve is then translated to the desired conditions using equations 4 and 5. The subscript R refers to the reference I-V curve, and Isc and Voc are determined with equations 2 and 3. Isc I = IR ⋅ (4) Isc R V = VR ⋅
Voc . Voc R
(5)
Because the translation procedure does not change the fill factor, the reference I-V curve data pair for maximum power becomes the translated I-V curve data pair for maximum power. To determine the current at a specified voltage, the current may be interpolated using the two adjacent I-V curve data pairs from the translated I-V curve with voltages above and below the specified voltage. 2.2 Sandia Technique
The Sandia performance model and related outdoor test procedures are described in reference [5]. Only minor modifications to the performance model have been made since this publication appeared in 1998. The original goals in developing the Sandia method were the following: (1) test procedures and performance model would be applicable to all PV technologies at both the module and array level, (2) all required performance parameters could be determined experimentally using outdoor test procedures, and (3) the accuracy of the performance model would clearly meet the needs of PV system designers. The first two goals have been achieved, and work such as documented in this paper will help determine if the third goal has been achieved. Basically, three separate outdoor test procedures are performed by Sandia to obtain the required module parameters used in the performance model. Tests are performed with the module mounted on a two-axis solar tracker. Typically, I-V measurements are recorded over a day-long period of time with at least half of the day (morning or afternoon) exhibiting clear-sky conditions. The measurements during clear-sky conditions provide performance parameters at the ASTM Standard Reporting Conditions, as well as an empirical relationship quantifying the influence of solar spectral variation on short-circuit current. The measurements recorded during overcast or cloudy conditions provide parameters that describe module voltage at low irradiance levels. A shade/unshade procedure is used to measure separate temperature coefficients for short-circuit current (Isc), maximum-power current (Imp), open-circuit voltage (Voc), and maximum-power voltage (Vmp). The third test procedure involves moving the solar tracker through a programmed sequence of offset angles to quantify the influence on Isc of the angle-of-incidence of the beam component of irradiance. Separately quantifying the spectral, angle-of-incidence, and thermal influences makes it possible to linearize most of the elements of the performance model, while at the same time maintaining equations in the model that are consistent with solar cell physics. The set of equations used in the Sandia performance model is given below: Isc = Isco⋅f1(AMa)⋅{(Eb⋅f2(AOI)+fd⋅Ediff) / Eo}⋅{1+αIsc⋅(Tc-To)} Ee = Isc / [Isco⋅{1+αIsc⋅(Tc-To)}] Imp = Impo ⋅{C0⋅Ee + C1⋅Ee2}⋅{1 + αImp⋅(Tc-To)}
3
(6) (7) (8)
δ(Tc) = n⋅k⋅(Tc+273.15) / q Voc = Voco + Ns⋅δ(Tc)⋅ln(Ee) + βVoc(Ee)⋅(Tc-To) Vmp = Vmpo + C2⋅Ns⋅δ(Tc)⋅ln(Ee) + C3⋅Ns⋅{δ(Tc)⋅ln(Ee)}2 + βVmp(Ee)⋅(Tc-To) Pmp = Imp⋅Vmp Where: Isc = Module short-circuit current, (A) Imp = Current at maximum-power point, (A) Voc = Open-circuit voltage, (V) Vmp = Voltage at maximum-power point, (V) Pmp = Power at maximum-power point, (W) Eb = Edni cos(AOI), beam irradiance, (W/m2) Ediff = Diffuse irradiance, (W/m2) fd = Fraction of diffuse irradiance used by module Ee = “Effective” irradiance, dimensionless, or “suns” Eo = Reference irradiance, 1000 W/m2 AMa = Absolute air mass, dimensionless, calculated from sun elevation angle and site altitude AOI = Solar angle-of-incidence, angle between normal and beam component of sunlight, degrees Tc = Temperature of cells inside module, (°C) To = Reference temperature for performance model, (°C) f1(AMa) = Empirically determined polynomial relating spectral influence on Isc to air mass f2(AOI) = Empirically determined polynomial describing AOI influence on Isc Isco = Isc(E=1000 W/m2, AMa =1.5, Tc =25 °C, AOI=0°), (A) Impo = Imp(Ee =1, Tc = To), (A) Voco = Voc(Ee =1, Tc = To ), (V) Vmpo = Vmp(Ee =1, Tc = To ), (V) αIsc = Normalized temperature coefficient for Isc, (1/°C) αImp = Normalized temperature coefficient for Imp, (1/°C) βVoc(Ee) = βVoco + mβVoc⋅(1-Ee) = Temperature coefficient as a function of irradiance, (V/°C) βVoco = Temperature coefficient for Voc at 1000 W/m2, (V/°C) mβVoc = Coefficient providing irradiance dependence for temperature coefficient, (V/°C) βVmp(Ee) = βVmpo +mβVmp⋅(1-Ee) = Temperature coefficient as a function of irradiance, (V/°C) βVmpo = Temperature coefficient for Vmp at 1000 W/m2, (V/°C) mβVmp = Coefficient providing irradiance dependence for temperature coefficient, (V/°C) Ci = Empirically determined coefficients from outdoor tests n = Empirically determined diode factor for each cell in module (dimensionless) Ns = Number of cells in series in a cell-string k = Boltzmann’s constant, 1.38066E-23, (J/K) q = Elementary charge, 1.60218E-19, (coulomb) δ(Tc)⋅= (n⋅k⋅Tc)/q , “thermal voltage” per cell, Tc in Kelvin.
4
(9) (10) (11)
3.0 Validation Parameters 3.1 Module Descriptions
Table 1 lists information for each of the modules used in this study, including the number of hourlyaveraged data points used in both performance models. More in-depth information can be found in reference [2]. Table 1. Module Descriptions Data Pts. Data Pts. (NREL) (SNL) Multi-Crystalline Silicon (mc-Si) 3691 3685 Dual-Junction Amorphous Silicon (Dual 3331 3336 Junction Amorphous Silicon) Triple-Junction Amorphous Silicon (Triple 3360 3362 Junction Amorphous Silicon) Copper Indium Diselenide (CIGSS) 3348 3318 Cadmium Telluride (CdTe) 2863 3159
Module Type
Area (m2)
Pmax-STC
0.521 0.357
52.8 22.9
0.452
33.4
0.400 0.720
40.2 52.5
3.2 Data Collection
The data used for this validation study were taken for the entire calendar year of 1998. The PV modules were part of a group located on the lower roof of NREL’s Outdoor Test Facility (OTF). The group of modules was associated with an effort at NREL called the Performance and Energy Ratings Testbed (PERT). The PV modules faced south ±2° with a tilt from horizontal of 40° ±1°. The tilt angle corresponds approximately to the latitude for the OTF site, whose coordinates are more precisely 39.74° North latitude and 105.18° West longitude. The data acquisition systems associated with the PERT recorded hourly or half-hourly values of module maximum power, as well as values for module backsurface temperatures, wind speed, and plane-of-array (POA) irradiance. In addition, solar radiation and meteorological data were also recorded at two other sites: the Reference Meteorological and Irradiance Station (RMIS) weather station and the Solar Radiation Research Laboratory (SRRL). The RMIS weather station is adjacent to the OTF building, and the SRRL weather station is on top of the mesa north of the OTF. Modules associated with the PERT were not manually cleaned, so natural soiling and cleaning (rain or snow) introduced uncontrolled variations in the measured data set. Unless faulty, the RMIS data were used for model input. If the RMIS data were faulty, SRRL data were used. For the model comparison, measured values of PV module temperature and POA irradiances were used with the Sandia method, whereas these values were modeled for use with the NREL method. Each module is electrically connected to one of the DAS channels using a four-wire electrical measurement scheme. Two wires are used for conducting the module power/current across a series-combination of MOSFET (metal oxide semiconductor field effect transistor) power transistor and metal shunt resistor housed inside the Multi-Tracer. The other two leads are used for sensing the voltage close to the module terminals. There is one MOSFET and metal shunt element associated for each channel on the Multi-Tracer. The measurement scheme uses the voltage-sense leads to accurately gauge the voltage at the terminals of the PV modules, while the current flowing through is picked up as a small voltage developed across the metal shunts. The metal shunts are typically 2 milliohm resistance values, and they have negligible power dissipated across them. The module I-V characteristics are traced by stepping the conductance of each of the power MOSFETs. In effect, these behave as programmable resistors. As a result of this method, and because of parasitic resistances, the measurement system can only approximate the module short-circuit current (Isc), which has to be obtained by extrapolation to zero voltage. Note that this does not affect the accurate determination of the PV module’s maximum power point current and voltage. The power leads for these modules are #12-gauge wire that exhibits ~ 1.65 milliohms resistance per linear foot length. The power leads are typically between 20 and 40 feet in length, or equivalently, ~ 0.10 – 0.13 ohms total electrical resistance in series with the power MOSFET. The RD-1200 Multi-Tracers can sense module voltages up to 100 volts, and currents up to 15 amps. High module voltages are measured by first passing
5
them through precision voltage dividers before being quantified by analog-to-digital (ADC) converters. Additionally, there are separate thermocouple (TC) inputs, associated with each channel, used for sensing module temperatures. All of the TCs (type ‘T’) are typically bonded to the back of the modules near their midsection. TC measurements are corrected to common-junction temperatures using internal compensation circuits inside the Multi-Tracers. 3.3 Data Quality Assessment and Test Data Used
To ensure reasonable results, data were assessed for quality and only data meeting quality assessment thresholds were used to validate the performance models. For the data analysis, the solar radiation, meteorological, and PV module data were checked for out-of-range and missing values to eliminate hours with bad data. Simple checks for out-of-range values do not detect all bad data; consequently, additional checks were made. Due to inherent differences in the NREL and Sandia performance models, there were also a few differences in the way that measured data were used in the models. The NREL method uses modeled values for POA irradiance, and the measured inputs for this model came from either the RMIS or SRRL. Similarly, the NREL method uses a model to determine module operating temperature based on irradiance, wind speed, and ambient temperature. For the NREL analysis, RMIS data were used unless faulty, in which case SRRL data were used. For the data analysis, the solar radiation, meteorological, and PV module data were checked for out-of-range and missing values to eliminate hours with clearly erroneous data. The Sandia method used measured values for the POA irradiance indicated by the PERT instruments located adjacent to the modules, as well as directly measured module temperatures. In addition, the modules used in the analysis have not been characterized outdoors using Sandia’s test procedures. Rather, the family of I-V curves measured in the lab at NREL was analyzed to obtain parameters required in the Sandia performance model. The effect of using procedures designed for analyzing outdoor performance measurements to analyze data obtained using a solar simulator could not be quantified. The empirical relationships Sandia used to account for solar spectral influence and for solar AOI were obtained from measurements made at Sandia on modules similar to those at the PERT. Solar Radiation. Direct-normal and diffuse-horizontal radiation are required input variables for the Perez plane-of-array radiation model and the SEDES2 spectral model. Using established quality assessment procedures, these two elements, along with global-horizontal radiation, are checked with the equation:
Kt = Kd + Kn, where: Kt Kd Kn
= global horizontal radiation ÷ extraterrestrial horizontal radiation = diffuse horizontal radiation ÷ extraterrestrial horizontal radiation = direct normal radiation ÷ extraterrestrial radiation.
Acceptable solar radiation values will satisfy the equation within an arbitrary error limit. For this study, the error limit was set at 0.05 for sun elevations above 10°, and 0.10 for sun elevations of 10° and below, where instrument errors are greater. If RMIS data were missing or not within the error limit, SRRL data were tested. If the SRRL data were within the error limit, the SRRL data were used for model inputs; otherwise, the hour’s data were not used for data analysis. An additional check ensured consistency between the direct normal and diffuse horizontal radiation values and the tilt radiation values measured by the pyranometer located in the plane of the modules. If Perez
6
modeled values and measured values for POA irradiance were not within ±75 W/m2 (about 3 or 4 times the Root Mean Square error (RMSE) of the Perez model), the hour’s data were not used for data analysis. Meteorological Data. If RMIS meteorological data were missing or out-of-range, SRRL data were used in their place. This applied to dry bulb temperature, relative humidity, and atmospheric pressure. Wind speeds from PERT I or PERT II were used for model input to the Fuentes temperature model. The calibration constants for the anemometers were taken from manufacturer supplied values. Surface Albedo. Surface albedo values were determined from SRRL data as the ratio of measured radiation from the inverted pyranometer to the measured radiation from the global horizontal pyranometer. Albedos were restricted to values ranging from 0.2, a nominal value for green vegatation and some soil types, to 0.9, a value for dry new snow. Albedo is an input value for the Perez solar radiation model. Snow Days. Thirty-one days for 1998 were excluded from data analysis because of the occurrence of new or recent snowfall. Snow reduces PV output by shading the PV module and also causes erroneous radiometer readings. Snow days were determined from local newspaper records. They include: January 6; February 16; March 7, 8, 9, 10, 11, 18, 19, 20, 30, and 31; April 3, 6, 8, 15, 16, 17, 18, and 19; November 7, 8, 9, 10, and 11; and December 9, 10, 19, 20, 21, and 22. PV Module Shading. The output of the CdS/CdTe PV module was observed to be 25% lower than expected for early morning and late afternoon hours during the summer. Examination of the PV module revealed that the mounting structure, located north but slightly higher than the PV module, would cast a shadow on the uppermost cell for these times. Because the shadowed cell would limit the PV module output, the sun position and the PV module and mounting structure geometry were used to exclude any hours when the mounting structure would shade the PV module from direct normal radiation. The mounting structure also obscures the uppermost cell’s view of the sky dome, with a corresponding reduction in sky diffuse radiation received by the cell. The data analysis did not account for this reduction in diffuse radiation. The effect is small for clear and partly sunny conditions; but for overcast skies where the PV module receives only diffuse radiation, the reduction of PV output was more noticeable.
A solar position algorithm was used to eliminate data from the analysis when the direct beam radiation was reduced from shadowing. PV Data. Examination of the data showed that there were a few times when the PV data for one or more modules were obviously faulty. These times were identified as February 1, hour 9; February 4, hour 14; July 8, hour 13; July 22, hour 9; September 16, hours 12 and 13; and December 14, all day.
Table 1 gives the number of hourly-averaged values used in the NREL and Sandia performance models for each module after the data has been screened and outliers have been eliminated.
4.0 Validation Results Modeled and measured energy was compared on an hourly and daily basis. Using hourly input data from the PERT, RMIS, and SRRL data set, the NREL and Sandia methods calculated hourly PV module energy and summed the hourly values to determine daily PV module energy. Suitability of the NREL and Sandia methods was evaluated by calculating the differences between modeled and measured energy. Expressed as a percentage of the measured value, differences (modeled minus measured) for daily energy as a function of the day of the year are shown in Figures 4.1 through Figures 4.10 and as a function of the incident daily solar radiation in Figures 4.11 through 4.20. Although the absolute differences are less, larger percentage differences are observed at the lower values of solar radiation. With the exception of the triple-junction amorphous silicon module, results for both the NREL and Sandia methods compared favorably with the estimated PV performance measurement uncertainty of 4% [2]. Typical overall averages of the daily differences were 2% or less for each module, and standard deviations
7
were 3%-4%. For the triple-junction amorphous silicon module, the NREL method on average estimated the energy 6% low. This may partly be due to the difficulty in assigning a power rating to this module. Tests for power rating at SRC were performed three times, giving three different ratings: August 20, 1997 – 37.0 W; March 10, 2000 – 31.5 W; and June 23, 2000 – 33.4 W. For this work, the 33.4 W rating was used with the NREL model because it was thought that it might represent an average value as the module undergoes its seasonal variations in efficiency. However, a slightly higher rating may be appropriate for the year 1998 that was used for the model validation. This would have improved the NREL results.
8
4.1 Daily Energy Differences vs. Date
Multi-crystalline Silicon 30
Average = -0.3% Standard Deviation = 2.9%
20
10
0
-10
-20
-30 12/1/97
1/30/98
3/31/98
5/30/98
7/29/98
9/27/98
11/26/98
1/25/99
Date Figure 4.1 Daily Energy Difference (NREL vs. Measured) for Multi-Crystalline Silicon
Multi-crystalline Silicon 30 Average = +1.7% Standard Deviation = 2.9% 20
10
0
-10
-20
-30 1-Dec-97
30-Jan-98
31-Mar-98
30-May-98
29-Jul-98
27-Sep-98
26-Nov-98
25-Jan-99
Date Figure 4.2 Daily Energy Difference (SNL vs. Measured) for Multi-Crystalline Silicon
9
Dual-Junction Amorphous Silicon 30
Average = -1.1% Standard Deviation = 4.8%
20
10
0
-10
-20
-30 12/1/97
1/30/98
3/31/98
5/30/98
7/29/98
9/27/98
11/26/98
1/25/99
Date Figure 4.3 Daily Energy Difference (NREL vs. Measured) for Dual-Junction Amorphous Silicon
Dual-Junction Amorphous Silicon 30 Average = +0.4% Standard Deviation = 4.4% 20
10
0
-10
-20
-30 1-Dec-97
30-Jan-98
31-Mar-98
30-May-98
29-Jul-98
27-Sep-98
26-Nov-98
25-Jan-99
Date Figure 4.4 Daily Energy Difference (SNL vs. Measured) for Multi-Crystalline Silicon
10
Triple-Junction Amorphous Silicon 30
Average = -6.0% Standard Deviation = 3.9%
20
10
0
-10
-20
-30 12/1/97
1/30/98
3/31/98
5/30/98
7/29/98
9/27/98
11/26/98
1/25/99
Date Figure 4.5 Daily Energy Difference (NREL vs. Measured) for Triple-Junction Amorphous Silicon
Triple-Junction Amorphous Silicon 30 Average = -0.8% Standard Deviation = 4.6% 20
10
0
-10
-20
-30 1-Dec-97
30-Jan-98
31-Mar-98
30-May-98
29-Jul-98
27-Sep-98
26-Nov-98
25-Jan-99
Date Figure 4.6 Daily Energy Difference (SNL vs. Measured) for Triple-Junction Amorphous Silicon
11
CdS/CdTe Thin-Film 30
Average = 2.2% Standard Deviation = 4.0%
20
10
0
-10
-20
-30 12/1/97
1/30/98
3/31/98
5/30/98
7/29/98
9/27/98
11/26/98
1/25/99
Date Figure 4.7 Daily Energy Difference (NREL vs. Measured) for CdS/CdTe
CdS/CdTe Thin-film 30 Average = +2.3 % Standard Deviation = 3.1 20
10
0
-10
-20
-30 1-Dec-97
30-Jan-98
31-Mar-98
30-May-98
29-Jul-98
27-Sep-98
26-Nov-98
Date Figure 4.8 Daily Energy Difference (SNL vs. Measured) for CdS/CdTe
12
25-Jan-99
Thin-Film CIGSS 30
Average = -0.6% Standard Deviation = 3.1%
20
10
0
-10
-20
-30 12/1/97
1/30/98
3/31/98
5/30/98
7/29/98
9/27/98
11/26/98
1/25/99
Date Figure 4.9 Daily Energy Difference (NREL vs. Measured) for CIGSS
Thin-film CIGSS 30 Average = +1.3% Standard Deviation = 3.9% 20
10
0
-10
-20
-30 1-Dec-97
30-Jan-98
31-Mar-98
30-May-98
29-Jul-98
27-Sep-98
26-Nov-98
Date Figure 4.10 Daily Energy Difference (SNL vs. Measured) for CIGSS
13
25-Jan-99
4.2 Daily Energy Difference vs. Incident Solar Radiation
Multi-crystalline Silicon 30
Average = -0.3% Standard Deviation = 2.9%
20
10
0
-10
-20
-30 0
1000
2000
3000
4000
5000
6000
7000
8000
9000
10000
2
Incident Solar Radiation (Wh/m /day) Figure 4.11 Daily Energy Difference (NREL vs. Measured) for Multi-Crystalline Silicon
Multi-crystalline Silicon 30 Average = +1.7% Standard Deviation = 2.9%
20
10
0
-10
-20
-30 0
1000
2000
3000
4000
5000
6000
7000
8000
9000
2
Incident Solar Radiation (Wh/m /day) Figure 4.12 Daily Energy Difference (SNL vs. Measured) for Multi-Crystalline Silicon
14
10000
Dual-Junction Amorphous Silicon 30
Average = -1.1% Standard Deviation = 4.8%
20
10
0
-10
-20
-30 0
1000
2000
3000
4000
5000
6000
7000
8000
9000
10000
2
Incident Solar Radiation (Wh/m /day) Figure 4.13 Daily Energy Difference (NREL vs. Measured) for Dual-Junction Amorphous Silicon
Dual-Junction Amorphous Silicon 30 Average = +0.4% Standard Deviation = 4.4%
20
10
0
-10
-20
-30 0
1000
2000
3000
4000
5000
6000
7000
8000
9000
10000
2
Incident Solar Radiation (Wh/m /day) Figure 4.14 Daily Energy Difference (SNL vs. Measured) for Dual-Junction Amorphous Silicon
15
Triple-Junction Amorphous Silicon 30
Average = -6.0% Standard Deviation = 3.9%
20
10
0
-10
-20
-30 0
1000
2000
3000
4000
5000
6000
7000
8000
9000
10000
2
Incident Solar Radiation (Wh/m /day) Figure 4.15 Daily Energy Difference (NREL vs. Measured) for Triple-Junction Amorphous Silicon
Triple-Junction Amorphous Silicon 30 Average = -0.8% Standard Deviation = 4.6%
20
10
0
-10
-20
-30 0
1000
2000
3000
4000
5000
6000
7000
8000
9000
10000
2
Incident Solar Radiation (Wh/m /day) Figure 4.16 Daily Energy Difference (SNL vs. Measured) for Triple-Junction Amorphous Silicon
16
CdS/CdTe Thin-Film 30
Average = 2.2% Standard Deviation = 4.0%
20
10
0
-10
-20
-30 0
1000
2000
3000
4000
5000
6000
7000
8000
9000
10000
2
Incident Solar Radiation (Wh/m /day) Figure 4.17 Daily Energy Difference (NREL vs. Measured) for CdS/CdTe
CdS/CdTe Thin-film 30 Average = +2.3 % Standard Deviation = 3.1
20
10
0
-10
-20
-30 0
1000
2000
3000
4000
5000
6000
7000
8000
9000
2
Incident Solar Radiation (Wh/m /day) Figure 4.18 Daily Energy Difference (SNL vs. Measured) for CdS/CdTe
17
10000
Thin-Film CIGSS 30
Average = -0.6% Standard Deviation = 3.1%
20
10
0
-10
-20
-30 0
1000
2000
3000
4000
5000
6000
7000
8000
9000
10000
2
Incident Solar Radiation (Wh/m /day) Figure 4.19 Daily Energy Difference (NREL vs. Measured) for CIGSS
Thin-film CIGSS 30 Average = +1.3% Standard Deviation = 3.9%
20
10
0
-10
-20
-30 0
1000
2000
3000
4000
5000
6000
7000
8000
2
Incident Solar Radiation (Wh/m /day) Figure 4.20 Daily Energy Difference (SNL vs. Measured) for CIGSS
18
9000
10000
4.3 Hourly Energy Differences vs. Date
Similar to the previous section’s evaluation for daily energy, differences for hourly energy as a function of the day of the year are shown in Figures 4.21 through Figures 4.30; as a function of the incident hourly solar radiation in Figures 4.31 through 4.40; and as a function of PV module temperature in Figures 4.41 through 4.50. Because of the shorter averaging period, percentage differences are larger for hourly energy than for daily energy. For graphs depicting results for the NREL method, increased scatter is also evident as a consequence of increased uncertainty associated with modeling the PV module temperature and solar irradiance. Otherwise, results are consistent and similar to those for differences for daily energy. Sandia used a typical screening procedure to eliminate values (outliers) that were outside ±3σ (three times the standard deviation of the entire data set).
19
Multi-crystalline Silicon 100 75 50 25 0 -25 -50 -75 -100 1-Dec-97
30-Jan-98
31-Mar-98
30-May-98
29-Jul-98
27-Sep-98
26-Nov-98
25-Jan-99
Date Figure 4.21 Hourly Energy Difference (NREL vs. Measured) for Multi-Crystalline Silicon
Multi-crystalline Silicon 100 75 50 25 0 -25 -50 -75 -100 1-Dec-97
30-Jan-98
31-Mar-98
30-May-98
29-Jul-98
27-Sep-98
26-Nov-98
25-Jan-99
Date Figure 4.22 Hourly Energy Difference (SNL vs. Measured) for Multi-Crystalline Silicon
20
Dual-Junction Amorphous Silicon 100 75 50 25 0 -25 -50 -75 -100 1-Dec-97
30-Jan-98 31-Mar-98 30-May-98
29-Jul-98
27-Sep-98 26-Nov-98 25-Jan-99
Date Figure 4.23 Hourly Energy Difference (NREL vs. Measured) for Dual Junction Amorphous Silicon
Dual-Junction Amorphous Silicon 100 75 50 25 0 -25 -50 -75 -100 1-Dec-97
30-Jan-98
31-Mar-98
30-May-98
29-Jul-98
27-Sep-98
26-Nov-98
25-Jan-99
Date Figure 4.24 Hourly Energy Difference (SNL vs. Measured) for Dual Junction Amorphous Silicon
21
Triple-Junction Amorphous Silicon 100 75 50 25 0 -25 -50 -75 -100 1-Dec-97
30-Jan-98 31-Mar-98 30-May-98
29-Jul-98
27-Sep-98 26-Nov-98 25-Jan-99
Date Figure 4.25 Hourly Energy Difference (NREL vs. Measured) for Triple Junction Amorphous Silicon
Triple-Junction Amorphous Silicon 100 75 50 25 0 -25 -50 -75 -100 1-Dec-97
30-Jan-98
31-Mar-98
30-May-98
29-Jul-98
27-Sep-98
26-Nov-98
25-Jan-99
Date Figure 4.26 Hourly Energy Difference (SNL vs. Measured) for Triple Junction Amorphous Silicon
22
CdS/CdTe Thin-film 100 75 50 25 0 -25 -50 -75 -100 1-Dec-97
30-Jan-98 31-Mar-98 30-May-98
29-Jul-98
27-Sep-98 26-Nov-98 25-Jan-99
Date Figure 4.27 Hourly Energy Difference (NREL vs. Measured) for CdTe
CdS/CdTe Thin-film 100 75 50 25 0 -25 -50 -75 -100 1-Dec-97
30-Jan-98
31-Mar-98
30-May-98
29-Jul-98
27-Sep-98
26-Nov-98
Date Figure 4.28 Hourly Energy Difference (SNL vs. Measured) for CdTe
23
25-Jan-99
Thin-film CIGSS 100 80 60 40 20 0 -20 -40 -60 -80 -100 1-Dec-97
30-Jan-98 31-Mar-98 30-May-98
29-Jul-98
27-Sep-98 26-Nov-98 25-Jan-99
Date Figure 4.29 Hourly Energy Difference (NREL vs. Measured) for CIGSS
Thin-film CIGSS 100 75 50 25 0 -25 -50 -75 -100 1-Dec-97
30-Jan-98
31-Mar-98
30-May-98
29-Jul-98
27-Sep-98
26-Nov-98
Date Figure 4.30 Hourly Energy Difference (SNL vs. Measured) for CIGSS
24
25-Jan-99
4.4 Hourly Energy Difference vs. Incident Solar Radiation
Multi-crystalline Silicon 100 75 50 25 0 -25 -50 -75 -100 0
200
400
600
800
1000
1200
2
POA Solar Irradiance (W/m ) Figure 4.31 Hourly Energy Difference (NREL vs. Measured) for Multi-Crystalline Silicon
Multi-crystalline Silicon
100 75 50 25 0 -25 -50 -75 -100 0
200
400
600
800
1000
2
POA Solar Irradiance (W/m ) Figure 4.32 Hourly Energy Difference (SNL vs. Measured) for Multi-Crystalline Silicon
25
1200
Dual-Junction Amorphous Silicon 100 75 50 25 0 -25 -50 -75 -100 0
200
400
600
800
1000
1200
2
POA Solar Irradiance (W/m ) Figure 4.33 Hourly Energy Difference (NREL vs. Measured) for Dual Junction Amorphous Silicon
Dual-Junction Amorphous Silicon
100 75 50 25 0 -25 -50 -75 -100 0
200
400
600
800
1000
1200
2
POA Solar Irradiance (W/m ) Figure 4.34 Hourly Energy Difference (SNL vs. Measured) for Dual Junction Amorphous Silicon
26
Triple-Junction Amorphous Silicon 100 75 50 25 0 -25 -50 -75 -100 0
200
400
600
800
1000
1200
2
POA Solar Irradiance (W/m ) Figure 4.35 Hourly Energy Difference (NREL vs. Measured) for Triple Junction Amorphous Silicon
Triple-Junction Amorphous Silicon
100 75 50 25 0 -25 -50 -75 -100 0
200
400
600
800
1000
1200
2
POA Solar Irradiance (W/m ) Figure 4.36 Hourly Energy Difference (NREL vs. Measured) for Triple Junction Amorphous Silicon
27
CdS/CdTe Thin-film 100 75 50 25 0 -25 -50 -75 -100 0
200
400
600
800
1000
1200
2
POA Solar Irradiance (W/m ) Figure 4.37 Hourly Energy Difference (NREL vs. Measured) for CdTe
CdS/CdTe Thin-film
100 75 50 25 0 -25 -50 -75 -100 0
200
400
600
800
1000
2
POA Solar Irradiance (W/m ) Figure 4.38 Hourly Energy Difference (SNL vs. Measured) for CdTe
28
1200
Thin-film CIGSS 100 80 60 40 20 0 -20 -40 -60 -80 -100 0
200
400
600
800
1000
1200
2
POA Irradiance (W/m ) Figure 4.39 Hourly Energy Difference (NREL vs. Measured) for CIGSS
Thin-film CIGSS
100 75 50 25 0 -25 -50 -75 -100 0
200
400
600
800
1000
2
POA Solar Irradiance (W/m ) Figure 4.40 Hourly Energy Difference (SNL vs. Measured) for CIGSS
29
1200
4.5 Hourly Energy Differences vs. Module Temperature
Multi-crystalline Silicon 100 75 50 25 0 -25 -50 -75 -100 -20
0
20
40
60
80
Module Temperature (C) Figure 4.41 Hourly Energy Difference (NREL vs. Measured) for Multi-Crystalline Silicon
Multi-crystalline Silicon
100 75 50 25 0 -25 -50 -75 -100 -20
0
20
40
60
80
Module Temperature (C) Figure 4.42 Hourly Energy Difference (SNL vs. Measured) for Multi-Crystalline Silicon
30
Dual-Junction Amorphous Silicon 100 75 50 25 0 -25 -50 -75 -100 -20
0
20
40
60
80
Module Temperature (C) Figure 4.43 Hourly Energy Difference (NREL vs. Measured) for Dual Junction Amorphous Silicon
Dual-Junction Amorphous Silicon
100 75 50 25 0 -25 -50 -75 -100 -20
0
20
40
60
80
Module Temperature (C) Figure 4.44 Hourly Energy Difference (SNL vs. Measured) for Dual Junction Amorphous Silicon
31
Triple-Junction Amorphous Silicon 100 75 50 25 0 -25 -50 -75 -100 -20
0
20
40
60
80
Module Temperature (C) Figure 4.45 Hourly Energy Difference (NREL vs. Measured) for Triple Junction Amorphous Silicon
Triple-Junction Amorphous Silicon
100 75 50 25 0 -25 -50 -75 -100 -20
0
20
40
60
80
Module Temperature (C) Figure 4.46 Hourly Energy Difference (SNL vs. Measured) for Triple Junction Amorphous Silicon
32
CdS/CdTe Thin-film 100 75 50 25 0 -25 -50 -75 -100 -20
0
20
40
60
80
Module Temperature (C) Figure 4.47 Hourly Energy Difference (NREL vs. Measured) for CdTe
CdS/CdTe Thin-film
100 75 50 25 0 -25 -50 -75 -100 -20
0
20
40
60
Module Temperature (C) Figure 4.48 Hourly Energy Difference (SNL vs. Measured) for CdTe
33
80
Thin-film CIGSS 100 80 60 40 20 0 -20 -40 -60 -80 -100 -20
0
20
40
60
80
Module Temperature (C) Figure 4.49 Hourly Energy Difference (NREL vs. Measured) for CIGSS
Thin-film CIGSS
100 75 50 25 0 -25 -50 -75 -100 -20
0
20
40
60
Module Temperature (C) Figure 4.50 Hourly Energy Difference (SNL vs. Measured) for CIGSS
34
80
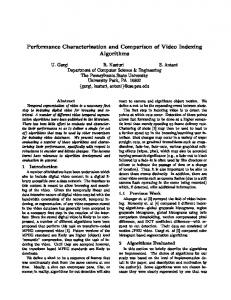
4.6 Using Specific Daily Data to Match Module Energy Rating Days
In the current version of the IEEE module energy ratings standard (P1479) [10], five reference day types are proposed. The weather data were defined as extreme conditions that will allow differences in module design and performance to be discernable. The final locations were chosen based on criteria developed by the Technical Review committee for describing the following day types: Hot Sunny, Hot Cloudy, Cold Sunny, Cold Cloudy, and Nice (Cool Sunny). It was decided that users might find actual data from specific dates and locations somewhat more descriptive and useful. The days that were chosen from the data base are described below. Hot Sunny: Phoenix, AZ, June 24, 1976. This day exemplifies the summer in the desert southwest: hot, dry, and clear. Cold Sunny: Alamosa, CO, February 8, 1961. With the extremely high direct normal irradiance (DNI) and low temperature, this day should produce peak power values. However, because it is in the winter, the short length of day will limit module energy. Hot Cloudy: Brownsville, TX, July 4, 1983. The medium irradiance levels and high temperatures of these conditions will emphasize low sensitivity to temperature. Cold Cloudy: Buffalo, NY, December 6, 1985. Cold and cloudy conditions are particularly severe for photovoltaic energy generation because of the generally lower irradiance levels. These conditions will allow performance comparisons for wintertime carry-through capability. Nice: Sacramento, CA, May 4, 1967. This is intended to be an average day, not too hot and not too cold. It also has considerable sun and is therefore an ideal day for photovoltaic energy production.
The environmental conditions include: location, time, date, global horizontal irradiance, direct normal irradiance, diffuse irradiance, plane-of-array irradiance, ambient temperature, wind speed, relative humidity, and a spectral distribution. To further evaluate model performances over a wide range of climatic conditions, modeled and measured values were compared for individual days selected that were similar to the MER reference days. The days selected, and the MER day they represent, are 1/23/98 (cold-sunny), 11/25/98 (cold-cloudy), 4/24/98 (nice), 8/25/98 (hot-cloudy), and 9/4/98 (hot-sunny). Results for this comparison are shown in Figures 4.51 through 4.75. Overall, the NREL and Sandia models show the ability to closely match the measured data values and variability.
35
Multi-crystalline Silicon - Cold Sunny Day (1/23/98)
60
50
Daily Difference (NREL) = 1.0% Daily Difference (SNL) = 5.3%
Measured NREL Sandia
40
30
20
10
0 4
6
8
10
12
14
16
18
20
Time (h) Figure 4.51 Measured Power vs. Modeled Power (Cold Sunny Day – Multi crystalline Silicon)
Multi-crystalline Silicon - Cold Cloudy Day (11/25/98)
60
Daily Difference (NREL) = -3.0% Daily Difference (SNL) = 6.2%
Measured
50
NREL Sandia
40
30
20
10
0 4
6
8
10
12
14
16
18
20
Time (h) Figure 4.52 Measured Power vs. Modeled Power (Cold Cloudy Day – Multi crystalline Silicon)
36
Multi-crystalline Silicon - Nice Day (4/24/98)
60
Daily Difference (NREL) = 1.0% Daily Difference (SNL) = 2.5%
Measured
50
NREL Sandia
40
30
20
10
0 4
6
8
10
12
14
16
18
20
Time (h)
Figure 4.53 Measured Power vs. Modeled Power (Nice Day – Multi crystalline Silicon)
Multi-crystalline Silicon - Hot Cloudy Day (8/25/98) 60 Daily Difference (NREL) = -4.5% Daily Difference (SNL) = -2.8%
Measured
50
NREL Sandia
40
30
20
10
0 4
6
8
10
12
14
16
18
Time (h) Figure 4.54 Measured Power vs. Modeled Power (Hot Cloudy Day – Multi crystalline Silicon)
37
20
Multi-crystalline Silicon - Hot Sunny Day (9/4/98)
60
Daily Difference (NREL) = 0.5% Daily Difference (SNL) = -0.7%
Measured
50
NREL Sandia
40
30
20
10
0 4
6
8
10
12
14
16
18
20
Time (h) Figure 4.55 Measured Power vs. Modeled Power (Hot Sunny Day – Multi crystalline Silicon)
Dual-Junction Amorphous Silicon - Cold Sunny Day (1/23/98)
25
Daily Difference (NREL) = 1.3% Daily Difference (SNL) = 4.7%
Measured NREL
20
Sandia
15
10
5
0 4
6
8
10
12
14
16
18
20
Time (h) Figure 4.56 Measured Power vs. Modeled Power (Cold Sunny Day – Dual-Junction Amorphous Silicon)
38
Dual-Junction Amorphous Silicon - Cold Cloudy Day (11/25/98) 25 Daily Difference (NREL) = 3.9% Daily Difference (SNL) = 1.1%
Measured NREL
20
Sandia
15
10
5
0 4
6
8
10
12
14
16
18
20
Time (h) Figure 4.57 Measured Power vs. Modeled Power (Cold Cloudy Day – Dual-Junction Amorphous Silicon)
Dual-Junction Amorphous Silicon - Nice Day (4/24/98)
25
Daily Difference (NREL) = 2.1% Daily Difference (SNL) = 5.0%
Measured NREL
20
Sandia
15
10
5
0 4
6
8
10
12
14
16
18
20
Time (h) Figure 4.58 Measured Power vs. Modeled Power (Nice Day – Dual-Junction Amorphous Silicon)
39
Dual-Junction Amorphous Silicon - Hot Cloudy Day (8/25/98)
25
Daily Difference (NREL) = -7.3% Daily Difference (SNL) = -6.7%
Measured NREL
20
Sandia
15
10
5
0 4
6
8
10
12
14
16
18
20
Time (h) Figure 4.59 Measured Power vs. Modeled Power (Hot Cloudy Day – Dual-Junction Amorphous Silicon)
Dual-Junction Amorphous Silicon - Hot Sunny Day (9/4/98)
25
Daily Difference (NREL) = 0.1% Daily Difference (SNL) = -0.8%
Measured NREL
20
Sandia
15
10
5
0 4
6
8
10
12
14
16
18
20
Time (h)
Figure 4.60 Measured Power vs. Modeled Power (Hot Sunny Day – Dual-Junction Amorphous Silicon)
40
Triple-Junction Amorphous Silicon - Cold Sunny Day (1/23/98) 40 Daily Difference (NREL) = 1.4% Daily Difference (SNL) = 4.9%
Measured
35
NREL Sandia
30 25 20 15 10 5 0 4
6
8
10
12
14
16
18
20
Time (h) Figure 4.61 Measured Power vs. Modeled Power (Cold Sunny Day – Triple-Junction Amorphous Silicon)
Triple-Junction Amorphous Silicon - Cold Cloudy Day (11/25/98) 40
Daily Difference (NREL) = -8.3% Daily Difference (SNL) = -9.6%
Measured
35
NREL Sandia
30 25 20 15 10 5 0 4
6
8
10
12
14
16
18
20
Time (h) Figure 4.62 Measured Power vs. Modeled Power (Cold Cloudy Day – Triple-Junction Amorphous Silicon)
41
Triple-Junction Amorphous Silicon - Nice Day (4/24/98)
40
Daily Difference (NREL) = -2.9% Daily Difference (SNL) = 4.7%
Measured
35
NREL Sandia
30 25 20 15 10 5 0 4
6
8
10
12
14
16
18
20
Time (h) Figure 4.63 Measured Power vs. Modeled Power (Nice Day – Triple-Junction Amorphous Silicon)
Triple-Junction Amorphous Silicon - Hot Cloudy Day (8/25/98)
40
Daily Difference (NREL) = -11.9% Daily Difference (SNL) = -8.6%
Measured
35
NREL Sandia
30 25 20 15 10 5 0 4
6
8
10
12
14
16
18
20
Time (h) Figure 4.64 Measured Power vs. Modeled Power (Hot Cloudy Day – Triple-Junction Amorphous Silicon)
42
Triple-Junction Amorphous Silicon - Hot Sunny Day (9/4/98) 40 Daily Difference (NREL) = -7.3% Daily Difference (SNL) = -2.3%
Measured
35
NREL Sandia
30 25 20 15 10 5 0 4
6
8
10
12
14
16
18
20
Time (h) Figure 4.65 Measured Power vs. Modeled Power (Hot Sunny Day – Triple-Junction Amorphous Silicon)
CdTe - Cold Sunny Day (1/23/98)
60
Daily Difference (NREL) = -0.3% Daily Difference (SNL) = 3.0%
Measured NREL
50
Sandia
40
30
20
10
0 4
6
8
10
12
14
16
18
Time (h) Figure 4.66 Measured Power vs. Modeled Power (Cold Sunny Day – Cadmium Telluride)
43
20
CdTe - Cold Cloudy Day (11/25/98)
60
Daily Difference (NREL) = 2.6% Daily Difference (SNL) = 5.9%
Measured NREL
50
Sandia
40
30
20
10
0 4
6
8
10
12
14
16
18
20
Time (h) Figure 4.67 Measured Power vs. Modeled Power (Cold Cloudy Day – Cadmium Telluride)
CdTe - Nice Day (4/24/98)
60
Daily Difference (NREL) = 2.1% Daily Difference (SNL) = 1.3%
Measured NREL
50
Sandia
40
30
20
10
0 4
6
8
10
12
14
16
18
Time (h) Figure 4.68 Measured Power vs. Modeled Power (Nice Day – Cadmium Telluride)
44
20
CdTe - Hot Cloudy Day (8/25/98)
60
Daily Difference (NREL) = 2.3% Daily Difference (SNL) = -0.1%
Measured NREL
50
Sandia
40
30
20
10
0 4
6
8
10
12
14
16
18
20
Time (h) Figure 4.69 Measured Power vs. Modeled Power (Hot Cloudy Day – Cadmium Telluride)
CdTe - Hot Sunny Day (9/4/98)
60
Daily Difference (NREL) = 3.1% Daily Difference (SNL) = -0.2%
Measured NREL
50
Sandia
40
30
20
10
0 4
6
8
10
12
14
16
18
Time (h) Figure 4.70 Measured Power vs. Modeled Power (Hot Sunny Day – Cadmium Telluride)
45
20
CIGSS - Cold Sunny Day (1/23/98)
45
Daily Difference (NREL) = -1.3% Daily Difference (SNL) = -1.0%
Measured
40
NREL Sandia
35 30 25 20 15 10 5 0 4
6
8
10
12
14
16
18
20
Time (h) Figure 4.71 Measured Power vs. Modeled Power (Cold Sunny Day – Copper Indium Diselenide)
CIGSS - Cold Cloudy Day (11/25/98)
45
Daily Difference (NREL) = -0.3% Daily Difference (SNL) = 5.1%
Measured
40
NREL Sandia
35 30 25 20 15 10 5 0 4
6
8
10
12
14
16
18
20
Time (h) Figure 4.72 Measured Power vs. Modeled Power (Cold Cloudy Day – Copper Indium Diselenide)
46
CIGSS - Nice Day (4/24/98)
45
Daily Difference (NREL) = -0.1% Daily Difference (SNL) = 0.7%
Measured
40
NREL
35
Sandia
30 25 20 15 10 5 0 4
6
8
10
12
14
16
18
20
Time (h) Figure 4.73 Measured Power vs. Modeled Power (Nice Day – Copper Indium Diselenide)
CIGSS - Hot Cloudy Day (8/25/98)
45
Daily Difference (NREL) = -3.8% Daily Difference (SNL) = -1.1%
Measured
40
NREL
35
Sandia
30 25 20 15 10 5 0 4
6
8
10
12
14
16
18
20
Time (h) Figure 4.74 Measured Power vs. Modeled Power (Hot Cloudy Day – Copper Indium Diselenide)
47
CIGSS - Hot Sunny Day (9/4/98)
45
Daily Difference (NREL) = 0.5% Daily Difference (SNL) = 0.2%
Measured
40
NREL
35
Sandia
30 25 20 15 10 5 0 4
6
8
10
12
14
16
18
20
Time (h) Figure 4.75 Measured Power vs. Modeled Power (Hot Sunny Day – Copper Indium Diselenide)
48
4.7 Annual Energy and Average Energy Per Day
The performance models compared in this report also provide a means for calculating the expected annual energy production by a photovoltaic module. In addition to a single value for annual energy, the models can be used to provide an expected value for the average daily energy production by month in a manner consistent with the way that site-dependent solar resource data is often tabulated. Figures 4.76 through 4.80 illustrate the calculated values for average daily energy production compared to the measured values for the five different module technologies evaluated. Interestingly, the annual-average daily energy production (Wh/day) for all modules was about 4.8 times their peak power at standard reporting conditions.
Multi-Crystal Silicon 350
300
250
200
150
Sandia Model 100
Annual Average (SNL) = 253.2 (Wh) Annual Average (NREL) = 249.4 (Wh) Annual Avg. Measured = 249.6 (Wh)
NREL Model Measured
50
0 0
2
4
6
8
10
Month
Figure 4.76 Average Daily Energy per Month, Measured vs. Modeled for Multi-Crystalline Silicon Module.
49
12
Dual Junction Amorphous Silicon Module 160 140 120 100 80 60 40
Annual Average (SNL) = 107.5 (Wh) Annual Average (NREL) = 106.0 (Wh) Annual Avg. Measured = 107.0 (Wh)
Sandia Model Measured NREL Model
20 0 0
2
4
6
8
10
12
Month
Figure 4.77 Average Daily Energy per Month, Measured vs. Modeled for Dual-Junction a-Si Module.
Triple Junction Amorphous Silicon Module 250
200
150
100
Annual Average (SNL) = 162.0 (Wh) Annual Average (NREL) = 170.9 (Wh) Annual Avg. Measured = 161.3 (Wh)
Sandia Model Measured
50
NREL Model 0 0
2
4
6
8
10
12
Month
Figure 4.78 Average Daily Energy per Month, Measured vs. Modeled for Triple-Junction a-Si Module.
50
CdS/CdTe Module 350 300 250 200 150 100 Sandia Model
50
Annual Average (SNL) = 260.5 (Wh) Annual Average (NREL) = 259.7 (Wh) Annual Avg. Measured = 255.1 (Wh)
Measured NREL Model
0 0
2
4
6
8
10
12
Month Figure 4.79 Average Daily Energy per Month, Measured vs. Modeled for CdTe Module.
Thin-film CIGS Module 300
250
200
150
Sandia Model Measured
100
NREL Model
Annual Average (SNL) = 190.7 (Wh) Annual Average (NREL) = 188.4 (Wh) Annual Avg. Measured = 190.0 (Wh)
50
0 0
2
4
6
8
10
Month Figure 4.80 Average Daily Energy per Month, Measured vs. Modeled for Thin-Film CIGS Module
51
12
5.0 Conclusions A summary paper of this work was presented at the 28th IEEE PV Specialist Conference [11]. Overall, the NREL and Sandia models show the ability to closely match the measured data values for hourly, daily, and annual conditions and variability produced by environmental factors. More analysis will be required to better understand all of the results and implications evident in our collaborative investigation. Finding the most practical and beneficial ways to implement the test procedures and performance models investigated will also be an ongoing effort. The NREL and Sandia models now provide defensible methods for calculating energy production from PV modules using either measured environmental parameters or tabulated typical meteorological year (TMY) data. Tables 2 and 3 summarize the differences in daily, hourly, and annual energy production between measured and modeled data using the NREL and Sandia methods. Table 2. NREL Method. Differences in daily, hourly, and annual energy production, modeled vs. measured. NREL - % Difference between Modeled and Measured Module a-Si/a-Si/a-Si:Ge CIGSS mc-Si a-Si/a-Si:Ge CdTe
Hourly Avg. (%) -9.6 0.7 0.5 8 16.3
Daily Avg. (%) -6.0 -0.6 -0.3 -1.1 2.2
Annual Avg. (%) -5.9 -0.7 -0.1 -1.0 2.0
Table 3. Sandia Method. Differences in daily, hourly, and annual energy production, modeled vs. measured. Sandia - % Difference between Modeled and Measured Module a-Si/a-Si/a-Si:Ge CIGSS mc-Si a-Si/a-Si:Ge CdTe
Hourly Avg. (%) -6.8 5.5 3.1 -0.6 5.9
52
Daily Avg. (%) -0.8 1.3 1.7 0.4 2.3
Annual Avg. (%) -0.03 0.4 1.4 0.1 2.1
Table 4 lists the modeled energy production for the five modules and Table 5 summarizes the percent differences between modeled and measured daily energy for both performance models and for all five days selected. Table 4. Values for Module Energy Production (Wh) based on five selected days CdTe CIGSS Triple mc-Si Dual Junction Junction Amorphous Amorphous Silicon Silicon 350.4 130.5 204.4 337.3 267.6 NREL Cold - Sunny 365.1 136.2 211.5 348.4 268.7 SNL 346.8 129.5 201.6 338.3 271.3 Measured 66.5 22.9 41.0 68.2 56.8 NREL Cold - Cloudy 72.8 22.3 40.5 70.3 59.9 SNL 68.5 22.1 44.8 66.4 57.0 Measured 351.5 156.1 226.0 334.5 269.3 NREL Nice 356.6 160.5 243.7 332.0 271.3 SNL 348.0 152.9 232.6 327.8 269.3 Measured 146.6 60.4 87.1 161.6 106.1 NREL Hot - Cloudy 149.4 60.8 94.3 157.8 109.2 SNL 153.6 65.2 101.8 157.9 110.4 Measured 329.7 156.6 221.7 380.5 256.7 NREL Hot - Sunny 325.8 155.1 233.8 368.2 255.9 SNL 328.0 156.4 239.0 368.9 255.5 Measured
Cold Sunny
Table 5. Differences (%) between calculated and measured daily energy for both models on five selected days. CdTe CIGSS Triple mc-Si Dual Junction Junction Amorphous Amorphous Silicon Silicon 1.0 1.3 1.4 -0.3 NREL 5.3 4.7 4.9 3.0 SNL
-1.3 -1.0
Cold Cloudy
NREL SNL
-3.0 6.2
3.9 1.1
-8.3 -9.6
2.6 5.9
-0.3 5.1
Nice
NREL SNL
1.0 2.5
2.1 5.0
-2.9 4.7
2.1 1.3
-0.1 0.7
Hot Cloudy
NREL SNL
-4.5 -2.8
-7.3 -6.7
-11.9 -8.6
2.3 -0.1
-3.8 -1.1
Hot Sunny
NREL SNL
0.5 -0.7
0.1 -0.8
-7.3 -2.3
3.1 -0.2
0.5 0.2
53
6.0 Acknowledgements The authors would like to thank Keith Emery, Steve Rummel, Allan Anderberg, and Joe del Cueto for providing data measurements. The contributions of all participants in the MER Technical Review Committee are gratefully acknowledged. This work was supported under DOE contracts DE-AC3699GO10337 (NREL) and DE-AC04-94AL85000 (Sandia).
7.0 References [1] Kroposki, B., D. Myers, K. Emery, L. Mrig, C. Whitaker and J. Newmiller, “Photovoltaic Module Energy Ratings Methodology Development,” 25th IEEE PVSC, Washington, DC, 1996. [2] Marion, B., B. Kroposki, K. Emery, J del Cueto. D. Myers, and C. Osterwald, “Validation of a Photovoltaic Module Energy Ratings Procedure at NREL,” NREL/TP-520-26909, 1999. [3] King, D. L and Eckert, P. E., “Characterizing (Rating) Performance of Large Photovoltaic Arrays for All Operating Conditions,” 25th IEEE PVSC, 1996. [4] King, D. L., J. Kratochvil, W. Boyson, and W. Bower, “Field Experience with a New Performance Characterization Procedure for Photovoltaic Arrays,” 2nd WCSEC, 1998. [5] ASTM E 1036-96, Standard Test Methods for Electrical Performance of Nonconcentrator Terrestrial Photovoltaic Modules and Arrays Using Reference Cells, West Conshohocken, PA: American Society for Testing and Materials. [6] ASTM E 892-92, Standard Tables for Terrestrial Solar Spectral Irradiance at Air Mass 1.5 for a 37° Tilted Surface, West Conshohocken, PA: American Society for Testing and Materials. [7] ASTM E 1021-95, Standard Test Methods for Measuring the Spectral Response of Photovoltaic Cells, West Conshohocken, PA: American Society for Testing and Materials. [8] Nann, S.; Emery, K., “Spectral Effects on PV-Device Rating.” Solar Energy Materials and Solar Cells, 27, pp. 189-216, 1992. [9] Fuentes, M.K., A Simplified Thermal Model for Flat-Plate Photovoltaic Arrays, SAND85-0330, Albuquerque, NM: Sandia National Laboratories, 1985. [10] IEEE P1479 “Recommended Practice for the Evaluation of Photovoltaic Module Energy Production” Draft 4. [11] Kroposki, B, W. Marion, D. King, J. Kratochvil, W. Boyson, “Comparison of Module Performance Characterization Methods”, 28th IEEE PVSC, Anchorage, AK
54
Form Approved OMB NO. 0704-0188
REPORT DOCUMENTATION PAGE
Public reporting burden for this collection of information is estimated to average 1 hour per response, including the time for reviewing instructions, searching existing data sources, gathering and maintaining the data needed, and completing and reviewing the collection of information. Send comments regarding this burden estimate or any other aspect of this collection of information, including suggestions for reducing this burden, to Washington Headquarters Services, Directorate for Information Operations and Reports, 1215 Jefferson Davis Highway, Suite 1204, Arlington, VA 22202-4302, and to the Office of Management and Budget, Paperwork Reduction Project (0704-0188), Washington, DC 20503.
1. AGENCY USE ONLY (Leave blank)
2. REPORT DATE
November 2000
3. REPORT TYPE AND DATES COVERED
Technical Report
4. TITLE AND SUBTITLE
Comparison of Module Performance Characterization Methods for Energy Production 6. AUTHOR(S)
5. FUNDING NUMBERS
C: TA: PVP17101
B. Kroposki, W. Marion, D. King, W. Boyson, and J. Kratochvil 7. PERFORMING ORGANIZATION NAME(S) AND ADDRESS(ES)
8. PERFORMING ORGANIZATION REPORT NUMBER
9. SPONSORING/MONITORING AGENCY NAME(S) AND ADDRESS(ES)
10. SPONSORING/MONITORING AGENCY REPORT NUMBER
National Renewable Energy Laboratory 1617 Cole Blvd. Golden, CO 80401-3393
NREL/TP-520-29245
11. SUPPLEMENTARY NOTES 12a.
DISTRIBUTION/AVAILABILITY STATEMENT
12b.
DISTRIBUTION CODE
National Technical Information Service U.S. Department of Commerce 5285 Port Royal Road Springfield, VA 22161 This report compares the two methods of determining the performance of PV modules. The methods translate module performance characterized in a laboratory to actual or reference conditions using slightly different approaches. The accuracy of both methods is compared for both hourly and daily energy production over a year of data recorded at NREL in Golden, CO. The comparison of the two methods will be presented for five different PV module technologies: multicrystalline silicon (mc-Si), dual-junction amorphous silicon (a-Si/a-Si:Ge), triple-junction amorphous silicon (a-Si/a-Si/a-Si:Ge), cadmium telluride (CdTe), and copper indium diselenide (CIGSS).
13. ABSTRACT (Maximum 200 words)
14. SUBJECT TERMS
photovoltaics ; irradiance ; PV modules ; multicrystalline silicon ; dual-junction amorphous silicon ; triple-junction amorphous silicon ; cadmium telluride ; copper indium diselenide ; CIGS ; energy production ; module energy rating ; air temperature ; spectral response ; angleof-incidence ; two-axis solar tracker ; 17. SECURITY CLASSIFICATION OF REPORT
Unclassified NSN 7540-01-280-5500
18. SECURITY CLASSIFICATION OF THIS PAGE
Unclassified
19. SECURITY CLASSIFICATION OF ABSTRACT
Unclassified
15. NUMBER OF PAGES 16. PRICE CODE
20. LIMITATION OF ABSTRACT
UL Standard Form 298 (Rev. 2-89) Prescribed by ANSI Std. Z39-18 298-102