Neurobiology of Disease 98 (2017) 100–107
Contents lists available at ScienceDirect
Neurobiology of Disease journal homepage: www.elsevier.com/locate/ynbdi
Comparison of oscillatory activity in subthalamic nucleus in Parkinson's disease and dystonia☆ Xinyi Geng a,b,c,1, Jianguo Zhang d,1, Yin Jiang d, Keyoumars Ashkan e, Thomas Foltynie f, Patricia Limousin f, Ludvic Zrinzo f, Alexander Green g, Tipu Aziz g, Peter Brown b, Shouyan Wang a,⁎ a
Suzhou Institute of Biomedical Engineering and Technology, Chinese Academy of Sciences, 88 Keling Road, SND, Suzhou 215163, China MRC Brain Network Dynamics Unit, University of Oxford, Mansfield Road, Oxford OX13TH, UK University of Chinese Academy of Sciences, 19A Yuquan Road, Shijingshan District, Beijing 100049, China d Department of Neurosurgery, Beijing Tian-Tan Hospital, Beijing Neurosurgical Institute, Capital Medical University, 6 Tiantan West Road, Dongcheng District, Beijing 100050, China e Institute of Psychiatry, Psychology and Neuroscience, Kings College London, Strand, London WC2R 2LS, UK f Sobell Department of Motor Neuroscience & Movement Disorders, UCL Institute of Neurology, University College London, Gower Street, London WC1E 6BT, UK g Nuffield Department of Clinical Neurosciences, University of Oxford, West Wing, John Radcliffe Hospital, Oxford OX39DU, UK b c
a r t i c l e
i n f o
Article history: Received 15 July 2016 Revised 6 November 2016 Accepted 5 December 2016 Available online 7 December 2016 Keywords: Subthalamic nucleus Oscillation Dystonia Parkinson's disease
a b s t r a c t Objectives: Deep brain stimulation (DBS) of the subthalamic nucleus (STN) has been successfully used to treat both Parkinson's disease (PD) and dystonia. Local field potentials (LFPs) recorded from the STN of PD patients demonstrate prominent beta frequency band activity. It is unclear whether such activity occurs in the STN in dystonia, and, if not, whether dystonia has another distinctive neural population activity in the STN. Methods: Twelve patients with PD, and eight patients with dystonia underwent DBS electrode implantation targeting the STN. Seven dystonia patients were off medication and one was on aripiprazole and clonazepam. LFPs were recorded from the DBS electrodes in PD in the on/off medication states and in dystonia. Power spectra and temporal dynamics measured by the with Lempel-Ziv complexity of the LFPs were compared among these states. Results: Normalised power spectra and Lempel-Ziv complexity of subthalamic LFPs differed between dystonia off and PD on/off, and between PD off and on over the low frequency, beta and high gamma bands. Patients with dystonia and off medication had lower beta power but higher low frequency and high gamma power than PD. Spectral power in the low beta frequency (11–20 Hz) range was attenuated in medicated PD. Conclusion: The results suggest that dystonia and PD are characterized by different patterns of oscillatory activities even within the same nucleus, and exaggerated beta activity may relate to hypo-dopaminergic status. © 2016 Published by Elsevier Inc.
1. Introduction
Abbreviations: STN, subthalamic nucleus; PD, Parkinson's disease; LFPs, local field potentials; DBS, deep brain stimulation; GPi, globus pallidus internus; LZC, Lempel-Ziv complexity; BFMDRS, Burke-Fahn-Marsden Dystonia Rating Scale; CDQ-24, Craniocervical Dystonia Questionnaire; UPDRS, Unified Parkinson's disease rating scale. ☆ Acknowledgements: Thanks to Dr. Huiling Tan, Nuffield Department of Clinical Neurosciences, University of Oxford, UK and Dr. Yongzhi Huang, Suzhou Institute of Biomedical Engineering and Technology, Chinese Academy of Sciences, China in providing valuable comments on signal analysis. ⁎ Corresponding author at: 88 Keling Road, SND, Suzhou, Jiangsu 215163, China. E-mail addresses:
[email protected],
[email protected] (X. Geng),
[email protected] (J. Zhang),
[email protected] (Y. Jiang),
[email protected] (K. Ashkan),
[email protected] (T. Foltynie),
[email protected] (P. Limousin),
[email protected] (L. Zrinzo),
[email protected] (A. Green),
[email protected] (T. Aziz),
[email protected] (P. Brown),
[email protected] (S. Wang). 1 These authors contributed to the paper equally. Available online on ScienceDirect (www.sciencedirect.com).
http://dx.doi.org/10.1016/j.nbd.2016.12.006 0969-9961/© 2016 Published by Elsevier Inc.
Evidence is accruing that there is synchronised oscillatory activity in some of the basal ganglia nuclei that typically occurs in the beta frequency band in Parkinson's disease (PD) and in the theta frequency band in dystonia (López-Azcárate et al., 2010). It has been widely reported that the local field potentials (LFPs) from the subthalamic nucleus (STN) exhibit excessive beta activity in patients with PD (Brittain and Brown, 2014). Such activity is suppressed by treatment with levodopa and by deep brain stimulation (DBS) of the STN (Eusebio et al., 2011; Kühn et al., 2005; Whitmer et al., 2012). Moreover, therapy induced suppression of beta levels correlates with the degree of induced clinical improvement, particularly with changes in bradykinesia and rigidity (Kühn et al., 2005; Kühn et al., 2008a; Kühn et al., 2009; Özkurt et al., 2011; Ray et al., 2008; van Wijk et al., 2016; Weinberger et al., 2006; Zaidel et al., 2010).
X. Geng et al. / Neurobiology of Disease 98 (2017) 100–107
In contrast, in patients with dystonia, oscillatory activity over a low frequency band (4–10 Hz) has been frequently reported from the globus pallidus internus (GPi) (Foncke et al., 2007; Lee and Kiss, 2013; Moll et al., 2014; Silberstein et al., 2003; Weinberger et al., 2011). This low frequency activity in GPi is coherent with the EMG of dystonic muscles (Chen et al., 2006a; Liu et al., 2006; Sharott et al., 2008). Moreover, it is suppressed during effective DBS of the same nucleus (Barow et al., 2014). Dystonia patients do not generally show elevated beta activity in the GPi (Silberstein et al., 2003; Weinberger et al., 2011), unless treated with the monoamine vesicle depletor tetrabenazine (Kühn et al., 2008b) or in some patients with secondary dystonia (Whitmer et al., 2013). However, as most of the data in patients with PD and dystonia come from recordings in different sites doubt remains as to whether spectral changes are site, phenotype or disease specific. GPi can be a DBS target for both dystonia and PD, and case series contrasting recordings from the GPi in these two diseases are concordant and support the existence of discrete spectral patterns along the lines of those described above (Silberstein et al., 2003; Weinberger et al., 2011). More recently, STN, a classical DBS target in PD, has been used as a stimulating target to treat dystonia (Chou et al., 2005; Kleiner-Fisman et al., 2007; Ostrem et al., 2011, 2014). However, where the subthalamic nucleus is concerned there is only one case series contrasting the LFP patterns in patients with dystonia and PD, and this suggested no difference in the spectral pattern of local field potentials between the two diseases (Wang et al., 2016). This would imply that any disease difference present at the level of the globus pallidus is local and not a feature of the wider interconnected circuits of the basal ganglia. Yet a microelectrode study and a case report describing findings in the STN point to a difference between these in dystonia and PD also within this nucleus (Schrock et al., 2009; Neumann et al., 2012). Given these contrasting results at the level of STN we felt it important to further investigate the spectral patterns of the STN LFP in dystonia and PD. (Neumann et al., 2012). We hypothesised that low frequency and beta band activities will differentially characterize the two disorders, even when recordings are made from the same site. In addition, we tested whether high gamma activity in the STN, previously postulated to be prokinetic, might be elevated in dystonia (Brown, 2003).
101
2. Material and methods 2.1. Subjects and surgery All patients gave written informed consent to take part in this study, which was agreed by the local ethics committees. Eight patients with dystonia which had treatment failures with botulinum toxin (Table 1), underwent DBS electrode implantation in Tian-Tan Hospital, Capital Medical University, Beijing, China. Seven patients with dystonia underwent bilateral STN implantation and one with bilateral STN and GPi implantation, although only STN recordings are included in this study. Archival data from twelve subjects with PD were also analyzed (Table 1); seven who underwent surgery at the John Radcliffe Hospital, Oxford University, Oxford, UK and five who underwent surgery at the National Hospital for Neurology and Neurosurgery or Kings College Hospital, London. Six of these patients with PD have previously been reported (Anzak et al., 2016). 10/12 patients with PD underwent bilateral STN implantation, one underwent unilateral STN and thalamus implantation, and one unilateral STN implantation only. The two groups did not differ in age (unpaired t-test, p = 0.159). All patients underwent evaluation for motor impairments using respective clinical scales, the Unified Parkinson's disease rating scale part III – motor exam under on/off medication state for PD patients, and Burke-Fahn-Marsden Dystonia Rating Scale or Craniocervical Dystonia Questionnaire for dystonia patients (Muller et al., 2004; Susatia et al., 2010). The L-dopa equivalent dose in PD groups was calculated based on conversion factors in a previous report (Tomlinson et al., 2010). The procedures for STN targeting and DBS electrode implantation have been previously reported (Chou et al., 2005; Foltynie and Hariz, 2010). The STN was localized on the fused pre-operative frameless magnetic resonance (MR) and framed computed tomography (CT) images. The electrodes were targeted at the dorsolateral area of the STN in both groups. The targets were calculated and determined using the Frame link planning station (Medtronic, Minneapolis, MN, USA). The DBS electrodes were Medtronic 3389 (Medtronic, Minneapolis, MN, USA) with four platinum-iridium cylindrical surface contacts. Each contact was 1.27 mm in diameter and 1.5 mm in length, and separated by 0.5 mm. The most caudal contact was contact 0 and the most rostral
Table 1 Clinical summary. Case Age/sex Diagnosis/main symptoms before operation
Medication
Pre-operative scales (dystonia: BFMDRS(MS,DS)/CDQ-24, off med; PD: UPDRS part-III, off/on med)
Channel selection
d1 d2 d3 d4 d5 d6 d7 d8
21/M 24/M 44/F 74/F 25/M 65/M 52/F 67/F
Dystonia, primary generalised Dystonia, primary generalised Dystonia, primary generalised Dystonia, neuroleptic induced cranial Dystonia, cranial with blepharospasm Dystonia, cranial with blepharospasm Dystonia, cranial with blepharospasm Dystonia, cranial with blepharospasm
53 (43, 10) 50 (38, 12) 58 (46, 12) 24 (18, 6) 28.5 (21.5, 7); CDQ-24: 90 5.5 (5.5, 0); CDQ-24: 46 4.5 (4.5, 0); CDQ-24: 44 12 (7, 5); CDQ-24: 62
L12, R12 L12, R01 L12, R12 L01, R12 L01, R01 L23, R23 L01, R12 L01, R12
p1 p2 p3 p4 p5 p6 p7 p8 p9 p10 p11
56/F 70/M 59/M 60/M 60/F 32/M 68/M 58/M 60/M 60/F 65/M
26/7 62/29 28/5 25/13 63/7 52/13 38/20 45/14 41/21 40/12 23/7
L12, R12 L12, R12 L12, R23 L12, R12 L23, R12 R01 L23 L23, R12 L12, R01 L01, R23 L12, R01
p12
38/M
PD, bradykinesia PD, freezing, gait PD, tremor PD, freezing, bradykinesia PD, bradykinesia, tremor, gait PD, left sided tremor PD, right sided tremor PD, bradykinesia, dyskinesia PD, bradykinesia PD, bradykinesia, gait PD, bradykinesia, rigidity, postural instability PD, tremor, mobility
None None None None None None None Clonazepam and Aripiprazole 900 mg LDED 1100 mg LDED 700 mg LDED 200 mg LDED 1725 mg LDED 875 mg LDED 475 mg LDED 270 mg LDED 600 mg LDED 2000 mg LDED 1670 mg LDED 370 mg LDED
23/10
L12, R23
d1–d8: dystonia cases. p1–p12: PD cases. LDED = L-DOPA daily equivalent dose. BFMDRS = Burke-Fahn-Marsden Dystonia Rating Scale. MS = Movement score. DS = Disability score. CDQ-24 = Craniocervical Dystonia Questionnaire. UPDRS = Unified Parkinson's disease rating scale. Part – III: Motor Exam.
102
X. Geng et al. / Neurobiology of Disease 98 (2017) 100–107
contact 3. Subjects had local anesthesia and were awake during the operation to allow for the intraoperative evaluation of stimulation effects. The final positioning of the electrode was selected to maximize clinical improvements and, in particular, minimize side-effects during intra-operative stimulation (Starr, 2002). The placement of DBS electrodes was confirmed with fused post-operative images and pre-operative MR images on the same software as for pre-operative planning.
between 0.5 and 500 Hz and sampled at 2048 Hz. Monopolar recordings of LFPs were subsequently converted off-line to a bipolar montage between adjacent contacts (three bipolar channels per side) to limit the effects of volume conduction from distant sources. Line noise artefacts at 50 Hz and 100 Hz were removed using notch filters.
2.2. Recording
Signals were down-sampled to 1 kHz and pre-processed with bandpass filtering over 3–45 Hz and 60–140 Hz respectively. Signal processing, data analysis and statistical analysis were performed offline with scripts developed in MATLAB (MathWorks Inc., Natick, MA, USA). A continuous 50-second sample, free of artefacts signals, was selected from one bipolar channel on each side for analysis in each subject (details of channel selected in Table 1). The channel was selected for further processing on the basis of intra-operative testing and post-operative clinical programming, and if recording quality and artefact free data were insufficient at that channel an adjacent one was chosen.
2.3. Signal processing
Patients of both groups were recorded from externalized electrode leads while sitting at rest post-operatively 1–3 (mean 2) days following surgery in dystonia and 2–5 (mean 3) days in PD. Patients were not instructed to suppress any involuntary movement but were asked to avoid voluntary movement during recording. In the dystonia patients, case d8 was treated with clonazepam and aripiprazole during recording from the externalized electrode. Case d4 had a history of treatment with haloperidol and tiapride but ceased these two months before surgery. All datasets in dystonia were acquired at the Department of Neurosurgery, Beijing Tian-Tan Hospital, Capital Medical University, Beijing, China. In Fig. 1 the dystonia off group refers to the seven cases d1 to d7, and dystonia on refers to case d8, the only dystonia patient on medication at the time of recording. In the PD group, all patients were recorded in both on and off medication conditions, using medication as prescribed preoperatively. In dystonia patients, bipolar LFPs were recorded from the adjacent four contacts (contact pairs: 01, 12, 23) of each DBS electrode. The signals were amplified, notch filtered to remove 50 Hz line noise, bandpass filtered over 1–500 Hz using a Digitimer Amplifier (Model D360, Digitimer Ltd., Hertfordshire, UK) and recorded with a sampling frequency of 2 kHz using a CED 1401 (Cambridge Electronic Design, Cambridge, UK). In PD patients LFPs were recorded monopolarly with respect to a linked earlobe reference using a TMSiporti amplifier (TMS international) and its respective software. Recordings were band-pass filtered
2.4. Spectra analysis Signals were bandpass filtered between 3–45 Hz and 60–140 Hz and then z-transformed to reduce the variance between subjects due to surgical targeting and recording. Power spectral density was calculated using the Welch's method (Shimamoto et al., 2013; Welch, 1967) with 1 second sliding-window, 0.5 seconds overlap and 2048 points. tTests were introduced for statistical comparison between groups. The normalised power spectra from the dystonia and PD groups were compared every 0.5 Hz over 3–45 Hz and 60–140 Hz. To allow for multiple comparisons across frequencies we opted for conservative criteria for significance; three or more consecutive bins with p b 0.001. Moreover, to eliminate the effects of frequency variance, spectra were realigned to the frequency of peak power over 5–10 Hz, 11–32 Hz and 60– 140 Hz respectively for statistical analysis. Note that dystonia case d6 was excluded in assessments of the high gamma band (60–140 Hz)
A
B
C
D
E
F
Fig. 1. Group power spectra over 0–45 Hz (left) and 60–140 Hz (right) averaged across subjects with dystonia off medication (A and B, black line) and separately for case d8 on clonazepam and aripiprazole (A and B, green line); PD off levodopa (C and D, red line) and on levodopa (C and D, blue line). Dashed lines show individual spectra of all subjects in the respective conditions. Results of serial two-sample, unpaired t-tests between dystonia off medication and PD groups, one-sample t-tests between dystonia off medication and averaged case d8 on medication and paired t-tests between PD off and on (E and F). LFPs were z-transformed before spectral analysis. Spectral resolution is 0.5 Hz. Note ln (P) y axis scales in E and F.
X. Geng et al. / Neurobiology of Disease 98 (2017) 100–107
0.15
PD on
0.1 0.05 0 -5
0
5 10 15 Relative frequency(Hz)
20
E
D P=1
0.1
0.05
-5
0 5 10 Relative frequency(Hz)
15
F
P=1
0
5
10
15
Relative frequency(Hz)
20
25
−10
0.04 PD on
0.03 0.02 0.01 0 -15
20
-10
-5 0 5 Relative frequency(Hz)
−10
−5
10
15
P=1 0.01 0.001
0.01 0.001
0.01 0.001
−5
PD on
0 -10
25
C
0.15
Normalised power
B Normalised power
Normalised power
A 0.2
103
−5
0
5
10
15
20
−15
Relative frequency(Hz)
0
5
10
15
Relative frequency(Hz)
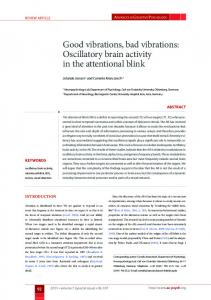
Fig. 2. Group average normalised power spectra realigned to the peak frequency over 5–10 Hz in panel A, 11–32 Hz in panel B and 60–140 Hz in panel C. Results of serial two-sample, unpaired t-tests between the dystonia off medication (n = 14 except n = 12 for gamma band analysis) and PD group off (n = 22) and on (n = 22) medication and paired t-tests between PD on/off (both n = 22) states are shown in D-F. LFPs were z-transformed before spectral analysis. The shadows in the respective colours denote ±1 standard deviations of the groups. As there were no clear gamma peaks in the selected channels of PD cases, 80 Hz was taken as the centre frequency for realignment based on previous literature where fine-tuned gamma oscillations were usually found in 60–95 Hz (Kempf et al., 2009; Jenkinson et al., 2013).
due to broadband noise contaminating the observed frequencies. Note also that dystonia case d8 on aripiprazole was only included in group comparison in Fig. 1 as a single case, and excluded in the realigned spectra comparison between dystonia off medication and PD on/off medication groups in Fig. 2.
the judgement until the renewed Q does not belong to SQπ, then the Q is a new pattern. (3) Increasing the counting number CN by one. Q is appended to S and then reset to empty. Update the unprocessed sequence and repeat step (2) until Q is the last character. (4) The LZC is then derived by the formula:
2.5. Dynamic analysis Power spectra characterize average distributions of signal variance over frequency, but do not fully capture temporal patterns in the time series. Lempel-Ziv complexity (LZC) measures the random level of a time series by evaluating the regularity/randomness and numbers of repeats in the binary sequence. For a totally random time series, the patterns of the sequence are theoretically unpredictable and there are a higher number of different subsequences. The number of subsequences is limited for regular oscillations and the LZC value is lower compared to more random signals, like white noise. The LZC is generally independent of the amplitude scaling as the signal is converted to binary sequences (Ziv and Lempel, 1977; Zhang et al., 2001; Gómez et al., 2011). Hence, it is relatively immune to LFP signal variations due to minor differences in surgical targeting, and has previously been shown to be negatively correlated with the strength of beta band synchronisation (Chen et al., 2010). The pre-processed signals were band-pass filtered over low frequency, low beta and high beta (band-pass centred on the peak in each band ± 3 Hz wide) and a high gamma band over 60–140 Hz (band-pass centred on the peak ± 10 Hz wide). In the absence of a peak the frequency in the low frequency and beta bands was taken to be that of the peak in the respective band in the group average The individual neural oscillations of STN LFPs were converted into a binary sequence by thresholding using the median value of the amplitude of the neural oscillations as the threshold and the LZC applied on every 1 second epoch and averaged (Ziv and Lempel, 1977; Chen et al., 2010). The principle of LZC is to measure the number of distinct patterns in a 0–1 sequence by scanning the sequence from left to right and counting the number of patterns every time a new one occurs. The LZC was computed with the following steps: (1) Initialising the sequences S and Q as two subsequences of the digitalized time series, s1 , s2 , … , sN. SQ is the concatenation of S and Q and SQπ is defined as SQ with the last symbol being deleted. At the beginning, SQπ = s1 and the counting number of distinct pattern CN = 1. (2) Scanning the unprocessed sequence, s3 , s4 , … , sN, by removing the first symbol and adding in Q. If Q belongs to SQπ, then Q is not a new pattern, then append the next symbol in Q and repeat
LZC ¼
CN N=log2 ðNÞ
where N is the length of the sequence. 3. Results 3.1. Different spectral characteristics in dystonia and PD Examples of time-frequency spectra of LFPs recorded from electrodes targeting the STN are shown for a dystonic patient off medication, and for case d8 with dystonia but on clonazepam and aripiprazole, and for an exemplar PD patient recorded on and off medication (Supplementary Fig. 1). The normalised power spectra densities of 14 sides from 7 dystonia off medication patients and 2 sides from 1 on medication patient, together with 22 sides from 12 PD on/off medication patients are shown individually and averaged within groups in Fig. 1. Distinct spectral power peak was found in the beta band only in PD off and on groups and in the dystonia case d8 on clonazepam and aripiprazole, while elevated low frequency power and high gamma oscillation were found in the dystonia off group. Contiguously significant differences were found over 5–7 Hz between power spectra in dystonia off and PD on/off groups (two-sample unpaired t-tests, p b 0.001 in each of 3 and 5 contiguous bins respectively); over 16.5–18 Hz between dystonia off and PD off group (p b 0.001 in each of 3 contiguous bins) and over 96.5–99.5 Hz between dystonia off and PD on/off groups (p ≤ 0.001 in each of 6 contiguous bins). Paired t-tests suggested a low beta power decrease in PD on compared to off state (p b 0.001) but this did not reach our criteria for significance as it involved only one isolated bin. Moreover, the averaged spectral power over 24–30 Hz was significantly higher in dystonia case d8 on medication compared to dystonia off group (two-sample unpaired t-tests, p b 0.001 in each of 9 bins) while the low frequency power decreased over 5–10 Hz (not significant). The significant differences between power spectra reported above were also present when all recording channels were separately averaged in dystonia (n = 16 sides, 48 channels) and PD on/off medication (n = 22 sides, 66 channels) and compared between the three
104
X. Geng et al. / Neurobiology of Disease 98 (2017) 100–107
groups (Supplementary Fig. 2). This underscores that differences were not due to a bias in channel selection.
p ≤ 0.001 in both conditions). Medicated PD also had a higher LZC in the low beta band compared to PD off state (t-test p b 0.005).
3.2. Comparison of realigned peak power in dystonia and PD
4. Discussion
The frequency of spectral peaks varied among subjects. Peaks over the 5–10 Hz range had a mean frequency of 7.3 ± 1.5 Hz (mean ± SD) and 92 ± 8.6 Hz over the 60–140 Hz range in the dystonia off group, while those over the 11–32 Hz ranges had mean frequencies of 17.3 ± 6 Hz in the PD off group. Although spectral peaks in the PD off group were commonest in the low beta band and centred around 17 Hz, two sides of one PD patient off medication demonstrated peaks only in the upper beta band. This variability might lead to an under-estimate of the difference between patient groups so power spectra were therefore separately re-aligned to the maximum value in absolute power spectra from a given electrode within the low frequency and whole beta band ranges (Fig. 2). This procedure exaggerated the differences between the patient groups over the 5–10 Hz, 11–32 Hz and 60– 140 Hz ranges, particularly within the beta band in which peak frequency variation was greatest (Fig. 2). Unpaired t-tests showed a significant difference between dystonia off and PD on/off states over the central frequencies (p b 0.001 in each of at least 5 contiguous bins). The findings were similar if only peaks in the low beta band were selected for realignment before averaging (data not shown).
By comparing LFPs recorded postoperatively from electrodes targeting STN in patients with dystonia and PD, we have demonstrated significant differences in both spectral power amplitude and dynamic oscillatory patterns between these conditions over low frequency and beta bands. This suggests that different oscillatory activities are associated with different phenotypes even in the same nucleus. Distinct circuit abnormalities might lend themselves to more targeted forms of DBS, including adaptive stimulation (Little et al., 2013).
3.3. Dynamic analysis in dystonia and PD LZC is a nonlinear dynamic analysis that provides a complexity measure of the temporal pattern of neural oscillations, and is not directly influenced by the amplitude scaling of the signal. Significant differences (Fig. 3) were found in LZC between dystonia off and PD on/off medication groups over low frequency (F(2, 55) = 21.4, p b 0.0001, one-way ANOVA), the low beta band (F(2, 55) = 104.4, p b 0.0001, one-way ANOVA) and the high gamma band F(2, 53) = 316.3, p ≤ 0.0001, ANOVA). The LZC over the 5–10 Hz and 60–140 Hz bands in dystonia off condition was significantly lower than in the PD on/off groups (ttests, p ≤ 0.001 in both conditions). The LZC in the low beta band was significantly higher in dystonia than in PD on/off groups (t-tests,
0.3 PD on
**
LZC
**
0.25
0.2
Our results in patients with dystonia help address two questions: is prominent low frequency activity of the LFPs local to GPi or a basal ganglia circuit phenomenon, and is it specific to dystonia? Prominent low frequency activity of LFPs has been reported in dystonia in GPi (Liu et al., 2008; Moll et al., 2014; Sharott et al., 2008; Silberstein et al., 2003), and in STN (Neumann et al., 2012; Wang et al., 2016). Our data add to the evidence that low frequency activity is a basal ganglia circuit phenomenon rather than focal and this observation may help explain why DBS of both the STN and GPi can improve dystonia (Weinberger et al., 2011). However, is such low frequency activity specific to dystonia? In GPi low frequency activity is elevated in dystonic patients but not in patients with PD who are off their medication (Silberstein et al., 2003). A case report came to similar conclusions for STN (Neumann et al., 2012), but a large case series concluded that there was no difference in low frequency activity in STN between patients with PD and dystonia (Wang et al., 2016). That said, this case series demonstrated a trend towards higher relative theta activity in the STN in dystonia than in PD (p = 0.0651; their Supplementary Fig. 2). Our data point to a clear difference between the dystonic and untreated PD patients, both with spectral measures and LZC. However, this need not equate to a disease specific pattern of low frequency synchronisation in dystonia, as this activity in both the STN and GPi increases in those patients with PD who are treated and develop ondrug dyskinesia (Alonso-Frech et al., 2006; Chen et al., 2006b; Foffani et al., 2005; Rodriguez-Oroz et al., 2011; Silberstein et al., 2003; Silberstein et al., 2005; Weinberger et al., 2011), and so it may not be disease pathology specific. Others have linked elevated theta-alpha activity to mobile elements of dystonia (Barow et al., 2014), and as such it could be argued that exaggerated theta-alpha activity reflects a phenotype of mobile dystonia or dyskinesia, rather than being disease specific (Weinberger et al., 2011). 4.2. Beta activity
**
0.15
** *
0.1
4.1. Low frequency activity
**
**
low-frequency
low-beta
high-beta
gamma
Fig. 3. Complexity analysis of bandpass filtered LFPs centred on the peak frequency in low frequency band (5–10 Hz), low beta band (11–20 Hz), high beta band (20–32 Hz) and gamma band (60–140 Hz). Significant differences were found in LZC among dystonia off, PD on and off conditions over low frequency (F(2, 55) = 21.4, p b 0.0001, ANOVA), the low beta band (F(2, 55) = 104.4, p b 0.0001, ANOVA) and the gamma band F(2, 53) = 316.3, p ≤ 0.0001, ANOVA). Note that two sides from one dystonic case (d6) were excluded for analysis in the gamma band due to artefacts. *p ≤ 0.005, **p ≤ 0.001, posthoc t-tests.
Prominent beta frequency band power has been consistently reported in the GPi and STN of PD patients withdrawn from their medication (Hammond et al., 2007). This was confirmed in the present PD cohort, but patients with dystonia, with the exception of one case, had no discrete or elevated beta power in STN. This is in line with some reports (Neumann et al., 2012; Weinberger et al., 2011), and was further borne out by the diminished LZC in the low beta band in PD patients, particularly when these were withdrawn from dopaminergic medications. Previously, the LZC of subthalamic 13–35 Hz oscillatory activity has been reported as correlating with clinical impairments in patients with PD (Chen et al., 2010). However, Wang et al. (2016) found no difference in beta activity in STN between patients with dystonia and PD. Nevertheless, ten out of the twelve patients reported by the latter group were receiving treatment with benzodiazepines, which can cause widespread increases of beta power and decreases of theta band power (Jensen et al., 2005;
X. Geng et al. / Neurobiology of Disease 98 (2017) 100–107
Yamadera et al., 1993). The Wang et al. (2016) study also differed in other respects, including its intra-operative nature so spectral differences might have conceivably been attenuated by the use of a general anesthetic an hour or two before the recordings, or by a difference in the stun effect experienced immediately after microelectrode recordings and macroelectrode implantation. Our findings in case d8 highlight the particular importance of considering medication effects. This patient was taking clonazepam and aripiprazole. The latter is a partial agonist at D2 and 5-HT1A receptors and antagonist at 5-HT2A receptors (Jordan et al., 2002; Mailman and Murthy, 2010; Shapiro et al., 2003), which in some individuals can induce parkinsonism (Raj and Mangla, 2004; Oommen et al., 2006) and in this individual was associated with a spectral pattern of LFPs in the STN that was similar to that seen in untreated patients with PD. Similar changes have been reported in the GPi in patients with dystonia treated with tetrabenazine (Kühn et al., 2008b), and in combination these data raise the possibility that excessive beta activity may be a hall mark of hypodopaminergic activity in the basal ganglia rather than of any specific disease pathology. This remains to be clarified. 4.3. Gamma activity Patients with dystonia had greater subthalamic LFP power around 92 ± 8.6 Hz (mean ± SD) than patients with PD, whether the latter were on medication or withdrawn from medication. Gamma activity has previously been considered prokinetic (Brown, 2003), and the finding of elevated activity in the subthalamic LFP in dystonia would be in line with this. Peaks in the gamma range, albeit at slightly lower frequencies (60–95 Hz), have also been reported in the subthalamic LFP in some of patients with PD when on medication, and have been associated with the presence of dyskinesias (Fogelson et al., 2005; Swann et al., 2016). Discrete peaks of local field potential activity at similar frequencies have been reported in motor cortex in a dyskinetic rodent model of PD (Halje et al., 2012) and in dyskinetic PD patients (Swann et al., 2016). Similar peaks have been reported in the human thalamus and globus pallidus in patients with dystonia, myoclonus and tremor, and so their mere presence may not be pathological (Kempf et al., 2009; Jenkinson et al., 2013). However, whether exaggeration of this rhythm relates to dyskinesias and dystonia remains a possibility, and the significance of the slight shift to higher frequencies in dystonia remains to be established. 4.4. Dynamics of activity The LZC characterizes the complexity of a given signal by measuring the repeatable patterns in the signal, and is derived by counting the number of the new subsequences (Ziv and Lempel, 1977; Zhang et al., 2001; Aboy et al., 2006). The LZC reflects the rate of new patterns in the sequence, which is related to the randomness and predictability of the signal, and is also influenced by the level and distribution of the noise in the signal (Aboy et al., 2006). The LZC is low when the signal is regular and predictable, and it is high when the signal is random and less predictable. For example, the LZC decreases when the EEG signal becomes synchronised with high-amplitude slow waves (Andrillon et al., 2016), and is a robust measure reflecting the decrease of neural complexity of spontaneous EEG during general anesthesia (Schartner et al., 2015). This is able to accurately track the level of consciousness in patients and health subjects under anesthesia and during sleep (Zhang et al., 2001; Andrillon et al., 2016). In PD patients, resting state MEG signals show less complexity than in control subjects (Gómez et al., 2011). STN local field potentials in PD patients also have reduced complexity, and there is significant negative correlation between the complexity of these signals, assessed using LZC, and akinesia-rigidity (Chen et al., 2010). The LZC may therefore be considered a useful tool for capturing neural dynamics.
105
4.5. Limitations and strengths of the present study Recordings from the patient groups were derived from different centres which raises the possibility that there were subtle differences in the targeting. We were unable to explore this issue further due to the generally thick acquisition slices made during post-operative imaging in the patients with dystonia and the unavailability of some of the imaging in some of the archival patients. Targeting variance may increase the variance between subjects as LFP amplitude is dependent on the distance from the generator. Our spectral normalization and use of the LZC help address this issue. In Supplementary Methods we also include the spectral results when we average across all electrode contacts so as to further limit the effects of any potential small systematic variation in the targeting between the centres, although such averaging has the drawback that spatial resolution is limited and we can only ascribe those spectral findings to the STN area. Nevertheless, the differences between conditions in data from the broader STN area were similar to those presented in the main results. Interpretational ambiguity can be introduced when spectra are normalised by total spectral power in order to limit signal variance due to small differences in surgical targeting (Chen et al., 2010). Here, the results of analysis of z transformed spectral data were corroborated by the estimation of the LZC. This measure is not influenced by the amplitude scaling of the signal, but nevertheless is affected by the degree of beta activity, and negatively correlates with the latter (Chen et al., 2010). 5. Conclusions In sum, the present data suggest that distinctive spectral patterns exist as basal ganglia circuit phenomena in PD and dystonia. It is the possibility that the same region can be involved in different patterns of circuit dysfunction that may explain the paradox whereby functional surgical approaches to the same target can improve different conditions (Brown and Eusebio, 2008). Supplementary data to this article can be found online at http://dx. doi.org/10.1016/j.nbd.2016.12.006. Funding sources for this study This work was supported by the China Scholarship Council [grant number 201504910526]; the National Natural Science Foundation of China [grant number 81471745]; The Beijing Municipal Administration of Hospitals Clinical Medicine Development of Special Funding [grant number ZYLX201305]; the Medical Research Council [grant number MC_UU_12024/1]; the Suzhou Key Laboratory of Neural Engineering and Technology [grant number SZS01414]; and the Suzhou Medical Device and Medicine Key Program [grant number ZXY201425]. Relevant conflicts of interests/financial disclosure Nothing to report. Authors' roles Xinyi Geng designed experiments, analyzed and interpreted the data and drafted manuscript. Jianguo Zhang collected local field potentials data, managed the clinical evaluation of dystonia patients, conducted experiments and revised manuscript. Yi Jiang helped collect local field potentials data and managed the clinical evaluation of dystonia patients. Keyoumars Ashkan, Thomas Foltynie, Patricia Limousin, Ludvic Zrinzo, Alexander L Green and Tipu Aziz helped collect local field potentials data, managed the clinical evaluation of Parkinson's patients and commented on the manuscript. Peter Brown helped supervise the data analysis and preparation of the manuscript. Shouyan Wang helped supervise the data analysis and review manuscript.
106
X. Geng et al. / Neurobiology of Disease 98 (2017) 100–107
Acknowledgements The authors express great appreciation to Dr. Huiling Tan at University of Oxford, UK and Dr. Yongzhi Huang at Suzhou Institute of Biomedical Engineering and Technology, Chinese Academy of Sciences, China for their valuable comments on signal analysis. References Aboy, M., Hornero, R., Abásolo, D., et al., 2006. Interpretation of the Lempel-Ziv complexity measure in the context of biomedical signal analysis. IEEE Trans. Biomed. Eng. 53, 2282–2288. Alonso-Frech, F., Zamarbide, I., Alegre, M., et al., 2006. Slow oscillatory activity and levodopa-induced dyskinesias in Parkinson's disease. Brain 129, 1748–1757. Andrillon, T., Poulsen, A.T., Hansen, L.K., et al., 2016. Neural markers of responsiveness to the environment in human sleep. J. Neurosci. 36, 6583–6596. Anzak, A., Tan, H., Pogosyan, A., et al., 2016. Subcortical evoked activity and motor enhancement in Parkinson's disease. Exp. Neurol. 277, 19–26. Barow, E., Neumann, W.J., Brücke, C., et al., 2014. Deep brain stimulation suppresses pallidal low frequency activity in patients with phasic dystonic movements. Brain 137, 3012–3024. Brittain, J.S., Brown, P., 2014. Oscillations and the basal ganglia: motor control and beyond. NeuroImage 85, 637–647. Brown, P., 2003. The oscillatory nature of human basal ganglia activity: relationship to the pathophysiology of Parkinson's disease. Mov. Disord. 18, 357–363. Brown, P., Eusebio, A., 2008. Paradoxes of functional neurosurgery: clues from basal ganglia recordings. Mov. Disord. 23, 12–20. Chen, C.C., Kühn, A., Hoffmann, K.T., et al., 2006a. Oscillatory pallidal local field potential activity correlates with involuntary EMG in dystonia. Neurology 66, 418–420. Chen, C.C., Kühn, A., Trottenberg, T., et al., 2006b. Neuronal activity in globus pallidus interna can be synchronized to local field potential activity over 3–12 Hz in patients with dystonia. Exp. Neurol. 202, 480–486. Chen, C.C., Hsu, Y.T., Chan, H.L., et al., 2010. Complexity of subthalamic 13–35 Hz oscillatory activity directly correlates with clinical impairment in patients with Parkinson's disease. Exp. Neurol. 224, 234–240. Chou, K.L., Hurtig, H.I., Jaggi, J.L., et al., 2005. Bilateral subthalamic nucleus deep brain stimulation in a patient with cervical dystonia and essential tremor. Mov. Disord. 20, 377–380. Eusebio, A., Thevathasan, W., Doyle-Gaynor, L., et al., 2011. Deep brain stimulation can suppress pathological synchronization in Parkinsonian patients. J. Neurol. Neurosurg. Psychiatry 82, 569–573. Foffani, G., Ardolino, G., Meda, B., et al., 2005. Altered subthalamo-pallidal synchronisation in parkinsonian dyskinesias. J. Neurol. Neurosurg. Psychiatry 76, 426–428. Fogelson, N., Pogosyan, A., Kühn, A.A., et al., 2005. Reciprocal interactions between oscillatory activities of different frequencies in the subthalamic region of patients with Parkinson's disease. Eur. J. Neurosci. 22, 257–266. Foltynie, T., Hariz, M.I., 2010. Surgical management of Parkinson's disease. Expert. Rev. Neurother. 10, 903–914. Foncke, E.M., Bour, L.J., Speelman, J.D., et al., 2007. Local field potentials and oscillatory activity of the internal globus pallidus in myoclonus-dystonia. Mov. Disord. 22, 369–376. Gómez, C., Olde Dubbelink, K.T., Stam, C.J., et al., 2011. Complexity analysis of resting-state MEG activity in early-stage Parkinson's disease patients. Ann. Biomed. Eng. 39, 2935–2944. Halje, P., Tamtè, M., Richter, U., et al., 2012. Levodopa-induced dyskinesia is strongly associated with resonant cortical oscillations. J. Neurosci. 32, 16541–16551. Hammond, C., Bergman, H., Brown, P., 2007. Pathological synchronization in Parkinson's disease: networks, models and treatments. Trends Neurosci. 30, 357–364. Jenkinson, N., Kühn, A., Brown, P., 2013. Gamma oscillations in the human basal ganglia. Exp. Neurol. 245, 72–76. Jensen, O., Goel, P., Kopell, N., et al., 2005. On the human sensorimotor-cortex beta rhythm: sources and modeling. NeuroImage 26, 347–355. Jordan, S., Koprivica, V., Chen, R., et al., 2002. The antipsychotic aripiprazole is a potent, partial agonist at the human 5-HT1A receptor. Eur. J. Pharmacol. 441, 137–140. Kempf, F., Brücke, C., Salih, F., et al., 2009. Gamma activity and reactivity in human thalamic local field potentials. Eur. J. Neurosci. 29, 943–953. Kleiner-Fisman, G., Liang, G.S., Moberg, P.J., et al., 2007. Subthalamic nucleus deep brain stimulation for severe idiopathic dystonia: impact on severity, neuropsychological status, and quality of life. J. Neurosurg. 107, 29–36. Kühn, A., Trottenverg, T., Kivi, A., et al., 2005. The relationship between local field potential and neuronal discharge in the subthalamic nucleus of patients with Parkinson's disease. Exp. Neurol. 194, 212–220. Kühn, A., Kempf, F., Brücke, C., et al., 2008a. High-frequency stimulation of the subthalamic nucleus suppresses oscillatory beta activity in patients with Parkinson's disease in parallel with improvement in motor performance. J. Neurosci. 28, 6165–6173. Kühn, A., Brücke, C., Schneider, G.H., et al., 2008b. Increased beta activity in dystonia patients after drug-induced dopamine deficiency. Exp. Neurol. 214, 140–143. Kühn, A., Fogelson, N., Limousin, P.D., et al., 2009. Frequency-specific effects of stimulation of the subthalamic area in treated Parkinson's disease patients. Neuroreport 20, 975–978. Lee, J.R., Kiss, Z.H., 2013. Interhemispheric difference of pallidal local field potential activity in cervical dystonia. Mov. Disord. 85, 306–310. Little, S., Pogosyan, A., Neal, S., et al., 2013. Adaptive deep brain stimulation in advanced Parkinson's disease. Ann. Neurol. 74, 449–457.
Liu, X., Yianni, J., Wang, S., et al., 2006. Different mechanisms may generate sustained hypertonic and rhythmic bursting muscle activity in idiopathic dystonia. Exp. Neurol. 198, 204–213. Liu, X., Wang, S., Yianni, J., et al., 2008. The sensory and motor representation of synchronised oscillations in the globus pallidus in patients with primary dystonia. Brain 131, 1562–1573. López-Azcárate, J., Tainta, M., Rodriguez-Oroz, M.C., et al., 2010. Coupling between beta and high-frequency activity in the human subthalamic nucleus may be a pathophysiological mechanism in Parkinson's disease. J. Neurosci. 30, 6667–6677. Mailman, R.B., Murthy, V., 2010. Third generation antipsychotic drugs: partial agonism or receptor functional selectivity? Curr. Pharm. Des. 16, 488–501. Moll, C.K., Galindo-Leon, E., Sharott, A., et al., 2014. Asymmetric pallidal neuronal activity in patients with cervical dystonia. Front. Syst. Neurosci. 8, 15. Muller, J., Wissel, J., Kemmler, G., et al., 2004. Craniocervical dystonia questionnaire (CDQ24): development and validation of a disease-specific quality of life instrument. J. Neurol. Neurosurg. Psychiatry 75, 749–753. Neumann, W.J., Huebl, J., Brücke, C., et al., 2012. Enhanced low-frequency oscillatory activity of the subthalamic nucleus in a patient with dystonia. Mov. Disord. 27, 1063–1066. Oommen, E., Chand, P.K., Sharma, P.S., 2006. Aripiprazole-induced tardive dystonia. Prim. Care Companion J. Clin. Psychiatry 8, 378–379. Ostrem, J.L., Racine, C.A., Glass, G.A., et al., 2011. Subthalamic nucleus deep brain stimulation in primary cervical dystonia. Neurology 76, 870–878. Ostrem, J.L., Markun, L.C., Glass, G.A., et al., 2014. Effect of frequency on subthalamic nucleus deep brain stimulation in primary dystonia. Parkinsonism Relat. Disord. 20, 432–438. Özkurt, T.E., Butz, M., Homburger, M., et al., 2011. High frequency oscillations in the subthalamic nucleus: a neurophysiological marker of the motor state in Parkinson's disease. Exp. Neurol. 229, 324–331. Raj, L., Mangla, D., 2004. Aripiprazole induced severe parkinsonian symptoms – a case report. Indian J. Psychiatry 46, 174–175. Ray, N.J., Jenkinson, N., Wang, S., et al., 2008. Local field potential beta activity in the subthalamic nucleus of patients with Parkinson's disease is associated with improvements in bradykinesia after dopamine and deep brain stimulation. Exp. Neurol. 213, 108–113. Rodriguez-Oroz, M.C., López-Azcárate, J., Garcia-Garcia, D., et al., 2011. Involvement of the subthalamic nucleus in impulse control disorders associated with Parkinson's disease. Brain 134, 36–49. Schartner, M., Seth, A., Noirhomme, Q., et al., 2015. Complexity of multi-dimensional spontaneous EEG decreases during propofol induced general anaesthesia. PloS One 10. Schrock, L.E., Ostrem, J.L., Turner, R.S., et al., 2009. The subthalamic nucleus in primary dystonia: single-unit discharge characteristics. J. Neurophysiol. 102, 3740–3752. Shapiro, D., Renock, S., Arrington, E., et al., 2003. Aripiprazole, a novel atypical antipsychotic drug with a unique and robust pharmacology. Neuropsychopharmacology 28, 1400–1411. Sharott, A., Grosse, P., Kühn, A., et al., 2008. Is the synchronization between pallidal and muscle activity in primary dystonia due to peripheral afferance or a motor drive? Brain 131, 473–484. Shimamoto, S.A., Ryapolova-Webb, E.S., Ostrem, J.L., et al., 2013. Subthalamic nucleus neurons are synchronized to primary motor cortex local field potentials in Parkinson's disease. J. Neurosci. 33, 7220–7233. Silberstein, P., Kühn, A., Kupsch, A., et al., 2003. Patterning of globus pallidus local field potentials differs between Parkinson's disease and dystonia. Brain 126, 2597–2608. Silberstein, P., Oliviero, A., Di Lazzaro, V., et al., 2005. Oscillatory pallidal local field potential activity inversely correlates with limb dyskinesias in Parkinson's disease. Exp. Neurol. 195, 523–529. Starr, P.A., 2002. Placement of deep brain stimulators into the subthalamic nucleus or Globus pallidus internus: technical approach. Stereotact. Funct. Neurosurg. 79, 118–145. Susatia, F., Malaty, I.A., Foote, K.D., et al., 2010. An evaluation of rating scales utilized for deep brain stimulation for dystonia. J. Neurol. 257, 44–58. Swann, N.C., de Hemptinne, C., Miocinovic, S., et al., 2016. Gamma oscillations in the hyperkinetic state detected with chronic human brain recordings in Parkinson's disease. J. Neurosci. 36, 6445–6458. Tomlinson, C.L., Stowe, R., Patel, S., et al., 2010. Systematic review of levodopa dose equivalency reporting in Parkinson's disease. Mov. Disord. 25, 2649–2685. van Wijk, B.C., Beudel, M., Jha, A., et al., 2016. Subthalamic nucleus phase-amplitude coupling correlates with motor impairtment in Parkinson's disease. Clin. Neurophysiol. 127, 2010–2019. Wang, D.D., de Hemptinne, C., Miocinovic, S., et al., 2016. Subthalamic local field potentials in Parkinson's disease and isolated dystonia: an evaluation of potential biomarkers. Neurobiol. Dis. 89, 213–222. Weinberger, M., Mahant, N., Hutchison, W.D., et al., 2006. Beta oscillatory activity in the subthalamic nucleus and its relation to dopaminergic response in Parkinson's disease. J. Neurophysiol. 96, 3248–3256. Weinberger, M., Hutchison, W.D., Alavi, M., et al., 2011. Oscillatory activity in the globus pallidus internus: comparison between Parkinson's disease and dystonia. Clin. Neurophysiol. 123, 358–368. Welch, P.D., 1967. The use of fast Fourier transform for the estimation of power spectra: a method based on time averaging over short, modified periodograms. IEEE Trans. Audio Electroacoust. 15, 70–73. Whitmer, D., de Solages, C., Hill, B.C., et al., 2012. High frequency deep brain stimulation attenuates subthalamic and cortical rhythms in Parkinson's disease. Front. Hum. Neurosci. 6, 155. Whitmer, D., de Solages, C., Hill, B.C., et al., 2013. Resting beta hypersynchrony in secondary dystonia and its suppression during pallidal deep brain stimulation in DYT3+ Lubag dystonia. Neuromodulation 16, 200–205.
X. Geng et al. / Neurobiology of Disease 98 (2017) 100–107 Yamadera, H., Kato, M., Ueno, T., et al., 1993. Pharmaco-EEG mapping of diazepam effects using different references and absolute and relative power. Pharmacopsychiatry 26, 254–258. Zaidel, A., Spivak, A., Grieb, B., et al., 2010. Subthalamic span of beta oscillations predicts deep brain stimulation efficacy for patients with Parkinson's disease. Brain 133, 2007–2021.
107
Zhang, X.S., Roy, R.J., Jensen, E.W., 2001. EEG complexity as a measure of depth of anesthesia for patients. IEEE Trans. Biomed. Eng. 48, 1424–1433. Ziv, J., Lempel, A., 1977. Universal algorithm for sequential data compression. IEEE Trans. Inf. Theory 23, 337–343.