3- Department of Genitourinary Pathology. Armed Forces Institute of Pathology (AFIP), Washington D.C. 20306-6000. 4- Center for Prostate Disease Research ...
Comparison of Prostate Biopsy Protocols using 3-D Computer Simulation John J. Bauer (1,4), Jianchao Zeng (2), Isabell A. Sesterhenn (3), Judd W. Moul (4), Seong K. Mun (2) 1- Urology Service, Department of Surgery Walter Reed Army Medical Center, Washington D.C. 20307-5001 2- Imaging Science and Information Systems Center (ISIS) Department of Radiology, Georgetown University Medical Center 2115 Wisconsin Avenue, NW, Suite 603, Washington, DC 20007 3- Department of Genitourinary Pathology Armed Forces Institute of Pathology (AFIP), Washington D.C. 20306-6000 4- Center for Prostate Disease Research (CPDR) Department of Surgery, Uniformed Services University of the Health Sciences, Bethesda, Maryland 20814-4799 E-mail: bauer@ tatrc.org
Abstract Urologists to detect prostate cancer routinely use the systematic sextant needle biopsy technique. This patterned biopsy technique has been adopted with little quantitative or scientific evidence to support its use. Using 136 digitized radical prostatectomy specimens, we developed a 3-D computer simulation software to compare the detection rate of cancer among various biopsy protocols. We further investigate the correlation between needle core tumor volume and total tumor volume. The 10- and 12pattern biopsy protocols had a 98.5% detection rate, whereas, the sextant biopsy protocol was only 72.8%. The 5-region biopsy protocol had a 90.4% detection rate and the 14- pattern, which includes all the biopsies used in the patterns above only added one additional positive case (0.7%) All the patterns showed a significant correlation between core tumor volume and total tumor volume. Our results suggest that the 10-pattern biopsy protocol is statistically superior to the routinely used sextant prostate biopsy pattern.
1. Introduction Transrectal ultrasound (TRUS) guided biopsy is routinely used for diagnosis of prostate cancer. The current biopsy protocol is systematic sextant biopsy [1]. However, studies have shown that this protocol results in a positive predicted value of only 32% [2]. Therefore, a significant number of patients with prostate cancer are not being diagnosed. Some researchers have suggested that the sextant technique may not be optimal [3] and others have investigated new biopsy protocols that may give better results [4]. In addition, two-dimensional (2-D) computerbased simulation of prostate cancer has been shown to be useful in evaluating existing biopsy protocols [5]. We feel that since treatment for advanced prostate cancer is currently minimally beneficial emphasis on early detection at the earliest stage is essential. By identifying the most accurate biopsy protocol we may increase the early detection of this disease. Current screening tests for prostate cancer include prostate specific antigen (PSA) and digital rectal exam (DRE). The combination of these two tests has led to an increased number of patients undergoing prostate needle
biopsy. However, as noted above, the accuracy of current biopsy techniques needs to be improved. A recent article in Urology Times reported that patients undergoing repeat prostate biopsy (after negative prior biopsy) still had a negative biopsy rate of 18% for tumors of 0.5 cc to 1 cc; in addition, 15% of the repeat biopsies were negative when the tumor burden exceeded 1 cc in volume. Daneshgari et al [5], developed a 2-D computer simulation of the prostate based on 159 radical prostatectomy specimens. The computer then generated random prostates and tumors. This computer model was used to simulate the sextant biopsy protocol and verify its ability to detect lowvolume tumors. Various biases for the angle of biopsy and distribution of cancer foci were incorporated in the model. The simulation showed that only 20.3% of the simulated prostates had a tumor distribution in which sextant biopsy had a 95% probability of tumor detection. In fact, 26.8% of prostates had a distribution that was completely disjointed from the sextant locations. These prior findings show that a significant number of patients who have prostate cancer are not diagnosed at their initial biopsy. Accordingly, improving the predictive value of TRUS guided biopsy by optimizing biopsy protocols will improve its value as a screening and diagnostic tool. A number of researchers have investigated techniques for improving the accuracy of biopsy protocols; however, several issues remain to be resolved. For example, Eskew et al. introduced a new protocol called 5-region biopsy in which additional needles are added systematically in addition to traditional sextant biopsy [4]. The 5-region biopsy and the traditional sextant biopsy were compared with a total of 119 patients who underwent transrectal ultrasound guided needle biopsy of the prostate. It was shown that of 48 cancer patients, 17 (35%) were detected as having cancers only by the additional needles of the 5region biopsy method within this group. As a result, the new 5-region biopsy method was claimed to improve biopsy results. Eskew’s results are promising, but his study group of 48 patients is small. Therefore, this protocol needs to be validated further, and the underlying rationale for using 12 needles instead of some other number should be examined. Our research group has developed a computer-based 3-D visualization of digitized prostate specimens and has found that the 5-region protocol showed a slightly statistically significant advantage over the sextant method based on 89 cases [6]. The computer simulates the actual biopsy procedure for both 5-region and sextant protocols by calculating the position of each needle within the prostate and determining if the needle has hit the cancer [7]. Stamey conducted a clinical study to evaluate existing biopsy protocols and to study the correlation of estimated findings with clinical significance [8]. This study revealed new information on prostate cancer patterns: a biopsy core length of 3 mm or more can reliably predict cancer of
clinically significant volume, and poorly differentiated cancer areas (with high grades) on biopsy should always be considered to represent clinically significant tumors. Another research group has suggested that new biopsy strategies may be developed based on probability maps of cancer distribution within the prostate [3]. But issues such as how these maps should be built and how new biopsy protocols could be derived from the maps remain to be investigated. Our research effort will focus on the development of a statistically optimized biopsy protocol using a 3-D computer-based simulation of radical prostatectomy specimens. Various standard biopsy protocols and new schemes will be evaluated. Since the new biopsy protocol will be based on statistical analysis of a quantitative database of digitized prostate specimens, it should significantly improve the accuracy of prostate cancer detection.
2. Methods 2.1 Construction of Individual 3-D Computerized Prostate Models Individual 3-D prostate models are constructed from radical prostatectomy specimens. The prostates are stepsectioned using a meat cutter at 2.5mm intervals and then digitized with a scanning resolution of 1,500 dots per inch. Each digitized image is segmented by a single pathologist (IAS) to identify the key pathological structures including the surgical margins, capsule, urethra, seminal vesicles and tumor. The contours of each structure identified on each slice are then stacked and interpolation between the contours is carried out using a 3-D elastic model-based technique [9]. One hundred and thirty six 3-D individual prostate models have been constructed using an SGI Onyx 2 Infinite Reality 10000 Workstation. An interactive biopsy interface was developed to allow real-time rotation and insertion of the ultrasound probe, and depth of needle placement before the biopsy device was fired.
2.2 Evaluation of Biopsy Protocols A single urologist (JJB) completed a total of 18 biopsies on each of the 136 prostate models. The various regions of the prostate were sampled in a similar manner. The tip of the needle was brought up to the capsule of the prostate and then fired in the interactive mode. The computer then automatically determined if the biopsy was positive for tumor and calculated the core tumor volume. Several patterns were completed as defined in table 1. Bilateral transitional zone and seminal vesicle biopsies were also completed.
2.3 Data Analysis The needle core biopsy data was analyzed for variance using the Wilcoxon Scores (Rank Sum) 2-sample test. The correlation of core tumor volume to total tumor volume was analyzed using the Spearman Correlation Coefficient analysis.
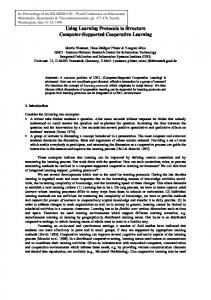
3. Results Table 2 is a summary of the individual positive needle core frequencies. Of the 136 prostate models, both the 10and 12- pattern biopsy protocols detected cancer in 134 models for a detection rate of 98.5%. In comparison, the sextant (6-pattern) biopsy protocol only detected 99 models with cancer (72.8%). As noted in table 2, with the addition of the laterally placed biopsies, the 10-, 12-, 14pattern and 5-region biopsy protocols have a higher detection rate. The extra biopsies used in the 14- pattern biopsy protocol only added one additional positive model where cancer was detected (0.7%). The 5-region biopsy protocol had a positive detection rate of 90.4% (123/136). The transitional zone and seminal vesicle biopsies added little to the detection rate. One model was detected with cancer solely by the transitional zone biopsy (0.7%, 1/136). The seminal vesicle biopsies where never positive when all other biopsies were negative. The overall positive frequencies for the transitional zone biopsies were 29/136 models (21.3%) and for the seminal vesicle biopsies were 4/136 models (2.9%). When the various patterns where analyzed for variance of positive hits using the Wilcoxon Score (Rank Sums) 2sample test, the 10- and 12-pattern protocol was significantly different from the sextant biopsies (p=0.012, p=0.014, respectively). When the 14-pattern and 5-region protocol were compared to the sextant biopsy protocol there was no significant difference in the variance of positive hits (p=0.106, p=0.2841, respectively). When all other pattern combinations were compared there was no significant difference in the variance of positive hits, except that the 10-pattern and 5-region biopsy protocols were significantly different (p=0.050). The correlation of core tumor volume and total tumor volume was significant in all biopsy protocols. The Spearman Correlation Coefficients for each of the biopsy protocols were: sextant (0.550), 10-pattern (0.552), 12-pattern (0.571), 14pattern (0.571) and the 5-region (0.530). A representative scatter plot with a fitted correlation line for the 10-pattern biopsy protocol is shown in figure 1.
4. Conclusions The accurate 3-D reconstruction of the radical prostatectomy specimens with spatial anatomy that
includes the urethra, ejaculatory ducts, seminal vesicles, capsule, surgical margins and the tumors allows for evaluation of various prostate biopsy protocols. In general it was noted that the majority of the tumors were near the posterior-lateral surface of the prostate. The laterally placed biopsies in the posterior-mid and apex regions of the gland resulted in the highest positive biopsy frequencies, most above 50%. It is important to note that actually placing the tip of the needle into the prostate before the biopsy is performed results in a higher negative biopsy rate since the tumors are so close to the posterior capsule. When we compare the various biopsy patterns our results suggest that the 10-pattern biopsy protocol provides the highest relative detection rate for the number of biopsies performed during a single procedure. When compared to the 10-pattern protocol, the additional biopsies of the 12-, 14- and 5-region biopsy protocols do not add significantly to the detection rate or to the correlation of the core tumor volume to the total tumor volume. The results suggest that the correlation of core tumor volume and total tumor volume is significant for all the patterns tested. The objective was to find a biopsy pattern that was significantly better than the commonly used sextant biopsy protocol, however, not at the expense of a much larger number of biopsies per procedure.
4. References 1.) Hodge, KK, et. al: Random systematic versus directed ultrasound guided trans-rectal core biopsies of the prostate. J. Urol., 142: 71, 1989. 2.) Flanigan, R. C., Catalona, W. J., Richie, J. P., Ahmann, F. R., Hudson, M. A., Scadino, R. C., DeKernion, J. B., Ratliff, T. L., Kavoussi, L. R., Dalkin, B. L., Waters, W. B., MacFarlane, M. T. and Southwick, P. C.: Accuracy of digital rectal examination and transrectal ultrasonography in localizing prostate cancer. J. Urol., 152: 1506, 1994. 3.) Goto, Y., Ohori, M., Arakawa, A., Kattan, M. W., Wheeler, T. M. and Scadino, P. T.: Distinguishing clinically important from unimportant prostate cancers before treatment: value of systematic biopsies. J. Urol., 156: 1059, 1996. 4.) Eskew, A. L., Bare, R. L. and McCullough, D. L.: Systematic 5-region prostate biopsy is superior to sextant method for diagnosing carcinoma of the prostate. J. Urol., 157: 199, 1997. 5.) Daneshgari, F., Taylor, G. D., Miller, G. J. and Crawford, E. D.: Computer simulation of the probability of detecting low volume carcinoma of the prostate with six random systematic core biopsies. Urology, 45: 604, 1995 6.) Kaplan, C.R., Lynch, J.H., Zeng, J. et al. Comparision of sextant to 5-region biopsy technique using 3-D computer simulation of actual prostate specimens. submitted to 1998 Annual Meeting of American Urology Society, 1997a.
7.) Hayes, W., Sesterhenn, I., Xuan, J., Wang, J., Lynch, J. and Mun, S. K.: Interactive 3-D modeling of localized prostate cancer and computer simulation of needle biopsy techniques. Annual Meeting of American Urology Society, 1997. 8.) Stamey, T. A.: Making the most out of six systematic sextant biopsies. Urology, 45: 2, 1995.
11.) Udupa, J. K. and Herman, G. T.: 3D imaging in medicine. CRC Press, 1989.
9.) Xuan, J., Hayes, W., Wang, J., Adali, T., Freedman, M., Mun, S. K. and Sesterhenn, I.: Surface reconstruction and visualization of the surgical prostate model. SPIE Medical Imaging, 1997a.
13.) Xuan, J., Wang, J., Adali, T., Zheng, Q., Hayes, W., Freedman and M., Mun, S. K.: A deformable surface-spine model for 3-D object recognition. IEEE ICIP conference, 1997b.
10.) Kaplan, C.R., Lynch, J.H., Zeng, J. et al. Using three dimensional modeling of localized prostate cancer to compare needle core volume to tumor volume. submitted to 1998 Annual Meeting of American Urology Society, 1997b.
14.) Breslow, N. E. and Day, N. E.: Statistical Methods in Cancer Research: Volume II--The Design and Analysis of Cohort Studies. Lyon: International Agency for Research on Cancer, 1987.
12.) Rogers, D. F. and Adams, J. A.: Mathematical elements for computer graphics (2nd Edition). McGraw-Hill Publishing Company, 1990.
Table 1. Biopsy pattern definitions # OF BX'S
----------------6-Pattern: 10-Pattern: 12-Pattern: 14-Pattern: 5-Region:
Sextant= R/L Base + R/L Mid + R/L Apex 6-Pattern + R/L lateral Mid + R/L lateral Apex 10-Pattern + R/L lateral Base 12-Pattern + Middle Base + Middle Apex 6-Pattern + Middle Base + Middle Apex + R/L lateral Base + R/L lateral Apex
---------6 10 12 14 12
Table 2. Needle biopsy frequencies by prostate regions
Prostate Region
Negative
Positive
% Positive
Base Mid Apex
103 73 85
33 63 51
24.3% 46.3% 37.5%
Lateral Base Lateral Mid Lateral Apex
83 63 66
53 73 70
39.0% 53.7% 51.5%
Base Mid Apex
109 87 91
27 49 45
19.9% 36.0% 33.1%
Lateral Base Lateral Mid Lateral Apex
86 72 62
50 64 74
36.8% 47.1% 54.4%
109 106
27 30
19.9% 22.1%
**LEFT**
**RIGHT**
*MIDDLE* Base Apex
Figure 1. Correlation of core tumor volume vs. total tumor volume for the 10-pattern biopsy protocol
40
30
20
TVOLUME
10
0 0.0
TCV_10PA
.1
.2
.3