for PD Monitoring of Power Transformers. L. Hao, P.L. Lewin, Y. Tian, J.S. Wilkinson, S.J. Sutton1 and S.G. Swingler. The Tony Davies High Voltage Laboratory, ...
Conference Record of the 2006 IEEE International Symposium on Electrical Insulation
Application of Electro-optic Modulation Technique for PD Monitoring of Power Transformers L. Hao, P.L. Lewin, Y. Tian, J.S. Wilkinson, S.J. Sutton1 and S.G. Swingler The Tony Davies High Voltage Laboratory, University of Southampton, Southampton, SO17 1BJ, UK 1 National Grid Transco, Gallows Hill, Warwick, CV34 6DA, UK Southampton has concentrated on detecting internal PD activity in 400kV autotransformers, by measuring the current flowing to earth from the bushing tap point. This has been achieved by using a broadband (i.e a useful bandwidth of 200 MHz) radio frequency current transducer (RFCT) as the sensor. Field trials as well as laboratory-based experiments have shown that this approach is feasible [6]. A related project at Southampton has developed an electrooptic modulation technique for transmission of PD measurement signals from high voltage cable joints to an analysis point (usually one end of the cable circuit). This method has been successfully applied to the measurement of PD from 400kV cable joints [7]. Here we report its application to the transmission of signals from a RFCT that is monitoring the current flowing to earth from the tap point of a 60kV bushing. One reason for considering this application is that optical transmission of signal data is preferable in electrically noisy environments typically associated with high voltage substations. Another benefit is that the low levels of signal attenuation associated with optical transmission mean that anyone analysing the data may work at a very safe distance from the discharge source. Results presented here are for discharge signals from two different pd sources connected to the bushing core bar and obtained results are very promising.
Abstract- Partial discharge (PD) detection is an important technique for assessing the health of high voltage power transformers. A partial discharge signal within an oil-filled power transformer may reach a winding first, then travel along the winding to the bushing core bar. The bushing, acting like a capacitor, can transfer the high frequency components of the partial discharge signal to its tap point. Previous published work [1] has shown that these high frequency components at the bushing tap point can be detected using a suitable sensor and transmitted to remote digital equipment for on-line analysis. In a high voltage substation there is often excessive electrical noise which may corrupt any measured PD signal from the bushing tap point as the bushing acts as an antenna. If signal transmission is implemented using standard coaxial cables this can result in further corruption of the PD signal. The use of optical transmission techniques therefore has clear advantages not only through improved noise immunity but also because it realises electrical isolation and improved operator safety. This paper details the application of an electrooptic modulator to generate transmission signals over polarization maintaining optical fibre from the measurement point. The feasibility of this approach has been investigated using PD signals measured at the tap point of a 60kV bushing, two different PD sources have been used and in both cases it was possible to detect PD activity above 40pC. I.
INTRODUCTION
The use of partial discharge (PD) on-line monitoring techniques for determining potential faults within high voltage transformers is of growing interest. Accurate PD detection and location may inform the ‘condition assessment process’ that allows the operator to plan maintenance, repair and replacement strategies [2]. The condition assessment process requires the regular analysis of dissolved gases within samples taken from the transformer oil. Increased levels of hydrogen, methane and acetylene (generated by high energy discharges) will indicate the presence and severity of PD activity [3]. Other detection techniques are required if the location of the PD source needs to be determined. Acoustic sensors placed on the outer tank wall can detect pressure waves generated by the partial discharge process. The acoustic impedance between a PD source and the detection point is complicated as the acoustic wave will propagate along multiple pathways and is distorted by attenuation. Arrays of acoustic sensors have been used to determine PD location [4]. Electrical detection methods have been developed that use vhf/uhf sensors to measure the PD signal higher frequency components. UHF sensors have been successfully applied either at an oil port or placed over a dielectric aperture on a modified tank wall [5]. Work at
1-4244-0333-2/06/$20.00 ©2006 IEEE.
THE ELECTRO-OPTIC MODULATION TECHNIQUE II. The PD on-line monitoring technique is based on the use of a Lithium Niobate (LiNbO3) electro-optic (EO) modulator (Fig. 1). The measurement mechanism uses the measured PD signal and applies it across an optical fiber coupled LiNbO3 waveguide modulator, which modulates the intensity of the transmitted laser light as an approximately linear 1550nm Laser, 10mW output power Laser temperature and current controller 1611 NewFocus Photoreciever
To Digital Oscilloscope
Polarisation Controller
Polarisation Maintaining Fibre EO Modulator
PD Signal
Fig. 1. EO modulator-based transmission of PD signal data
412
function of the voltage applied across it. The optical network supplies polarized laser light via polarization maintaining optical fiber to the LiNbO3 modulator input, and monitors the optical output from the modulator using an optical receiver. The EO modulator is compact and passive requiring no additional power to operate. The laser source, which is controlled by a temperature and current laser diode controller, has a wavelength of 1550 nm and maximal power of 10 mW. A polarization tuner was used to ensure that the input light for the modulator was linearly polarized. The optical receiver has a bandwidth of 1 GHz. Figure 2 shows the relationship between a single pulse from a signal generator applied across the EO modulator and the resultant output from the optical receiver. There is a slight delay between the two signals that have similar rise and fall times. The injected signal contains frequency components in excess of the useful bandwidth of the RFCT. It can be initially assumed that the method of transmission will not significantly alter the PD signal information.
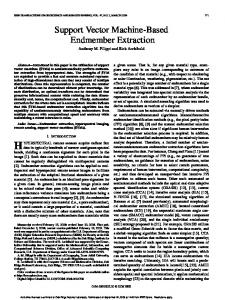
High Voltage
PD source Bushing tap
Input unit
RFCT 20 dB Am EO modulator HV cage Control Area
Optical fibre
Polarised light source
Conventional PD detector
Digital Oscilloscope
Photodiode
PC
Fig. 3. Schematic diagram of the experiment
were also displayed and saved in a computer via an oscilloscope and a GPIB card. A digital oscilloscope, LeCroy LC684DXL with a bandwidth of 1.5GHz, was also used to display, store and analyse the signals from the RFCT/photodiode. Two types of artificial PD source were used to generate PD signals: To represent a potential PD source that would be external to the transformer under test, corona in air PD signals were generated by connecting a rod to the high voltage supply. The rod was suspended, using nylon monofilament to ensure that any earthed surfaces were sufficiently distant so that corona were only generated around negative peak of the applied high voltage ac cycle. The second PD source was representative of internal PD. In this case floating discharge signals were generated by having a plane-plane electrode arrangement immersed in oil. The earth electrode was covered with a 5mm thick Perspex sheet that had a coil of tinned copper wire on its exposed surface. The high voltage electrode was suspended over the Perspex so that there was an oil gap of 10mm
Fig. 2. EO modulator input and photodiode output
III.
THE EXPERIMENT
A simple transformer bushing-tap system for PD measurement has been developed and is used as the experimental model (Fig. 3). A connection from the tap point to ground is wound around the RFCT. The RFCT has a useful measurement bandwidth of 200 MHz. By using three turns on the primary side the measurement gain of the sensor is improved across the whole range of its bandwidth. This measurement system has been used on-site for on-line PD monitoring of power transformers [8]. However, initial experiments with the EO modulator confirmed that the RFCT output signal requires amplification in order to reasonable PD detection sensitivity. Consequently, the output of the RFCT is amplified by 20 dB using a battery powered SA1020A wideband amplifier (20 dB over 0-1 GHz). A Robinson Model 700 conventional PD detector with 40kHz-80kHz band-pass frequency was used to detect and quantify the apparent charge of any PD event. The data
IV.
RESULTS
Corona Discharge Fig.4 shows the analysed results, based on data from the Robinson Detector, measured over 500 continuous power cycles. The applied 50Hz ac voltage had a peak value of 7.1 kV. The corona occurs around the peak of the negative half cycle and has fairly consistent magnitude (around 50pC in this case). Signals from the amplified RFCT and the output of the photodiode were recorded simultaneously and typical results are shown in Fig. 5. Given that the RFCT has
413
a 200MHz useful bandwidth, the sampling rate of the oscilloscope was set to 500MS/s. Recorded individual PD pulses were saved in a file consisting of 5000 data points equivalent to 1µS. The first 2500 points (500ns) of one of the obtained signals are shown in Fig. 5. General observations are that the photodiode signal is noisier, however, the discharge signal can be clearly identified and from comparison with the data from the Robinson detector the complete system would appear to have a measurement sensitivity of approximately 5 pC mV-1. Analysis of the photodiode noise revealed that it contained a low frequency oscillation with a pk-pk value of 8 mV. Effectively in this arrangement the electro-optic modulator circuit can therefore reliably detect discharge events above 40 pC. Floating discharge in oil Fig. 6 shows the ϕ-q-n pattern for floating discharge over 500 continuous power cycles with a peak voltage of 11.7 kV. In this case, there are discharge events across the whole cycle. The average discharge magnitude was 100pC and the peak magnitude 380pC.
Fig. 6. ϕ-q-n patterns for floating discharges in oil, measured over 500 continuous power cycles
A typical result for a PD event with apparent charge of 80 pC is shown in Fig. 7a. Fig. 7b is the related measured signals for a PD with apparent charge of 300 pC.
Fig. 4. Two-dimensional analysis of corona discharge measured over 500 continuous power cycles
(a) Apparent charge 80pC
(b) Apparent charge 300pC Fig. 7. RFCT and photodiode output of floating discharge pulses
Fig. 5. Simultaneous RFCT and photodiode output of a corona pulse
414
contains useful time and frequency information that could be used to determine discharge location.
Again from analysis of the obtained results for the floating discharge in oil PD source it possible to detect discharge events greater than 40pC. There is not a linear relationship between apparent charge and peak magnitude of the measured photodiode output, although larger discharge events do produce a higher peak voltage from the photodiode. V.
Initial results would seem to indicate that if using this approach it may well prove impossible to ‘calibrate’ the discharge magnitude, however it should be possible to estimate the likely severity of a measured discharge event e.g. less than 200 pC, between 150 and 600 pC etc. If it is possible to identify the discharge location and broadly quantify the PD severity then this technique would be a valuable tool to assist with the condition assessment process.
DISCUSSION
In the experimental arrangement described above it is possible to detect both internal and external PD events providing their apparent charge is greater than 40pC. Frequency analysis of measured data is shown in Fig.8. It is clear that the RFCT output for a floating discharge pulse contains higher frequency components than those of the corona discharge and that although attenuated they are present in the photodiode output. Consequently, as with other PD detection systems for power transformers [9] it should be possible to discriminate between internal and external events, using time/frequency information from the photodiode output signal. The results of pulse injection into the EO modulator as shown in Fig. 2, indicate that the transmission system contains inherent delay. Therefore, if several bushing tap points were to be monitored simultaneously identical transmission circuits will be required to ensure that it is possible to determine the measurement point nearest to the PD source. If necessary, the minimum detectable apparent charge level can be addressed through increasing the measurement sensitivity of the RFCT and by using a high pass filter to remove low frequency noise from the photodiode output.
REFERENCES [1] B Han, P L Lewin, Y Tian and P Jarman “Characteristics of high frequency signal propagation within a transformer winding model using transfer function analysis and experimental evaluation” IEE Proc Int Conf on Reliability of Transmission and Distribution Networks, pp99-103, February 2005 [2] R Heywood, J Lapworth, L Hall and Z Richardson “Transformer lifetime performance – managing the risks” IEE Proc Int Conf on Reliability of Transmission and Distribution Networks, pp309-313, February 2005 [3] A C Franklin and D P Franklin The J and P transformer book – a practical technology of the power transformer 11th ed Butterworth and Co Ltd, 1983 [4] S L Jones “The detection of partial discharge activities within power transformers using computer aided acoustic emission techniques” IEEE ISEI, pp106-110. 1990 [5] M D Judd, B M Prior, S C Kelly and B F Hampton “Transformer monitoring using the UHF technique” International Symposium on High Voltage Engineering, Vol 5, pp362-365, August 1999 [6] B Han, P L Lewin, Y Tian, Z D Wang and P Jarman “Measurement of discharge signal propagation within a dry-type transformer model” IEE Proc Int Conf on Reliability of Transmission and Distribution Networks, pp161-165, February 2005 [7] Y Tian, P L Lewin, G Schroeder, J S Wilkinson and S J Sutton “Partial discharge measurements on a 400kV cable joint using optical modulation techniques” IEE Proc Int Conf on Reliability of Transmission and Distribution Networks, pp283-286, February 2005 [8] B. Han, “Partial Discharge Monitoring of Power Transformers” PhD Thesis, University of Southampton, 2004 [9] J Fuhr, “Procedure for Identification and Localization of Dangerous PD Sources in Power Transformers” IEEE Trans DEIS, 12(5), p1005-1114, 2005
Fig. 8 Comparison of frequency spectra for both discharge sources
VI.
CONCLUSION
The potential application of electro-optic modulation techniques for PD monitoring in high voltage transformers has been assessed using a simple laboratory experiment. Initial results reveal that it is possible to detect internal discharge activity above 40pC using a RFCT at the bushing tap point to modulate transmitted laser light via a waveguide modulator. The resulting signal from the photodiode
415