Oct 1, 2008 - This defines a renormalization transformation RâB . For some real networks, such as the WWW, social, metabolic and protein-protein interaction ...
Complex networks renormalization: flows and fixed points Filippo Radicchi,1 Jos´e Javier Ramasco,1 Alain Barrat,1, 2 and Santo Fortunato1
arXiv:0803.3637v2 [physics.soc-ph] 1 Oct 2008
2
1 Complex Systems Lagrange Laboratory (CNLL), ISI Foundation, Torino, Italy Laboratoire de Physique Th´eorique (CNRS UMR 8627), Universit´e de Paris-Sud, France
Recently, it has been claimed that some complex networks are self-similar under a convenient renormalization procedure. We present a general method to study renormalization flows in graphs. We find that the behavior of some variables under renormalization, such as the maximum number of connections of a node, obeys simple scaling laws, characterized by critical exponents. This is true for any class of graphs, from random to scale-free networks, from lattices to hierarchical graphs. Therefore, renormalization flows for graphs are similar as in the renormalization of spin systems. An analysis of classic renormalization for percolation and the Ising model on the lattice confirms this analogy. Critical exponents and scaling functions can be used to classify graphs in universality classes, and to uncover similarities between graphs that are inaccessible to a standard analysis. PACS numbers: 89.75.Hc, 05.45.Df Keywords: Networks, renormalization, fixed points
Generally speaking, an object is self-similar if any part of it, however small, maintains the general properties of the whole object. Self-similarity is a characteristic feature of fractals [1] and it expresses the invariance of a geometrical set under a length-scale transformation. Many complex systems such as the World-Wide-Web (WWW), the Internet, social and biological systems, have a natural representation in terms of graphs, which often display heterogeneous distributions of the number of links per node (the degree k) [2, 3, 4, 5, 6]. These distributions can be described by a power law decay, i.e. are scalefree: they remain invariant under a rescaling of the degree variable, suggesting that suitable transformations of the networks’ structure may leave their statistical properties invariant. Since graphs however are not embedded in Euclidean space, a standard length-scale transformation cannot be performed. The concept of length can only be defined in the graph-theoretical sense of the number of links along any shortest path between two nodes. In this context, Song et al. [7] proposed to transform a network by means of a box-covering technique, in which a box includes nodes such that the distance between each pair of nodes within a box is smaller than a threshold ℓB . After tiling the network, the nodes of each box and their mutual links are replaced by a supernode: supernodes are connected if in the original network there is at least one link between nodes of their corresponding boxes. This defines a renormalization transformation RℓB . For some real networks, such as the WWW, social, metabolic and protein-protein interaction networks, a few iterated applications of this procedure seem to leave their degree distribution invariant, which led to the claim that they are self-similar [7]. Other networks, such as the Internet, are instead found not to be self-similar under RℓB . Iterated applications of RℓB generate renormalization flows in the space of all possible graphs. Studying the behavior of such flows is crucial: the existence of possible fixed points of the transformation would allow to identify
universality classes of networks, much like it happens for second-order phase transitions in statistical physics [8]. This could offer a natural way to classify graphs and uncover unknown similarities. In this paper we perform a systematic study of the renormalization transformation RℓB , its flows and fixed points. We denote a generic graph of N0 nodes and E0 links by G0 and the renormalization transformation by R, for simplicity. A series of t successive transformations R on G0 leads to the graph Gt = Rt (G0 ), with Nt nodes and Et links. Finite size effects are strong especially in heterogeneous networks, where boxes built around large degree nodes (hubs) determine a considerable contraction of the system at each step. Such effects may perturb the analysis of the renormalization flow, which therefore has not been investigated so far. We have devised a general procedure that overcomes this difficulty and allows to study the renormalization flows. Tiling a network means covering it with the minimum number of boxes. We adopted two popular techniques for box covering: the greedy coloring algorithm [9] (GCA) and random burning [10] (RB). GCA is a greedy technique inspired by the mapping of the problem of tiling a network to node-coloring, a well known problem in graph theory [11]. In RB, boxes are spheres of radius rB centered at some seed nodes, so that the maximal distance between any two nodes within a box does not exceed 2rB . The correspondence between the two methods is obtained for ℓB = 2rB + 1. The main results of our analysis appear robust with respect to the particular adopted box covering technique. An important characteristic of a network is its largest degree. We therefore focus on the variable κt = Kt /(Nt − 1), where Kt is the largest degree of graph Gt . As the number of renormalization steps t increases, we study the flows of κt as a function of the relative network size xt = Nt /N0 (N0 is the initial network size). We also study the fluctuations of the variable κt along the flow,
2
= 2
0
κt
-1
10
10
N0 = 1000
-2
10
N0 = 2000 N0 = 5000
-2
10
-2
0
10
N0 = 10000
2
10 1/ν
10
xt N 0
0
10
-4
-4
10
χt N0
χt
-γ/ν
10
-2
10 -4 10
-8
10
-2
10
0
10
1/ν
FM e = 0.5 -1
10
0
κt
10
-1
-2
10
10
-2
10
0
10
4
2
10 1/ν
10
x t N0
-3
-γ/ν
10
χ t N0
2
10
1
-2
10
N0 = 251
10
-4
10
0
10
N0 = 1251
0
2
10
4
1/ν 10
x t N0
N0 = 6251 N0 = 31251
10
-0.45
κ t ~ xt
-1
10
-4
10
-3
10
-2
10
xt
-1
10
0
10
1
10
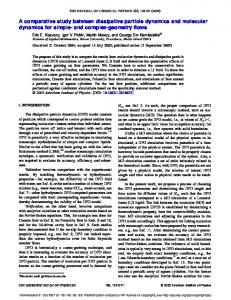
FIG. 2: Study of renormalization flows on self-similar artificial graphs. The box covering was performed with GCA for ℓB = 3. The graph is an FM network with e = 0.5, where e is the probability for hub-hub attraction [13]. ` The figure displays ´ κt = Kt /(Nt − 1) (top), and χt = N0 hκt 2 i − hκt i2 (bottom) as a function of the relative network size xt = Nt /N0 . 1/ν The scaling function of the variable xt N0 for κt and χt is displayed in the insets. The exponent is ν = 1.05(5). The dashed lines indicate the predicted behavior of the scaling function. The scaling function decays with an exponent −(β − 2)/(β − 1) = −0.45. We still find γ = ν (within errors).
0
10
ER
0
10
χt
� expressed by the susceptibility χt = N0 hκt 2 i − hκt i2 ; here the averages, denoted by h·i are taken over various realizations of the covering algorithm. In Fig. 1 we see how the variables evolve for an Erd¨ osR´enyi [12] (ER) graph with average degree hki = 2, which thus contains a giant component and has loops. Such network is not self-similar according to box-covering renormalization [7]. The box covering was carried out with GCA, with ℓB = 3. We find that the functions κt (xt ) 1/ν and χt (xt ) are scaling functions of the variable xt N0 , as indicated by the remarkable data collapse of the insets. The scaling relations hold on a very general ground,
2
10
xt N0
-2
10
xt
0
10
FIG. 1: Study of renormalization flows on non-self-similar artificial graphs. The box covering was performed with GCA for ℓB = 3. After t iterations of the renormalization procedure, the graph Gt has Nt nodes and Et links and its maximal degree is Kt . The graph is an ER network with average degree hki = ´ display κt = Kt /(Nt − 1) (top) and ` 2. The figures χt = N0 hκt 2 i − hκt i2 (bottom) as a function of the relative network size xt = Nt /N0 . The insets display the scaling func1/ν tion of the variable xt N0 for κt and χt . Here ν = 2.0(1) and the susceptibility exponent γ = ν (within errors).
namely for all the box covering procedures investigated, with exponents identifying a narrow set of universality classes. In the case of non-self-similar objects the estimates for the exponent ν are consistent with the value 2. The scaling of the susceptibility curves requires another exponent γ, which controls the divergence of the peaks (see inset of Fig.1, bottom). We obtain γ = ν for all graphs and transformations. In Fig. 2 we study the flows for a class of graphs which are self-similar under box-covering renormalization: the fractal model (FM) introduced by Song et al. [13]. The Fractal Model is self-similar by design, as it is obtained by inverting the renormalization procedure. At each step, a node turns into a star, with a central hub and several nodes with degree one. Nodes of different stars can then be connected in two ways: with probability e one connects the hubs with each other (Mode I), with probability 1 − e a non-hub of a star is connected to a non-hub of the other (Mode II). The resulting network is a tree with power law degree distribution, the exponent of which de-
pends on the probability e. This type of graphs maintain their statistical features under renormalization. Nevertheless, the scaling behavior is the same we have observed for non-self-similar graphs, but with different exponents. In the case of the FM network it is possible to derive the scaling exponent ν, by inverting the construction procedure of the graph. In this way one recovers graphs with identical structure at each renormalization step and one can predict how κt , for instance, varies as the flow progresses. Since we are interested in renormalizing the graph, our process is the time-reverse of the growth described in [13], and is characterized by the following relations Nt−1 = n Nt ,
kt−1 = s kt ,
β =1+
log n , log s
(1)
where n and s are time-independent constants determining the value of the degree distribution exponent β of the network. Here Nt and kt are the number of nodes and a characteristic degree of the network at step t of the renormalization; we choose the maximum degree Kt . The initial network has size N0 and shrinks due to boxcovering transformations. In this case, for the variable κt one obtains � �− β−2 β−1 K 0 Nt K0 � s �−t Kt = = κt ∼ Nt N0 n N0 N0 (2) β−2 K0 − β−2 β−1 − β−1 x ∼ (N0 xt ) , = N0 t where we used s = n1/(β−1) , Nt /N0 = n−t and K0 ∼ 1/(β−1) N0 , derived from Eqs. 1. We see that the scaling
3 0
10
0
κt
10
WS
-1
10
0
10
-2
10
-2
10
-3
N0 = 5000 N0 = 10000
-4
10
10
N0 = 20000
-2
0
10
-4
10
N0 = 50000
2
10
10
1/ν xt N 0
Pt , |m|t
a
0 -γ/ν
-4
10
χt N0
χt
10
-2
10
-8
10
-2
-4
0
10
10
10
2
L0 = 729 -5/48
Pt ~ (xtL0) Ising L0 = 128 L0 = 256 L0 = 512
10
1/ν
-4
-2
0
10
10
xt
|m|t ~ (xtL0)
-1/8
0
10
0
0
2
10
FM e = 0.5
10
10
N0 = 251
-2
10
10
xt L0
-1
κt
L0 = 243
xt N0
10
b
perc. L0 = 81
N0 = 1251 N0 = 6251
-2
-2
0
10
10
N0 = 31251
2
10 1/ν
10
N0 = 156251
xt N 0
2
10
-2
10
-γ/ν
10 -2 10 -4 10 -6 10
χt N0
χt
0
0
10
-2
0
10
10
10
1/ν
2
10
xt N0
-4 -4
10
-2
xt
10
0
10
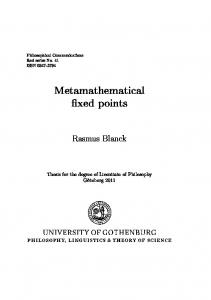
FIG. 3: Effect of a small random perturbation on renormalization flows. The box covering was performed with GCA, with ℓB = 3. a) WS network with hki = 4 and a fraction p = 0.01 of randomly rewired links. b) FM network with e = 0.5 and a fraction p = 0.05 of added links. The ` figures dis-´ play κt = Kt /(Nt −1) (a, b, top), and χt = N0 hκt 2 i − hκt i2 (a, b, bottom) as a function of the relative network size xt = Nt /N0 . We see that the exponents are now very different from the unperturbed case: we recover ν = 2.0(1), as in the case of non-self similar graphs. The relation γ = ν is still satisfied within errors.
exponent ν = 1 is obtained for any value of the exponent β. From Eq. 2 we actually get the full shape of the scaling function, that is a power law: our numerical calculations confirm this prediction. We remark that this holds only because one has used precisely the type of transformation that inverts the growth process of the fractal network. This amounts to applying the GCA with ℓB = 3. Self-similar objects correspond by definition to fixed points of the transformation. To study the nature of these fixed points, we have repeated the analysis of the renormalization flows for the self-similar networks considered, but perturbed by a small amount of randomness, through the addition or rewiring of a small fraction p of links. The results are shown in Fig. 3 for Watts-Strogatz (WS) small-world networks [14] and FM networks. In both cases we recover the behavior observed for non-selfsimilar graphs, with scaling exponents ν = 2.0(1) and 2.0(1), which implies that the original fixed points are unstable with respect to disorder in the connections. To complete our analysis, we have studied the renormaliza-
FIG. 4: Analogues of our scaling plots for real space renormalization in percolation and the Ising model in two dimensions. For percolation we use a triangular lattice, and the renormalization reduces the volume by 1/9 at each step. For Ising we use a square lattice, with a volume contraction factor of 1/4. The relative system size xt now refers to the linear dimension L of the lattices. So, the values of xt are multiples of 1/3 for percolation, of 1/2 for Ising. The plot illustrates the flows obtained starting from the critical value of the control parameter, corresponding to the occupation density p = 0.5 for percolation and the temperature kT = 2.269 for Ising. The two order parameters, the percolation strength (relative size of the percolating cluster) and the magnetization, scale with xt . We recover the well known exponents of percolation and Ising (βp /νp = 5/48, βI /νI = 1/8).
tion flows for many other artificial networks, either selfsimilar or not, such as scale-free networks ´a la Barab´ asiAlbert [15] or generated with linear preferential attachment [16], ER graphs at the threshold for the formation of the giant component (hki = 1), hierarchical and Apollonian networks [17, 18]. In all cases we have found the same scaling behavior for κt and χt . We warn that the values of the exponents may a priori also be affected by the specific transformation adopted, as it happens in real space renormalization for lattice models [8]. Still, we find a coherent picture: non-self-similar graphs are characterized by exponents consistent with ν = 2; self-similar graphs yield different values for ν. The scaling relations we have found are somewhat unusual, as the scaling variable entails the relative system volume xt and not a control parameter. To disclose the meaning of our scaling, we repeated our analysis for two traditional systems of statistical physics: percolation and the Ising model in two dimensions. We have applied real space renormalization to percolation configurations on a triangular lattice, and to Ising configurations on a square lattice. For percolation, a triangular cell is replaced by a supernode, which is occupied if the majority of sites of the cell are occupied, empty otherwise (the procedure is described in [19]). For Ising we have applied a classical
4 majority rule scheme to square cells with four spins. In Fig. 4 we show the relation between the order parameter and xt (which here indicates the contraction in the linear dimension L0 ), for different initial lattice sizes, starting from configurations at the critical point. We observe a clean scaling, just as in network renormalization. The plots are analogues of the standard finite size scaling plots. The order parameter scales as L−β/ν (L being the linear dimension of the lattice) at the critical density, which in our case reads (xt L0 )−β/ν and matches the trend observed in the figure. At variance with finite size scaling, where one always considers configurations of the same system, here the renormalization may bring the system to configurations corresponding to the critical state of other systems in the same universality class, but the scaling holds. We have also repeated the analysis starting from system configurations in the subcritical and supercritical phases, in which cases no scaling is observed. The scaling of Fig. 4 does not give new insight about percolation and Ising, as it just reproduces well known exponents. Standard finite size scaling does the same job, but there one has a control parameter (occupation density, temperature) that allows to identify the state of the system. In the case of networks, the state is represented by the topology of the system and there is no obvious control parameter, so our approach seems the only possibility to extract information about possible critical properties. The scaling for self-similar graphs in Fig. 2 corresponds to the critical scaling of Fig. 4. In conclusion, our results show that renormalization flows in graphs, as defined by the box-covering method, display a clear scaling behavior, opening a new promising research avenue in the field of complex networks, with close contacts to real space renormalization in lattice models. Our analysis uses the well-established finite-size scaling and real space renormalization techniques and could be easily generalized to other possible renormalization schemes. For a full classification of networks in universality classes it seems necessary to explore further the robustness of the critical exponents under renormalization, and to study the flow of other variables, which may deliver new interesting scaling functions and exponents. The analogies we have found with the classic renormalization of percolation and the Ising model on the lattice are intriguing and give more insight to our picture. Finally, an interesting open question concerns the possibility to assign real-world networks to specific universality classes. This is a challenging issue, as for real graphs a finite-size
scaling analysis is not available because of the uniqueness of each sample. A possibility could be to estimate their ”distance” from the self-similar (unstable) fixed points of the transformation. We thank A. Flammini, S. Havlin, V. Loreto, H. A. Makse and A. Vespignani for discussions and feedback on the manuscript. We also thank an anonymous referee for suggesting a closer analysis of the relation between our findings and the standard renormalization of statistical mechanics models.
[1] B. B. Mandelbrot, The Fractal Geometry of Nature, W. H. Freeman, New York, 1982. [2] A.-L. Barab´ asi & R. Albert, Rev. Mod. Phys. 74, 47 (2002). [3] S. N. Dorogovtsev & J. F. F. Mendes, Evolution of Networks: from biological nets to the Internet and WWW, Oxford Univ. Press, Oxford, 2003. [4] M. E. J. Newman, SIAM Rev. 45, 167 (2004). [5] R. Pastor-Satorras & A. Vespignani, Evolution and structure of the Internet: A statistical physics approach Cambridge Univ. Press, Cambridge, 2004. [6] S. Boccaletti, V. Latora, Y. Moreno, M. Chavez & D. U. Hwang, Phys. Rep. 424, 175 (2006). [7] C. Song, S. Havlin & H. A. Makse, Nature 433, 392 (2005). [8] H. E. Stanley, Introduction to Phase Transitions and Critical Phenomena, Oxford University Press, Oxford, 1971. [9] C. Song, L. K. Gallos, S. Havlin & H. A. Makse, J. Stat. Mech. P03006 (2007). [10] K.-I. Goh, G. Salvi, B. Kahng & D. Kim, Phys. Rev. Lett. 96, 018701 (2006). [11] B. Bollob´ as, Modern Graph Theory, Springer Verlag, New York, 1998. [12] P. Erd¨ os & A. R´enyi, Publ. Math. Debrecen 6, 290 (1959). [13] C. Song, S. Havlin & H. A. Makse, Nature Phys. 2, 275 (2006). [14] D. J. Watts & S. H. Strogatz, Nature 393, 440 (1998). [15] A.-L. Barab´ asi & R. Albert, Science 286, 509 (1999). [16] S. N. Dorogovtsev, J. F. F. Mendes & A. N. Samukhin, Phys. Rev. Lett. 85, 4633 (2000). [17] E. Ravasz & A.-L. Barab´ asi, Phys. Rev. E 67, 026112 (2003). [18] J. S. Andrade, H. J. Herrmann, R. F. S. Andrade & L. R. da Silva, Phys. Rev. Lett. 94, 018702 (2005). [19] D. Stauffer, A. Aharony, Introduction to Percolation Theory, Taylor & Francis, London 1994.