(PDF) RDRL HRM AY M BARNES. 2520 HEALY AVE. STE 1172 BLDG 51005. FORT HUACHUCA AZ 85613-7069. 1. ARMY RSCH LABORATORY â HRED.
Complex Systems and Human Performance Modeling by Walter Warwick, Laura Marusich, and Norbou Buchler
ARL-RP-XXX
XXX 2013
A reprint from Proceedings of the Human Factors & Ergonomics Society 2013 Annual Meeting, San Diego, CA, 30 September–4 October 2013.
Approved for public release; distribution is unlimited.
NOTICES Disclaimers The findings in this report are not to be construed as an official Department of the Army position unless so designated by other authorized documents. Citation of manufacturer’s or trade names does not constitute an official endorsement or approval of the use thereof. Destroy this report when it is no longer needed. Do not return it to the originator.
Army Research Laboratory Aberdeen Proving Ground, MD 21005-5425
ARL-RP-XXX
XXX 2013
Complex Systems and Human Performance Modeling Walter Warwick Alion Science and Technology
Laura Marusich and Norbou Buchler Human Research and Engineering Directorate, ARL
A reprint from Proceedings of the Human Factors & Ergonomics Society 2013 Annual Meeting, San Diego, CA, 30 September–4 October 2013.
Approved for public release; distribution is unlimited.
Form Approved OMB No. 0704-0188
REPORT DOCUMENTATION PAGE
Public reporting burden for this collection of information is estimated to average 1 hour per response, including the time for reviewing instructions, searching existing data sources, gathering and maintaining the data needed, and completing and reviewing the collection information. Send comments regarding this burden estimate or any other aspect of this collection of information, including suggestions for reducing the burden, to Department of Defense, Washington Headquarters Services, Directorate for Information Operations and Reports (0704-0188), 1215 Jefferson Davis Highway, Suite 1204, Arlington, VA 22202-4302. Respondents should be aware that notwithstanding any other provision of law, no person shall be subject to any penalty for failing to comply with a collection of information if it does not display a currently valid OMB control number.
PLEASE DO NOT RETURN YOUR FORM TO THE ABOVE ADDRESS. 1. REPORT DATE (DD-MM-YYYY)
2. REPORT TYPE
3. DATES COVERED (From - To)
Reprint
January 2012–November 2013
4. TITLE AND SUBTITLE
5a. CONTRACT NUMBER
Complex Systems and Human Performance Modeling 5b. GRANT NUMBER 5c. PROGRAM ELEMENT NUMBER 6. AUTHOR(S)
5d. PROJECT NUMBER
Walter Warwick,* Laura Marusich, and Norbou Buchler 5e. TASK NUMBER 5f. WORK UNIT NUMBER 7. PERFORMING ORGANIZATION NAME(S) AND ADDRESS(ES)
8. PERFORMING ORGANIZATION REPORT NUMBER
U.S. Army Research Laboratory ATTN: RDRL-HRS-E Aberdeen Proving Ground, MD 21005-5425
ARL-RP-
9. SPONSORING/MONITORING AGENCY NAME(S) AND ADDRESS(ES)
10. SPONSOR/MONITOR'S ACRONYM(S)
11. SPONSOR/MONITOR'S REPORT NUMBER(S) 12. DISTRIBUTION/AVAILABILITY STATEMENT
Approved for public release; distribution is unlimited. 13. SUPPLEMENTARY NOTES *
Alion Science and Technology A reprint from Proceedings of the Human Factors & Ergonomics Society 2013 Annual Meeting, San Diego, CA, 30 September– 4 October 2013. 14. ABSTRACT
The development of a human performance model is an exercise in complexity. Despite this, techniques that are commonplace in the study of complex dynamical systems have yet to find their way into human performance modeler’s toolbox. In this report, we describe our efforts to develop new generative and analytical methods within a task network modeling environment. Specifically, we present task network modeling techniques for generating inter-event times series typical of a complex system. We focus on communication patterns. In addition, we describe the associated analytical techniques needed to verify the time series. Again, while these analytical techniques will be familiar to the complexity scientist, they have significant and largely unrecognized methodological implications for the human performance modeler.
15. SUBJECT TERMS
human performance modeling, network science, C3TRACE, power laws 17. LIMITATION OF ABSTRACT
16. SECURITY CLASSIFICATION OF: a. REPORT
b. ABSTRACT
c. THIS PAGE
Unclassified
Unclassified
Unclassified
UU
18. NUMBER OF PAGES
19a. NAME OF RESPONSIBLE PERSON
Norbou Buchler 19b. TELEPHONE NUMBER (Include area code)
410-278-9403 Standard Form 298 (Rev. 8/98) Prescribed by ANSI Std. Z39.18
COMPLEX SYSTEMS AND HUMAN PERFORMANCE MODELING Walter Warwick Alion Science and Technology Laura Marusich & Norbou Buchler Human Research & Engineering Directorate, US Army Research Laboratory The development of a human performance model is an exercise in complexity. Despite this, techniques that are commonplace in the study of complex dynamical systems have yet to find their way into human performance modeler’s toolbox. In this paper, we describe our efforts to develop new generative and analytical methods within a task network modeling environment. Specifically, we present task network modeling techniques for generating inter-event times series typical of a complex system. We focus on communication patterns. In addition, we describe the associated analytical techniques needed to verify the time series. Again, while these analytical techniques will be familiar to the complexity scientist, they have significant and largely unrecognized methodological implications for the human performance modeler.
INTRODUCTION The development of a human performance model is an exercise in complexity. Whether it is instantiating the various mechanisms that constitute a cognitive architecture or decomposing the work flows and resource constraints that characterize human-system interactions, the modeler confronts the challenge of representing and understanding the myriad interactions that drive human performance in a dynamic environment. Even the modeling tools themselves are instances of complex software systems. Despite this, techniques that are commonplace in the study of complex dynamical systems have yet to find their way into the human performance modeler’s toolbox. In this paper we describe our efforts to implement methods for generating and analyzing the inter-event times series typical of a complex system within a human performance modeling environment. More specifically, we describe how the stochastic priority-based queuing proposed by Barabasi (2005) to account for the heavy-tailed distribution of wait times in human communication patterns can be implemented in a task network modeling tool. Although queues are a basic feature in many task network modeling tools, the representation of Barabasi’s stochastic priority-based queuing is rather more subtle than it might first appear. Nor is it enough simply to represent the functional form of the heavytailed distribution explicitly in the calculation of task times. Rather, our goal to demonstrate how a heavy-tailed distribution of wait times can emerge having re-represented stochastic priority-based queuing as a form of task switching. In this way we reconcile what some might see as the more recondite concepts of the complexity scientist with the more familiar terms of the human performance modeler. Given our goal to generate an emergent time series, it is necessary to implement analytical techniques to identify the functional form of the resulting distribution of wait times. Again, this problem is more subtle than it appears. Clauset, Shalizi and Newman (2009) point out that the common approach of simply displaying linear fits to log-log plots of the distribution is fraught with problems. So, following their lead,
we have implemented general techniques for verifying powerlaw distributions in data (empirical or simulated). Our ultimate goal in this paper is not to argue whether a particular aspect of human performance is best described by, say, a power-law or a stretched exponential or a log-normal distribution (cf. Anderson, 1981; Heathcote, Brown & Mewhort, 2000). Rather, we think it is important to understand the methodological implications should an aspect of human behavior be driven by a power law process. Our most immediate concern has to do with the role of computational modeling in predicting system performance under such a regime. One of the key findings emerging from network science is that the statistics of complex systems are “nonnormal” (West & Grigolini, 2011) while most human performance modeling tools assume some degree of “normality” in the processes they model, if not by design then certainly in their typical application. A model built on draws from normal distributions will fail to account for the extreme behaviors of a system that is, in fact, driven by a power-law process. A more fundamental concern relates to how we should validate models of human performance. While some might view questions about the exact functional form of a distribution as an esoteric exercise in curve fitting, the statistics of complex systems preclude standard measures of fit (and it is for this reason that arguments about the exact functional form of a distribution must be engaged carefully lest they become question begging). Last, but not least, we hope this research will foster stronger connections between human performance modeling and network science—two disciplines that should be tightly linked in principle but that are rarely integrated in practice. TRADITIONAL TASK NETWORK MODELING Task network modeling environments (e.g., IMPRINT, Micro Saint, C3TRACE, etc.) provide a framework for representing complex human-system interaction. The framework is grounded in the notion of a task decomposition in which a complex process is decomposed into component sub-processes, which can be further decomposed until a sequence of tasks can be specified. This approach is visualized
by way of a graphical representation of the process being modeled: a hierarchical set of nodes and edges (i.e., tasks and the flow of control between them). Beneath the graphical representation, a discrete event simulator schedules events and executes whatever additional code the modeler has included at the task level (e.g., code to affect state variables). Both serial and parallel processes can be represented directly (see Figure 5 below). The task is the atomic unit of analysis and, as such, has some basic properties specified by the modeler. Task duration is chief among these properties. By specifying a duration distribution for each task, the modeler provides the stochastic outline for the time series of events that will be simulated at run time.
for roughly 2300 chat communications from 64 officers arrayed across 15 chat rooms engaged in a two-day command and control exercise. (The data and the exercise from which they were collected are described in Foltz, Lavoie, Oberbreckling, & Rosenstein 2008).
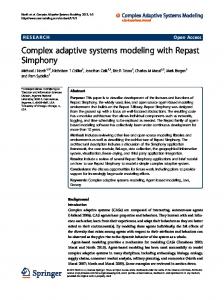
MODELING COMMUNICATIVE BEHAVIOR Barabasi (2010) argues that human communication patterns are “bursty”; that is, the inter-event arrival time between messages tends to follow a power-law distribution, with short intervals between many messages but potentially yawning gaps between others. As Figure 1 shows, there is a marked difference between the range of inter-event arrival times given a power-law process as opposed to a Poisson process.
Figure 1 Inter-event arrival intervals given a process governed by a power law (i.e., a “bursty” process) versus inter-event arrivals given a Poisson process. Barabasi (2005) provides a more detailed depiction of this difference. Barabasi claims that such patterns can be found in both hand-written correspondence (Oliveira & Barabasi, 2005) and email communications (Barabasi, 2005). We have found similar patterns in other data sets. The rank-frequency plot in Figure 2 depicts the distribution of inter-event arrival intervals
Figure 2 Rank-Frequency plot of the inter-chat arrival intervals from the live C2 exercise. The linear plot on the log-log graph suggests a power-law distribution and using techniques we describe later, we have estimated a power-law exponent of ~2.44. Although this exponent differs from the value Barabasi reports (~1 for email exchanges) the overall communication pattern is qualitatively similar to those he describes. Rather than explain away the differences between email and chat communications we will instead focus on how we might recapitulate the general behavior in a task network model. In particular, we are interested in C3TRACE (cf. Plott, 2003), a task network modeling tool that was developed specifically to simulate the flow of information across command and control structures. The flow of information is represented as the exchange of messages of various types (e.g., e-mail, radio, written etc.) among the personnel in the command structure. The arrival of each message initiates the performance of various tasks which, in turn, drive predictions about performance along a variety of dimensions (e.g., time to completion, workload over time, message throughput etc). Clearly, the validity of those predictions depends in large part on correctly simulating the arrival intervals between messages. It is less clear is how to generate the underlying time series given the many degrees of freedom available to the C3TRACE modeler. At the most basic level, the modeler must decide whether the message traffic should be fixed as an input to the model (i.e., as a known sequence of events specified prior to run time) or whether the messages traffic will be generated at run time in response to other dynamics represented in the model. While the first approach can be used to replicate a given time series (and, hence, replicate the exact inter-message arrival intervals), it does so by eliminating one of the most interesting source of variability in the model— namely the changing dynamics of the information flow. But if the modeler is to treat the information flow as an outcome of the model (rather than as an input) then the question becomes one of representing the right dynamics.
In our first attempt to model the live exercise that produced the chat data above, we hoped that the structural complexity of the command and control cell—64 operators in a many-to-many mapping to 15 chat rooms—would induce the “bursty” communication patterns. By representing the individual operators, each with a unique probability of replying to an incoming chat message, we expected that over time cascades of chat messages would emerge separated by long quiescent periods. While the model did just that, as Figure 3 shows, the rank-frequency plot of the simulated intermessage arrival intervals (shown in Figure 4) did not closely resemble the empirical data.
“queuing process” in which the human must continually decide which message to respond to next. The idea is that the human associates a priority with each message and, given a choice among messages on a to-do list, will likely respond to the highest priority message first. In fact, these complex dynamics will be present even if the human must only decide between answering a given message and doing something (i.e., anything) else (Vazquez, 2005). This minimal, two-task case is useful to the task network modeler insofar as it provides a template for representing dynamics where the salient inter-event intervals are task-based rather than queue-based. (In fact, it is not easy to represent a queue in which the priority-based sorting must be conditioned by a probabilistic threshold.) In the context of C3TRACE, this means we can generalize beyond the basic functionality of its priority-based message queues to represent a very generic and easily extensible priority-based task switching. Figure 5 depicts the task network diagram of a single operator’s priority-based selection between two tasks.
Figure 3 A C3TRACE simulation of inter-message arrival intervals. The graph depicts the time between consecutive messages.
Figure 5 A generic two-task instantiation of Barabasi’s Priority List model in C3TRACE.
Figure 4 Rank-frequency plot of the inter-chat arrival intervals. The majority of the simulated inter-chat arrival intervals are well below a second and below the one-second resolution of the empirical data. We have not plotted the intervals of less than one second here. It was clear that simply recapitulating the structure of the chat rooms would not by itself engender power law behavior. Similarly, changing the mean task times and their variability did nothing to change the shape of the interval distribution. In short, the complexity of the model itself was not enough to simulate the complex dynamics of communicative behavior. For this reason, we returned to the literature to identify a more fundamental mechanism. Barabasi (2005) suggests that human communications patterns might be caused by a
There are two important features of the model: First, each instance of the two tasks (“A” and “B”) is initially assigned a real-valued priority between zero and one and a new priority is assigned only after a task has been executed. Thus a task with low-priority value is likely to result in a relatively longer wait time while multiple instances of the tasks with higher priorities are processed. Second, there is a threshold value, independent of the priority value, that determines whether the higher-priority task will, in fact, be executed. A threshold value of one entails that highest priority task is always done first while a threshold value of zero entails random selection between the two tasks. As the rank-frequency plots in Figure 6 show, varying the threshold between these two extremes changes the likelihood of encountering extremely long wait times (even as the relative proportion of short wait times increases).
Figure 6 Rank-frequency plots of the wait times in the two-task
model given different threshold values. The plots mirror those of Vazquez (2005). The two task model above supports a straightforward extension to any fixed number of tasks and, unlike a queuebased representation, does not depend on the representation of additional constraints to ensure that the queue remains exactly saturated to engender the right dynamics (Barabasi, 2005). The decision whether to represent human communicative behavior directly by way of a priority-based queue or more abstractly by way of priority-based task switching will depend on the preferences of the modeler, but the ability to generalize the task-switching approach to other human behaviors weighs in favor of the task-based approach. VALIDATING BEHAVIOR While it remains an open question whether “retro-fitting” a complex model with the simpler task-switching approach just described will produce the right kinds of communication patterns, there is a more pressing concern. Namely, how do we determine if the underlying process is truly governed by a power law and, if so, how do we to identify the form of the power law distribution. Clauset, Shalizi and Newman (2009) have argued that despite its widespread use, identifying and fitting power-law behavior on the basis of least squares regression on log-log plots is fraught with problems. Instead, they argue that power law exponents should be derived using a maximum likelihood estimator (MLE) before a confidence interval is calculated indicating how likely it is that the data would be better fit by a “random” power-law process. Estimating the smallest value (we refer to this as “x_min” below) for which a power law distribution holds is the first step in estimating the scaling index (i.e., the exponent) for the power law. Clauset et al. (2009) describe an iterative process for estimating that value. Each iteration starts with an estimate of x_min which is used to compute the complementary cumulative distribution function (CCDF) of the empirical data. The CCDF is determined by sorting the values from greatest to least and then simply computing the (complementary) percentile rank of each data point by dividing its rank in the sorted list by the total number of data points greater or equal to the estimated x_min value. We then estimate the scaling
index of the empirical data given our initial estimate of x_min using the MLE techniques (Newman, 2005; Clauset et al., 2009). Next, using the estimates for both x_min and scaling index, we compute the “theoretical” CCDF given the analytical solutions provided by Newman (2005). Finally, we determine the “distance” between these two CCDFs using the Kolmogorov-Smirnov (KS) statistic. In our cases, this distance is simply the greatest difference between percentile values of the empirical and theoretical CCDFs. The process repeats with each change in our estimate of x_min with the best estimate being the one that gives the lowest value (i.e., the least greatest value) for the KS-statistic. Clauset et al. (2009) also describe a method for generating a p-value for a power law fit to the data. The basic idea is to compare the fit of the empirical data to the fit that would be obtained with a true power law distribution, using the same MLE techniques. More precisely, using the values for x_min and scaling index estimated from the power-law fit to the empirical data, we generate a synthetic set of data of the same size as the empirical data set. The values less than x_min are sampled directly from the same region in the empirical data. The values greater than x_min are generated using the estimated scaling index and the transformation method (Newman, 2005). This produces a synthetic data set with a true power law distribution above x_min and a distribution that differs from the power law in the exact way that the empirical data does below x_min. We repeat this process, generating many synthetic data sets and fitting a power law to each one, using the same MLE techniques described previously. If the empirical data set is plausibly power law in the region above x_min, then its KS-statistics should be in the same mix as those of the synthetic data sets. If the KS-distance is much larger than the range of synthetic KS-distances (i.e., its value falls in the tails), this indicates that the power law is not a good match to the empirical data. The proportion of synthetic data sets with KS-distances greater than that of the empirical data is the p-value. The lower the p-value, the less plausible it is that the empirical data are well-described by a power law. Higher p-values (above 0.1) mean a power law is fairly plausible. So, for example, looking at the empirical chat data, we estimate an x_min of 84 seconds and power-law exponent of ~2.46 and a p-value of .65. Moreover, a similar fitting process to an exponential distribution yields a p-value of 0. Not only does this give us some reason to believe that the empirical chat data are the product of a power-law process, it also suggests a new approach for validating simulation data. Namely, assuming we have some confidence that both the empirical and simulated data are the result of power-law processes, we then simply compare the minimum values and power-law exponents.
CONCLUSIONS Having implemented the methods advocated by Clauset et al. in C3TRACE, we have grown more confident that the human communication data discussed above are, in fact, the result of a power-law process, but this experience has taught
us several important lessons. (Our initial estimates of an x_min of 84 seconds and power-law exponent of ~2.46 produce a p-value of .65. Moreover, a similar fitting process to an exponential distribution yields a p-value of 0. While this suggests that a power-law fit is plausible, these results are only preliminary and a more thorough-going analysis is needed.) First, even the most seemingly basic dynamics of human performance in an organizational structure are likely to reveal “non-normal” statistics. But these are exactly the kinds of dependent measures we need to represent faithfully if our simulations of behaviors are to provide any insight into complex domains. For example, message throughput is one of the most basic measures we predict in a C3TRACE model so it is critical that we capture the “bursty” dynamics if that measure is to provide us insight into a communication flow. Second, these dynamics will resist the common representations we employ in our human performance modeling tools. It is easy to assume that a complex model (i.e., a model with many interacting operators and tasks) will yield accordingly complex dynamics. In our experience this wasn’t the case. In fact, we are currently moving in the opposite direction by searching for “minimal models” capable of producing complex dynamics. The task switching model described previously is just one example. We have also explored the generation of so-called “fractal” series from simple task network models where task times are the calculated by way of a moving average of past task times rather than the result of independent random draws. A single task model can thus generate a time series in which the standard deviation of inter-event intervals is positively correlated with the sample size of events (cf. Bassingthwaighte, Liebovitch & West, 1994). Clearly, the behavior engendered from even a simple model can be quite subtle and will often call for analytical techniques not usually considered by the human performance modeler. We view the work described above as progress toward these challenges. More than just one-off modeling and analysis efforts, we hope that the work we’ve described can be used as working examples for other human performance modelers trying to represent complex dynamics in task networks models. We also hope that the few points of contact we have identified in the network science literature point will serve as useful entry points for other human performance modelers. But more than that, working these issues has given us new perspective on some of the (occasionally bitter) debates regarding the status of power-law behaviors in cognitive science (cf. Heathcote, Brown & Mewhort, 2000). Rather than argue whether “the one true law” of cognitive science is worthy of the title, we now take a more agnostic view. If we are willing to countenance the mere possibility that some of the behaviors of complex systems (including cognitive systems) are governed by power-laws we must recognize that extreme events (e.g., extremely long wait times between messages) are far more likely in the context of complex dynamical systems than they are in systems that are characterized by “normal” statistics (West & Grigolini, 2011). Insofar as we rely on modeling and simulation to help us understand the bounds of performance, we are likely to develop overly optimistic predictions of system performance.
Acknowledging the possibility of power law behaviors in human performance also has serious methodological implications. As Newman (2005) points out, when dealing with a process governed by sufficiently low power law exponents (like those claimed for many human behaviors), repeated measurements of that process will have neither a convergent mean nor variance. For this reason, standard measures of goodness of fit (e.g., RMSE, r 2) are simply nonstarters for measures of model fit. Thus we will need new tools and techniques for validating whatever predictions we do make about the behavior of complex dynamical systems. Finally, although we have emphasized the influence of network science on our thinking about human performance modeling, the role of human performance modeling in network science is no less important. Indeed, no matter how powerful the statistical machinery might be, the network scientist still needs an anchor in an understandable account of human behavior; it is not enough to abstract the human away as a “particle” in a Hamiltonian system, or as the “server” for a priority-based queue. What is needed is a level of description in which detailed aspects of human performance can be reconciled with the statistics of complex dynamical behaviors. We would like to see our current efforts as a first step in that direction. REFERENCES Barabási, A.-L. (2005). The origin of bursts and heavy tails in human dynamics. Nature, 435, 207-211. Barabási, A.-L. (2010). Bursts: The hidden pattern behind everything we do. New York: Dutton. Clauset, A., Shalizi, C. R., & Newman, M. E. J. (2009). Power-law distributions in empirical data. SIAM Review, 51, 661-703. Foltz, P. W. Lavoie, N., Oberbreckling, R. & Rosenstein, M. (2008). Automated performance assessment of teams in virtual environments. In D. Schmorrow, J. Cohn & D. Nicholson, (Eds.), The PSI handbook of virtual environments for training and education: Developments for the military and beyond. Westport, CT: Praeger Security International. Heathcote, A., Brown, S., & Mewhort, D. J. K. (2000). The power law repealed: The case for an exponential law of practice. Psychonomic Bulletin & Review, 7, 185-207. Newman, M. E. J. (2005). Power laws, Pareto distributions and Zipf's law. Contemporary Physics, 46, 323-351. Oliveira, J. G., & Barabási, A.-L. (2005). Darwin and Einstein correspondence patterns. Nature, 427, 1251. Plott, B. (2003). Software user’s manual for Command, Control and Communication – Techniques for Reliable Assessment of Concept Execution (C3TRACE), v. 2. Boulder: Micro Analysis & Design, Inc. Vazquez, A. (2005). Exact results for the Barabási model of human dynamics. Physical Review Letters, 95, 248701. West, B. J., & Scafetta, N. (2010). Disrupted networks: from physics to climate change. New Jersey: World Scientific. West, B. J., & Grigolini, P. (2011). Complex webs: Anticipating the improbable. Cambridge: Cambridge University Press.
NO. OF COPIES ORGANIZATION 1 DEFENSE TECHNICAL (PDF) INFORMATION CTR DTIC OCA 1 DIRECTOR (PDF) US ARMY RESEARCH LAB IMAL HRA 1 DIRECTOR (PDF) US ARMY RESEARCH LAB RDRL CIO LL 1 GOVT PRINTG OFC (PDF) A MALHOTRA 1 ARMY RSCH LABORATORY – HRED (PDF) RDRL HRM C A DAVISON 320 MANSCEN LOOP STE 115 FORT LEONARD WOOD MO 65473 1 ARMY RSCH LABORATORY – HRED (PDF) RDRL HRM D T DAVIS BLDG 5400 RM C242 REDSTONE ARSENAL AL 35898-7290 1 ARMY RSCH LABORATORY – HRED (PDF) RDRL HRS EA DR V J RICE BLDG 4011 RM 217 1750 GREELEY RD FORT SAM HOUSTON TX 78234-5002 1 ARMY RSCH LABORATORY – HRED (PDF) RDRL HRM DG J RUBINSTEIN BLDG 333 PICATINNY ARSENAL NJ 07806-5000 1 ARMY RSCH LABORATORY – HRED (PDF) ARMC FIELD ELEMENT RDRL HRM CH C BURNS THIRD AVE BLDG 1467B RM 336 FORT KNOX KY 40121 1 ARMY RSCH LABORATORY – HRED (PDF) AWC FIELD ELEMENT RDRL HRM DJ D DURBIN BLDG 4506 (DCD) RM 107 FORT RUCKER AL 36362-5000 1 ARMY RSCH LABORATORY – HRED (PDF) RDRL HRM CK J REINHART 10125 KINGMAN RD BLDG 317 FORT BELVOIR VA 22060-5828
NO. OF COPIES ORGANIZATION 1 ARMY RSCH LABORATORY – HRED (PDF) RDRL HRM AY M BARNES 2520 HEALY AVE STE 1172 BLDG 51005 FORT HUACHUCA AZ 85613-7069 1 ARMY RSCH LABORATORY – HRED (PDF) RDRL HRM AP D UNGVARSKY POPE HALL BLDG 470 BCBL 806 HARRISON DR FORT LEAVENWORTH KS 66027-2302 1 ARMY RSCH LABORATORY – HRED (PDF) RDRL HRM AT J CHEN 12423 RESEARCH PKWY ORLANDO FL 32826-3276 1 ARMY RSCH LABORATORY – HRED (PDF) RDRL HRM AT C KORTENHAUS 12350 RESEARCH PKWY ORLANDO FL 32826-3276 1 (PDF)
ARMY RSCH LABORATORY – HRED RDRL HRM CU B LUTAS-SPENCER 6501 E 11 MILE RD MS 284 BLDG 200A 2ND FL RM 2104 WARREN MI 48397-5000
1 ARMY RSCH LABORATORY – HRED (PDF) FIRES CTR OF EXCELLENCE FIELD ELEMENT RDRL HRM AF C HERNANDEZ 3040 NW AUSTIN RD RM 221 FORT SILL OK 73503-9043 1 ARMY RSCH LABORATORY – HRED (PDF) RDRL HRM AV W CULBERTSON 91012 STATION AVE FORT HOOD TX 76544-5073 1 ARMY RSCH LABORATORY – HRED (PDF) HUMAN RSRCH AND ENGRNG DIRCTRT MCOE FIELD ELEMENT RDRL HRM DW C CARSTENS 6450 WAY ST BLDG 2839 RM 310 FORT BENNING GA 31905-5400 1 ARMY RSCH LABORATORY – HRED (PDF) RDRL HRM DE A MARES 1733 PLEASONTON RD BOX 3 FORT BLISS TX 79916-6816
NO. OF COPIES ORGANIZATION 8 ARMY RSCH LABORATORY – HRED (PDF) SIMULATION & TRAINING TECHNOLOGY CENTER RDRL HRT COL M CLARKE RDRL HRT I MARTINEZ RDRL HRT T R SOTTILARE RDRL HRT B N FINKELSTEIN RDRL HRT G A RODRIGUEZ RDRL HRT I J HART RDRL HRT M C METEVIER RDRL HRT S B PETTIT 12423 RESEARCH PARKWAY ORLANDO FL 32826 1 ARMY RSCH LABORATORY – HRED (PDF) HQ USASOC RDRL HRM CN R SPENCER BLDG E2929 DESERT STORM DRIVE FORT BRAGG NC 28310 1 ARMY G1 (PDF) DAPE MR B KNAPP 300 ARMY PENTAGON RM 2C489 WASHINGTON DC 20310-0300
ABERDEEN PROVING GROUND 15 DIR USARL (PDF) RDRL HR L ALLENDER P FRANASZCZUK C COSENZO RDRL HRM P SAVAGE-KNEPSHIELD RDRL HRM AL C PAULILLO RDRL HRM B C SAMMS RDRL HRM C L GARRETT RDRL HRS J LOCKETT RDRL HRS B M LAFIANDRA RDRL HRS C K MCDOWELL RDRL HRS D B AMREIN RDRL HRS E N BUCHLER D HEADLEY L MARUSICH W WARWICK
INTENTIONALLY LEFT BLANK.