Available online at www.sciencedirect.com
Electric Power Systems Research 78 (2008) 1047–1052
Compression of power quality event data using 2D representation ¨ Omer Nezih Gerek, Dog˜an G¨okhan Ece ∗ Anadolu University, School of Engineering and Architecture, Electrical and Electronics Engineering Department, Eskisehir, Turkey Received 12 July 2006; received in revised form 10 April 2007; accepted 10 August 2007 Available online 27 September 2007
Abstract This paper introduces the energy compaction efficiency of a novel two-dimensional (2D) representation for compression of recorded power quality event data. The 2D representation enables to exploit redundancy across vertical samples that correspond to samples which are far from each other in time. In one-dimension (1D), compression algorithms are unable to depict the correlation between such far away samples. However, the 2D representation renders statistically related far away samples near to each other in the vertical dimension, hence several transform domain techniques are able to compress such rendered data efficiently. In this paper, using real life sampled power quality event data, wavelet transform energy compaction efficiencies are compared through a basis restriction error analysis and the results are justified by simple and commercially available 1D and 2D wavelet based coders. The preliminary results indicate that the 2D representation provides a significant energy compaction efficiency. © 2007 Elsevier B.V. All rights reserved. Keywords: 2D representation; Power quality; Data compression; Two-dimensional discrete-time wavelet transform
1. Introduction The post-event processing and storage of power quality (PQ) data constitutes an important aspect due to the need for engineering design and implementation of mitigation devices which eliminates the undesired effects of PQ problems. The processing normally consists of feature extraction for detection, localization, and classification of PQ events. Once an event is detected in a portion of the acquired data, storage of this portion for further analysis and logging purposes is becoming an important compression application. For example, when we consider capturing a PQ event at 20 kHz to keep even minutiae details, a 10 s recording would produce 2,00,000 samples, requiring at least 800 KB of disk space. This implies a dramatic need of compression of the data in terms of storage. The need for compression is even more pronounced when data communication applications are required. Several methods using wavelet and wavelet packet transforms have been developed for the compression of PQ data [1–4]. In [1] and [2], compression results are presented by thresholding wavelet transform coefficients and reconstructing the signal using significant coefficients. Using same transform thre-
∗
Corresponding author. Tel.: +90 222 321 3550; fax: +90 222 323 9501. E-mail address:
[email protected] (D.G. Ece).
0378-7796/$ – see front matter © 2007 Elsevier B.V. All rights reserved. doi:10.1016/j.epsr.2007.08.006
sholding techniques, variations of the wavelets, such as slantlets are used in [3]. In [4,7] minimum description length criterion (MDL) is used for compressing with wavelet packets. Use of and results from practically available codecs, either in one dimension (1D) or two dimensions (2D), for the compression and storage of the PQ data is not encountered in the literature. In this paper, compression results using a new 2D representation of the PQ data introduced in [5,6] are presented. It is observed that this representation enables both high compression ratios and efficient event analysis as compared to methods using the recorded data in one dimension. In [6], it was observed that PQ event analysis is more efficient using the 2D representation. In this work, it is illustrated that the 2D representation is also very suitable for the compression, storage, and visualization of the recorded PQ event data. To test the compression performance, voltage waveforms of real life power quality events captured at 20 kHz from an experimental system consisting of a three-phase wye-connected 380 V, 50 Hz, 25 kVA, 5-wire supply loaded with RL load banks and three-phase induction motors coupled with varying mechanical loads. System also includes adjustable speed drives controlling the induction motors for studying load generated harmonics. In Section 2, representation of the PQ event data in 2D is briefly described. In Section 3, the compression performance comparisons of 1D and 2D representations are provided using thresholding wavelet coefficients.
1048
¨ O.N. Gerek, D.G. Ece / Electric Power Systems Research 78 (2008) 1047–1052
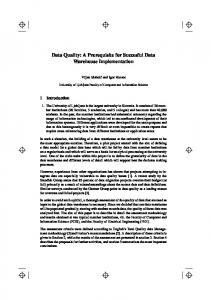
Fig. 1. 2D matrix (or image) generation from 1D data.
It is observed that using the same number of retained wavelet coefficients, the error introduced to the 2D representation is significantly less than the error in 1D due to better energy compaction property of the 2D representation. In Section 4, the compression ability of the new representation is illustrated using commonly used and freely available 1D (audio) and 2D (image) coders. Again, the compression results using the proposed 2D representation outperform the 1D compression results.
events are also apparent. Very long sequences are normally hard to visualize in 1D due to the aliasing in the finite resolution plots, and such visualizations hide several PQ events such as short durational arcing faults, and small changes in voltage waveform magnitude. The third advantage of the 2D representation is its ability to provide efficient data compression via exploitation of better correlation, which is explicitly presented in this work. In [6], 2D discrete wavelet transform (DWT) was proposed as an analysis tool for the detection of PQ events from the 2D representation. This transform also exploits the compression benefits of the 2D representation as described in Section 3. Therefore, there is a possibility that PQ event detection and classification can be performed directly inside the wavelet coded data without full decompression. In of Section 3, wavelet shrinkage analysis over the 1D and 2D data corresponding to the same waveform is done. In all of the experiments, long data recordings are used, so that proportional 2D images could be obtained in the 2D representation. Specifically, the PQ event data are recorded at lengths of 8,00,000, which are sampled at 20 kHz so that 1000 × 800 images are obtained whose widths correspond to two cycles of 50 Hz. The wavelet compression results in Section 3 were compared between the 1D and 2D DWT domains with equal numbers of approximation and detail coefficients. The compression comparisons were carried out over sets of 60 PQ event recordings
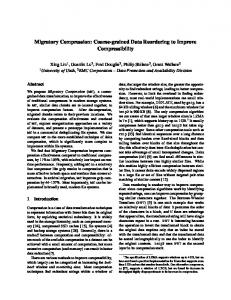
2. 2D representation of PQ event data The 2D representation introduced in [5] consists of a 2D matrix whose rows correspond to non-overlapping segments of the power transient data. In this way, the data can be considered as an image or a 2D surface. The time segments are placed in the rows that have a duration of an integer multiple of the data period. In this way, the cyclo-stationary behavior is exploited well, and the image surface resembles 2D waves, as illustrated in Fig. 1. An image generated from a real life transient using the surface plot is presented in Fig. 2(a). The grayscale image corresponding to the same data is shown in Fig. 2(b). Normally, the voltage waveform is perfectly periodic, therefore the resultant 2D image has very small or no variation along the vertical direction. Furthermore, if the sampling frequency is high, the horizontal variation is also smooth. These attributes directly imply effective image compression methods because many state of the art image compression algorithms perform well for images with slow variations. The 2D representation of the recorded event data has several advantages. The first advantage is its ability to detect and classify (1) events of voltage sags with smooth variations (2) interharmonics, and (3) very small deviations from the fundamental frequency, which are difficult to observe using the 1D representation. The second advantage of the 2D representation is that it provides a way of compactly visualizing very long segments of acquired data at once. In this visualization, the PQ
Fig. 2. 2D matrix generated from an example real life transient: (a) in surface form, (b) in grayscale.
¨ O.N. Gerek, D.G. Ece / Electric Power Systems Research 78 (2008) 1047–1052
1049
corresponding to arcing faults, voltage sags, and interharmonics that are obtained using our experimental system. 3. Compression of PQ event data in 1D and 2D The basic idea of compression is to exploit the redundancy of the representation by eliminating or merging unnecessary components from the data or its transform. Redundancy is usually measured in terms of correlations between samples of data. Inter-signal correlations in 2D consist of neighboring 1D samples (e.g. Rx (n, n − 1), Rx (n, n − 2), etc.) as well as corresponding samples in consecutive cycles (e.g. Rx (n, n − kT − 1), Rx (n, n − kT − 2), etc.). These samples correspond to vertical neighboring pixels in the 2D image, which are not apparent in 1D representation. When the 1D data exhibits a cyclic behavior, the vertically neighboring samples have a strong correlation. Therefore, the advantage of the 2D representation is motivated by the cyclic behavior under normal operation conditions. The compression algorithm efficiency is mostly determined by either transform domain decorrelation, or by prediction of repeating patterns within the signal. The DWT is known to perform best for the transform decorrelation of both 1D and 2D data [9–11]. Therefore, the DWT compression efficiency is first tested via theoretical wavelet shrinkage. The other methods depending on the repetitive pattern search (such as statistical or dictionary based entropy coders and predictive coders) do not have theoretical performance approximations. Therefore, the only choice to present the compression performances of such coders is to give real life experimental results as provided in the next section. Although theoretical performance approximations cannot be provided for such non-wavelet coders, the reason of obtaining high efficiency in the 2D as compared to the 1D representation can be explained by the fact that, if patterns of length N can be matched as a pattern in 1D waveform data, the 2D search can find patterns of N × M within the 2D data which greatly improves the performance of statistical coders. For predictive coders, the 2D predictions can utilize pixels from above image lines as well as pixels from the same line. This significantly improves the correlation to obtain better predictions as compared to using the data from only the same line, which corresponds to 1D process. In this section, we present theoretical results of wavelet shrinkage performances for both 1D and 2D versions of the recorded PQ data. Previously, only the 1D DWT results were presented in the literature [1–4]. Most of the works considered variations in the type of wavelet, quantization, and the entropy coder. For instance, in [4,7], the effect of quantization adaptation via MDL was analyzed, and it was observed that the achieved MSE is on the order of 20 to 30 dB around 1 bit/sample. 1D Wavelet zerotree coders are reported to achieve 1.5 bit/sample in [8]. Shannon-Huffman type entropy coders, on the other hand, are reported to achieve compression ratios around 2–4, corresponding to 2–6 bit/sample in the same work. In our tests, it was observed that the choice of the wavelet and the entropy coder does not have a significant role in the compression performance. On the other hand, the 2D representation dramatically improves the compression efficiency. As an illustration, the wavelet shrin-
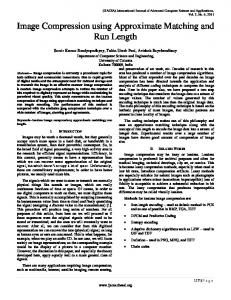
Fig. 3. Reconstruction SNRs of 1D and 2D-DWT decomposition at CR = 2:1 to 32:1 of data containing voltage sag.
kage estimate of the 1D-DWT is around 48 dB, whereas the 2D-DWT yields an average of 54 dB for the same bitrate of 1.5 bit /sample performed with wavelets including various orders of daubechies (from 2 to 12), coiflets, symlets, and biorthogonal daubechies (5/3 and 9/5) Fig. 3, indicating a clear advantage of the 2D representation. Since the selection of the wavelet does not affect the performance more than 1 dB, the 1D and 2D coding results are presented as averages of compressions using above mentioned wavelets. In the reported experiments, conventional wavelet thresholding and basis restriction error measurement methods are used as the shrinkage method for testing the energy compaction efficiency of the 2D representation. First, the wavelet transform is applied, then transform coefficients are thresholded in a way that small magnitudes are discarded by setting them to zero. The reconstructed waveform is obtained by the inverse transform of the thresholded data. In this standard test, there is no quantization or real compression using entropy based techniques. It is only used for testing the energy compaction efficiency of the representation and the transformation which indicates whether the technique is practically promising, or not. The distortion between the original and the reconstructed data is measured for several threshold values corresponding to different number of thresholded samples. The distortion of the reconstructed data corresponds to the basis restriction error using zonal sampling [12]. The number of retained (non-thresholded) samples can be considered as the amount of the represented data. Therefore, the ratio of the whole number of samples of the original waveform to this reduced amount is classically considered as the experimental compression ratio (CR). In order to normalize for the attenuation factors, the distortion results are presented in dB signal-to-noise ratio (SNR) in Fig. 3. To achieve the same amount of approximation and detail coefficients, 3-level 2D-DWT decomposition is used for the 2D data and 6-level 1D-DWT decomposition is used for the 1D data. Thus, a ratio = 1/64 is obtained for approximation coefficients. It can be seen that, especially at high compression ratios, the SNR improvement of the 2D-DWT
1050
¨ O.N. Gerek, D.G. Ece / Electric Power Systems Research 78 (2008) 1047–1052
exceeds 15 dB. Similar SNR improvements are observed for all of the 60 sets of acquired waveforms containing various PQ events. The significance of the SNR value is its effect on the diagnosis of the PQ event. The performance of the lossy compression of PQ data can only be evaluated using the SNR values. The selected compression method and the bitrate must preserve the properties of the PQ event waveform for correct detection and classification. Low SNR values actually cause severe effects on the waveform properties in terms of adding superfluous frequency components. Experimentally, it is observed that SNR values below 40 dB are not practical in terms of storage and further analysis since they effect the waveform characteristics. This level of SNR is never encountered in the 2D-DWT case at reasonable experimental compression ratios up to 64:1. However, 40 dB of SNR is easily reached by the 1D-DWT at ratios around 15:1. This property makes the 1D compression impractical at compression ratios higher than 15:1 for PQ event waveform storage and further analysis. The above analysis compares the 1D and 2D compression efficiency via DWT shrinkage. This is due to the fact that DWT is a popular transform incorporated in commonly used signal encoders. Therefore, this analysis directly provides preliminary results about the compression efficiency of the proposed 2D representation. In order to further explore the efficiency of the 2D representation, several practical and commercially available coders, which are not necessarily based on DWT, are also tested with 1D and 2D data. The results for those practical coders that are presented in the next section agree with the analysis carried out using only DWT for 1D and 2D representations. As an observation, a pronounced compression difference in favor of 2D representation remains regardless of the encoder used. 4. Practical compression results In order to justify the energy compaction efficiency of 2D representation as compared to the classical 1D PQ data representation, practical compression tests using available 1D and 2D coders are conducted. The coders use data redundancy elimination in various ways. Some of the commercially available coders utilize DWT, therefore their compression performances are expected to be comparable to the thresholded DWT analysis performed above for 1D and 2D cases in a way that 2D coders outperform 1D coders. This is due to the fact that commercially available coders also use thresholding for the DWT samples. Therefore, the above analysis results would agree with the practical results presented here. On the other hand, DWT is not the sole compression technique used for 1D and 2D signals. As a result, in order to fully compare the efficiencies of the 1D and 2D representations, we conduct practical compression experiments with DWT based 1D and 2D coders as well as various types of other coders that do not utilize DWT. Among practical 1D coders, wavelet and subband coding based encoders are tested through MP3, OptimFROG, and VoggORBIS [13]. For the 2D case, the wavelet type coders are selected as various Wavelet Zerotree coders (with several types of wavelet filter banks and wavelet tree bitplane partitioning systems) including SPIHT and
JPEG2000. The selected MP3 coder is the PowerPack Lame MPEG layer 3 audio coder [14]. OptimFROG is a data coder which searches for repeating patterns in audio-like waveforms. VoggORBIS [16] is another subband-type and popular audio compressor implemented by Xiph. For the completeness of the tests, non-wavelet coders and pure lossless compressors are also tested. For the 1D case, the encoders are selected as LZP, PPM, TTAEnc, FLAC, RungAE, G723, and ZIP all of which can be found in [15]. Among these coders, TTAEnc, G723, and FLAC are waveform coders, and others are general purpose data compression utilities. Specifically, TTAEnc was initially developed for radio telescope waveform data compression which proved to perform well for audio data, as well. G723 codecs were trial versions of commercially available coders that had shareware options. FLAC stands for Free Lossless Audio Codec which was particularly developed for very high fidelity audio compression. For the 2D case, the non-wavelet and/or lossless coders are selected as JPEG, SPIHT-lossless, JPEG-LS and JPEG2000-LS [18]. JPEG is the most popular lossy coder which utilizes 2D-DCT. SPIHT and JPEG2000 achieves lossless coding using 2D-DWT, whereas JPEG-LS uses a 2D predictive coder (namely LOCO-I) for the lossless compression of images [17,19]. Although the mentioned coders are easily encountered and used in multimedia software, they all utilize complicated and state-of-the-art signal processing and entropy techniques. Descriptions of these techniques can be reached from the provided references. The selected 1D coders are mostly audio coders, except the TTAEnc and pure entropy coders. All of these coders are known to perform well for their specific input types, and they are used as references for comparisons to state of the art compression techniques. Some of the audio coders (including MP3) are optimized for the audio perception of the human ear. Therefore, their suitability for PQ data compression may be arguable. However, it should be noted that the encoder favors to the high energy wavelet spaces by measuring the variances at each subband. Therefore, the lower energy transform coefficients are quantized more. This situation is also appropriate for the compression of recorded PQ event data because the application is similar to the basis restriction error analysis presented in Section 3, where the lower energy space samples are thresholded. As a result, the perceptual optimization directly corresponds to a MSE optimization for a waveform that has a pronounced fundamental and other higher frequency perturbations that are small in magnitude. The 2D coders are all image coders. However, their application to the 2D representation of the recorded PQ event data is compatible to the 1D coders in the sense that they also quantize lower energy wavelet samples more and favor to the higher energy samples. As a result, although these two types of coders are not specifically designed for the PQ waveform compression via minimizing the SNR, their compression strategies are compatible and they constitute experimental examples for the efficiency of the 2D representation. In order to feed 1D data to the coders, a pre-process making the waveform data audible is necessary for the audio coders. The pre-process converts the original 16 bit/sample PQ event data to 8 bit/sample to make it compatible with both 1D and 2D coders. In this way, more elaborate variations of these coders are avoi-
¨ O.N. Gerek, D.G. Ece / Electric Power Systems Research 78 (2008) 1047–1052
ded. It should be kept in mind that the purpose of this work is just to show the compression efficiency of the 2D representation, and development of possibly dedicated 16 bit compression algorithms are out of the scope of this paper. The second stage of the pre-process consists of flagging the audio coders so that they interpret the PQ data as an audio wave sampled at 100 kHz. By the help of this flagging, the actual 50 Hz. fundamental was interpreted by the audio coders to be 250 Hz, which is a more audible frequency for the human hearing system. As a result, the fundamental frequency range is not discarded or severely quantized. This interpretation does not affect the waveform properties of the samples of the encoded and decoded data signal, but it is obligatory for the audio encoders to have an input which contains an audible fundamental. Without this interpretation, the 20 kHz sampled 50 Hz fundamental would not be audible, and the audio encoders could ignore or badly encode the waveform data, producing a meaningless MSE. It is verified that this operation produces exact recovery if the coders are applied in their lossless modes. The audio encoders are capable of compressing the waveform data down to an audio file corresponding to 32 kbit/s This corresponds to a compression ratio of CR = 25:1. Other available CR’s are 4.1667, 6.2500, 7.1429, 8.3333, 10.0000, 12.5000, 14.2857, 16.6667, and 20.0000. These compression ratios are applied to MP3, OggVorbis, TTAEnc, and G723 codecs. Interestingly, the MSE at these compression ratios are very similar for all of these four coders, therefore the averages of these MSE’s are presented here. The deviation from the average is not more than 7% for the listed encoders at all compression ratios. At compression ratio levels above 15:1, audio encoders start to detariorate rapidly in terms of MSE. This fast detarioration is not observed in the 2D encoders up to very high compression ratios such as 100:1. The zerotree bitplane type image coders are more flexible where the precise compression ratio targets can be met. Therefore, the first experiments are performed by the audio encoders, and the corresponding compression ratios are fed to the image encoders for comparison. As an example, MP3 at CR = 4.1667:1 yields a MSE of around 0.1 × 10⁻³ which is reached by the SPIHT image encoder at a compression ratio around 250:1, which is an incomparably high ratio. Similar situations appear when comparing audio coders to different image coders, as well. The MSE results along with the compression ratios for both 1D and 2D coder algorithms are presented in Fig. 4. The figure is presented along a logarithmic axis to better visualize the MSE quantities. The dB values can be considered as 10 log MSE values of the vertical axis. A noticeable observation is that, the commercially or freely available coders are capable of achieving better MSE figures than the recent state-of-the-art and elaborate compression methods presented specifically for the PQ event data [8,7]. As an example, adaptive methods utilizing minimum description length encoding reported MSE around −10 to −30 dB, which are already claimed to outperform other source coding methods. However, Fig. 4 clearly shows that even the MP3-like audio codecs are capable of achieving MSE below −40 dB for bitrates down to 0.8 bit/sample. The compression performance difference between audio coders and image coders are, however, even more pronounced. The 2D image coders achieve −50
1051
Fig. 4. MSE versus CR plots for audio and image coders.
to −60 dB MSE at comparable bitrates. The experiments verify that the MSE difference observed in Section 3 is also retained by the practical coders. Besides the difference in MSE quantities, audio encoders introduce significant quantization distortions around CR = 15:1. Therefore, beyond this rate, the post-event analysis may result in false spectral information which may be critical for the engineering solution of PQ problems. With the 2D representation, above mentioned problem occurs only at extremely high compression ratios, providing a wider range of practically useful compression ratios for storage and transmission. A similar situation was observed for wavelet basis restriction error experiments as stated in Section 3. As a final 1D versus 2D performance comparison, lossless coding methods are applied to the 1D and 2D data. The 1D coders were selected as lossless modes of audio coders, as well as pure entropy coders for general purpose data compression. The 2D lossless coders were specifically selected among lossless image
Fig. 5. Lossless compression ratios of 1D and 2D coders.
1052
¨ O.N. Gerek, D.G. Ece / Electric Power Systems Research 78 (2008) 1047–1052
coders that fully utilize the 2D characteristics of the image. Fig. 5 presents lossless compression results. The 1D encoders in this figure are: (1) LZP2, (2) FLAC, (3) TTAEnc, (4) MP3, (5) ZIP. Interestingly, the regular “ZIP” method (which uses a Lempel-Ziv variant) achieves the highest compression ratio on the average. Besides, this compression ratio corresponds to around 1.6 bit/sample, and at that bitrate level, the best reported PQ event compression method can achieve only −30 dB MSE [7]. The 2D coders were selected as (6) JPEG-LS, (7) JPEG2000 in lossless mode, and (8) SPIHT in lossless mode. It is clear from the figure that all these coders are capable of achieving about 1.5 times more compression in their lossless modes. These results again justify the compression efficiency of the proposed 2D representation of PQ event data. 5. Conclusions In this paper, the 2D representation is observed to have energy compaction advantages over the classical 1D data representation which makes it suitable for PQ event data compression. The compaction properties of the 2D representation are found to be orders of magnitude better than the 1D representation. This fact is illustrated by thresholding 2D-DWT decomposition samples of the 2D representation, and comparing to the results of the same operation applied to the 1D signal. The reconstruction SNR’s were observed to have significant SNR differences between the 1D and 2D cases. Furthermore, the difference tends to increase with the increasing compression ratio. Following this preliminary analysis, practical (commercially or freely available) audio and image coders are used for the comparison of the two representations. Also in this case, the MSE versus compression ratio results justify the observations made above. The experimental comparisons are finally made using lossless compressors, and 2D representation retains its inherent advantage for compression. The experimental results presented in this work can provide an insight for the selection of the image coder to be used in the practical compression application. Although development of dedicated 2D encoders for compression of PQ event data captured at high bits/sample rates remains an open issue, the above coder results constitute a landmark for compression performances. Therefore, a novel coder proposal should at least perform better than the freely available coders. Acknowledgement This work is supported by The Scientific and Technological Research Council of Turkey (TUBITAK) under contract number 105E153. References [1] S. Santoso, E.J. Powers, W.M. Grady, Power quality disturbance data compression using wavelet transform methods, IEEE Trans. Power Deliv. 12 (1997) 1250–1256.
[2] T.B. Littler, D.J. Morrow, Wavelets for the analysis and compression of power system disturbances, IEEE Trans. Power Deliv. 14 (1999) 358– 364. [3] G. Panda, P.K. Dash, A.K. Pradhan, S.K. Meher, Data compression of power quality events using the slantlet transform, IEEE Trans. Power Deliv. 17 (2002) 662–667. [4] E.Y. Hamid, Z.I. Kawasaki, Wavelet-based data compression of power system disturbances using the minimum description length criterion, IEEE Trans. Power Deliv. 17 (2002) 460–466. ¨ [5] O.N. Gerek, D.G. Ece, 2D analysis and compression of power quality event data, IEEE Trans. Power Deliv. 19 (2004) 791–798. ¨ [6] D.G. Ece, O.N. Gerek, Power quality event detection using joint 2D-wavelet subspaces, IEEE Trans. Instrum. Meas. 53 (2004) 1040–1046. [7] M.V. Ribeiro, H. Park, J. Marcos, T. Romano, S.J. Mitra, A novel MDLbased compression method for power quality applications, IEEE Trans. Power Deliv. 22 (2007) 27–36. [8] F. Lorio, F. Magnago, Analysis of data compression methods for power quality events, IEEE Power Eng. Soc. Gen. Meet. 1 (2004) 1–6. [9] M. Vetterli, J. Kovacevic, Wavelets and Subband Coding, Prentice Hall, Englewood Cliffs, NJ, 1995. [10] M. Antonini, M. Barlaud, P. Mathieu, I. Daubechies, Image coding using wavelet transform, IEEE Trans. Image Process. 1 (1992) 205–220. [11] A.S. Lewis, G. Knowles, Image compression using the 2D wavelet transform, IEEE Trans. Image Process. 1 (1992) 244–250. [12] N.S. Jayant, P. Noll, Digital Coding of Waveforms, Prentice Hall, Englewood Cliffs, NJ, 1984. [13] Z.-N. Li, M.S. Drew, Fundamentals of Multimedia, Pearson Education, Inc., 2004. [14] MPEG-1, Layer 3 Audio Coder Standard: ISO/IEC 11172-3. [15] C. Bloom, Online at: http://www.cbloom.org, Documentation on dictionary-based, statistical and wavelet coders, 1999. [16] Xiph.org Foundation, Vorbis I Specification, http://www.xiph.org/ogg/ vorbis/doc/Vorbis I spec.html, 2006. [17] A. Said, W.A. Pearlman, A new fast and efficient image codec based on set partitioning in hierarchical trees, IEEE Trans. Circ. Syst. Video Technol. 6 (1996) 243–250. [18] D.S. Taubman, M.W. Marcellin, JPEG2000: Image Compression Fundamentals, Standards and Practice, Kluwer Academic Publishers, 2002. [19] Weinberger, Seroussi, Sapiro, The LOCO-I lossless image compression algorithm: principles and standardization into JPEG-LS, IEEE Trans. Image Process. 9 (2000). ¨ Omer Nezih Gerek was born in Eskis¸ehir, Turkey, in 1969. He received the B.S., M.Sc., and Ph.D. degrees from Bilkent University, Ankara, Turkey, all in electrical engineering. He held the Bilkent scholarship during his B.S. program. During his M.Sc. and Ph.D. studies, he was a research assistant in Bilkent University. From 1998 to 1999, he was a technical researcher with the Swiss Federal Institute of Technology, Lausanne, Switzerland. Currently he is associate professor in the Department of Electrical Engineering, Anadolu University, Eskis¸ehir, Turkey. His research interests include signal processing, signal analysis and coding, multiresolution analysis and wavelets. Dog˜an G¨okhan Ece was born in Ankara, Turkey in 1964. He received the engineer degree from ˙Istanbul Technical University in 1986, the M.Sc. and Ph.D. degrees from Vanderbilt University, Nashville, T.N., in 1990 and 1993, respectively all in electrical engineering. Currently he is associate professor of Electrical and Electronics Engineering in Anadolu University. His research areas include power quality, fault detection, and modelling.