Mona M. Abd-El-Aziz1, Maged N. F. Nashed1, Amr A. Adly2 and Essam-El-Din M. Abou-El-Zahab2. 1Electronics Research Institute (ERI), El-Tahrir St., Dokki, ...
Computation of Busbars Local Electromagnetic Force Densities Connected to 3-Pulse Rectifier Load over a Complete Cycle Mona M. Abd-El-Aziz1, Maged N. F. Nashed1, Amr A. Adly2 and Essam-El-Din M. Abou-El-Zahab2 1
2
Electronics Research Institute (ERI), El-Tahrir St., Dokki, Giza, EGYPT
Elect. Power and Machines Dept. Faculty of Eng., Cairo University, Giza, EGYPT
Abstract—All power system substations use three phase parallel busbars in the power distribution between loads. These busbars are subjected to electromagnetic forces which may cause their permanent deformation, break of insulating supports and an excess vibrational stresses applied on the busbars. From the factors affect these forces is whether the busbars currents have harmonic content or not. This paper presents an analytical approach from which overall forces and local force densities can be calculation. Busbars currents contain harmonics are used in this approach implementation. These currents are taken from a simulated model of 3-pulse rectifier, which is compared with an experimental model to give well qualitative current values. Keyword: 3 Phase parallel busbars, electromagnetic force, Busbars currents contain harmonics, and 3-pulse rectifier.
I. INTRODUCTION Power system substations serve as locations to step down voltage and distribute power to various locations. Normally this power is distributed by a three phase busbar structure which consists of three equally spaced parallel conductors (busbars) supported at various points by insulators. Two materials are commercially suitable for use as busbars, i.e. copper and aluminum. It is essential that the materials used in their construction should have the best mechanical properties to operate within the temperature limits laid down in British standard or international system [1,2]. Under normal operating conditions the load currents in the parallel busbars, through the interaction of the electromagnetic fields result in small forces applied on the adjacent busbars. During short-circuit fault, the currents suddenly increase to many times the normal load currents applying very high instantaneous electromagnetic forces on the busbars until the fault is cleared from the system [3]-[5]. The wide use of power electronic technology increases the non-linear loads connected to the busbars causing a harmonic distortion of the supply current which will affect the forces values [6,7]. These forces may cause a permanent deformation of the busbars, break of insulator supports and excess vibrational stresses on the busbars. The substation structure must be designed to withstand these forces resulting from shortcircuit and harmonic currents in order to avoid the mechanical failure of the substation components. These electromagnetic forces depend on the presence of non linear loads causing the presence of harmonic content in the supply currents, the strength of the short-circuit currents,
978-1-4244-1933-3/08/$25.00 ©2008 IEEE
the busbars dimension, the busbars configuration, spacing between busbars and the type of fault occurs. Thus, the calculation of the electromagnetic forces between busbars enables us to design the most effective busbar spacing, dimension and support structure to minimize the exposed forces on busbars. The purpose of this paper is to present an analytical approach from which forces acting on busbars may be computed. The proposed approach can also predict local force densities acting on every single busbar section in all current cases, for instant, steady state, short-circuit and harmonic cases. This paper will specify local force density calculations in case of busbars carrying harmonic currents resulting from 3-pulse rectifier. Analysis, simulation and an experimental model of 3-pulse rectifier is done in order to notify the effect of distorted currents on the local force density applied on busbars. Details of the approach and its implementation on 3-phase busbars connected to 3-pulse rectifier over one cycle are given in the following sections. II.
COMPUTATION OF ELECTROMAGNETIC FORCES
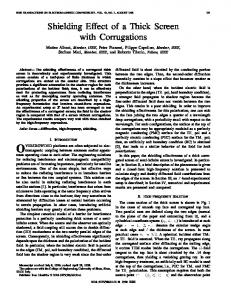
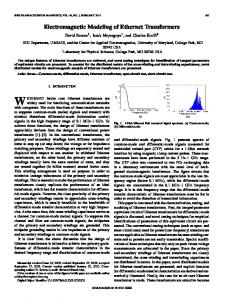
The electromagnetic forces; is the mechanical push or pull exerted on a busbar by short-circuit current and its magnetic field; i.e. it is the force tending to displace the busbars from their normal position. The forces acting on the busbars shown in figure 1 carrying short circuit currents depend on the geometrical configuration and the profile of the busbar [8]. The conventional arrangement of conductors in parallel and in single plane is taken as a basis for the calculation as shown in Fig. 1. IA=Imax IB=Imax cos(ωt-1200) IC = Imax cos(ωt+1200 A. Assumptions 1-The fault is three-phase symmetrical short circuit as it causes the greatest dynamic stress [3]. 2-The center line distance between busbars is much smaller than the conductor length [4], and since the end effects are usually negligible in busbar application, the busbar can be regarded as being infinite length, then a 2-D field analysis can be performed assuming that the magnetic field lies in x-y plane and the currents flow along z axis.
550
µ B (xq ,y q ) = 0 4π
y
J p dz p u z
x
b
a
d
B y ( xq , y q ) =
dl
Where, dl is a unit length along the flow of current and u is a unit vector. From [11], it can be shown that the flux density acting on a point (Q) enclosed in a busbar and resulting from another current-carrying busbar may be given by:
R pq
y p2
y p1
x q1
+ Y 2 + z2 p
]
3
(1)
] dXdY
2
(2)
f (xq , y q )
(3)
acting on the point
( xq , yq ) may be simply computed from the expression:
f ( xq , yq ) = J q u z × {Bx ( xq , yq )u x + By ( xq , yq )u y } (4)
The overall force per unit length Fl (Q) acting on the busbar enclosing the point ( xq , yq ) may be computed from: xq 2 y q 2
y q2
Fl (Q) =
∫ ∫ f ( x , y )dy dx q
q
q
q
(5)
x q1 y q1
y q1 (xp ,yp)
2
+ Yu y − zp uz
+ J pµ0
The force density
(y q − y p ) = Y
(xq ,yq)
[X
x
4π ( y q − y p 2 ) 2 + ( xq − x p 2 ) 2 ( y q − y p 2 ) ln 2 2 ( y q − y p 2 ) + ( xq − x p1 ) −1 ( y q − y p 2 ) ( y q − y p1 ) −1 + 2 ( x q − x p 2 ) tan ( x − x ) − tan ( x − x ) q p2 q p2 ( y q − y p1 ) 2 + ( x q − x p1 ) 2 + ( y − y ) ln q p1 2 2 ( y q − y p1 ) + ( y q − y p 2 ) −1 ( y q − y p1 ) ( yq − y p 2 ) −1 − tan + 2 ( x q − x p1 ) tan ( x q − x p1 ) ( x q − x p1 )
R pq = R q − R p = (x q − x p ) u x + (y q − y p ) u y − z p u z
x p2
[X u ×
Likewise (2) may be simplified to:-
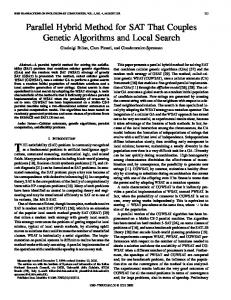
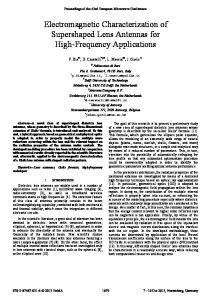
B. Field Equations Biot-Savart Law: This law is used in order to determine the magnetic field due to any current carrying conductor configuration discussed in [9]. Consider busbar pair configurations shown in Fig. 2. As can be seen from this figure, arbitrary dimensions and spacing have been assumed. Given the currents flow in both busbars, local force density acting on any of them may be computed from [10] using Biot-Savart law for volume configuration. Let
x p1
∫ ∫
( xq − x p 2 ) 2 + ( yq − y p 2 ) 2 ( xq − x p 2 ) ln 2 2 ( xq − x p 2 ) + ( yq − y p1 ) −1 ( xq − x p 2 ) ( xq − x p1 ) −1 + 2( yq − y p 2 ) tan ( y − y ) − tan ( y − y ) q p2 q p2 2 2 + ( x − x ) ln ( xq − x p1 ) + ( yq − y p1 ) q p1 2 2 ( xq − x p1 ) + ( yq − y p 2 ) −1 ( xq − x p1 ) ( xq − x p 2 ) −1 − tan + 2( yq − y p1 ) tan ( yq − y p1 ) ( yq − y p1 )
3-The permeability of copper and aluminum in air is constant. 4-A steady state (not transient) balanced three phase system is applied to a three phase busbars with a peak value equal to the short circuit currents in the case of balanced three phase short circuit. 5- Skin effect and proximity phenomena, which can affect the current distribution in the cross-section of solid conductor, are ignored [3]. In order to compute the forces acting on each element of the conductor, the flux density at each element must be calculated using field equations.
and
∫
( yq − y p 1 ) ( xq − x p 1 ) −∞
From [12] it can be shown that the integrals in (1) may be further evaluated leading to the following expressions:− J p µ0 B x ( xq , yq ) = 4π
Fig. 1. Cross section of rigid busbars
= dz p u z (x q − x p ) = X
( yq − y p 2 ) ( xq − x p 2 ) +∞
x q2
Fig. 2. Geometrical configuration of two adjacent current carrying busbars.
By superposition, the overall force per unit length acting on a busbar may be computed due to all surrounding busbars. III. ANALYSIS AND SAMPLE SIMULATION OF 3-PULSE RECTIFIER
In order to calculate the forces between busbars due to harmonic currents, a simple non-linear load circuit of 3-pulse
551
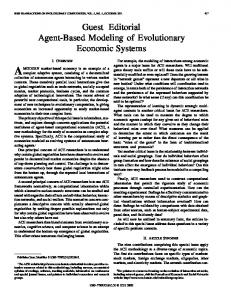
rectifier is chosen. The circuit topology is shown in Fig. 3. Many simulation cases have been done at different firing angles. This paper will present the values at α=60°. The supply currents, taken from the experimental model, are used in local force density calculation over one cycle in order to know the effect of harmonics on local force densities. To control the load voltage, the circuit uses three common cathode thyristor arrangement [13]. Fig. 4. Current frequency spectrum.
R
Fig. 3. Three-phase half-wave rectifier.
In this figure, the power supply, and the transformer are assumed ideal. The thyristor will conduct (ON state) when the anode-to-cathode voltage VAK is positive, and a firing
Fig. 5. Load voltage VD at α=60°.
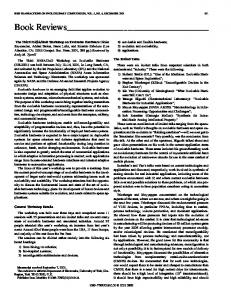
current pulse Igate is applied to the gate terminal. Delaying the firing pulse by angle α controls the load voltage. As the primary side of the transformer is delta connected and the secondary is star then the source line currents will be [14]: IA= (ipc-ipb)/a (6) IB= (ipa-ipc)/a IC= (ipb-ipa)/a A. Harmonics of 3-Pulse Rectifiers Traditional thyristor rectifiers draw harmonic currents from the utility line, which pollute utility system, disturbs appliances, and increase the power loss. These harmonic currents are due to input currents IA,IB,IC that have a rectangular waveforms. These rectangular alternating current waveforms represent distorted waveforms full of harmonic content. The characteristic harmonic component of the supply currents having harmonic order h can be expressed as: (7) h = kp ± 1 Where, k : 1,2,3,4,and p :is the number of rectifier arms = 3. Thus, three-pulse rectifier generates all the harmonics except the triples harmonics. Using Fourier analysis, the spectrum will be as shown in Fig. 4. C. Experimental Results The experimental model consists of a drive circuit that controls the firing angle needed to trigger the thyristor and a power circuit. The power circuit shown in Fig. 3 consists of transformer delta/star 220/50 volt is connected to a variable resistance load 320 ohm adjusted to 102 ohm. The load voltage VD and the distorted secondary phase current ia at α=60° are shown in Fig. 5 and Fig. 6.
70 60 50
Ia (Ampere)
40 30 20 10 0 -10
0
0.002 0.003 0.005 0.006 0.008 0.01 0.011 0.013 0.014 0.016 0.018 0.019
-20 Time (second)
Fig. 6. Secondary phase current ia at α=60.
The other phase currents waveforms ib, ic will be similer to ia , but shifted by 120°, 240° dergree. The primary phase currents will have the same waveforms but divided over the transformer turns ratio. The primary line currents are calculated using (6). Forces between bus bars connected to this experimental non-linear load will be calculated in the next section with the help of the line currents calculated form this experimental model. IV. OVERALL FORCES AND LOCAL FORCE DENSITIES DUE TO 3-PULSE RECTIFIER The harmonic currents are taken from the experimental model discussed in the previous section. One cycle is taken in the calculations, by dividing it to 37 parts as there are 37 commutation point . The overall force and local force densities are calculated in every part of the 37 parts. The busbars structure description of harmonic simulation case is shown in TABLE I. The local force densities distribution along X and Y direction in every busbar at certain time instants are shown in the following figures.
552
TABLE I HARMONIC SIMULATION CASE Busbar structure description Quantity Busbar width
0.02 m
Busbar height
0.06 m
Inter-busbar spacing
0.05 m
1) From time = 0 to 0.00222 second
Fig. 10. Force density distribution along the Y-direction in every Busbar From time = 0.00277 to 0.01055 second.
3) At time = 0.0111 second
Fig. 7. Force density distribution along the x-direction in every busbar from time=0 to 0.00222 second. Fig. 11. Force density distribution along the x-direction in every Busbar at time =0.0111 second
Fig. 8. Force density distribution along the Y-direction in every busbar from time=0 to 0.00222 second.
Fig. 12. Force density distribution along the Y-direction in every Busbar at time =0.0111 second
2) From time = 0.00277 to 0.01055 second
4) From time = 0.01166 to 0.0166 second
Fig. 9. Force density distribution along the x-direction in every Busbar From time = 0.00277 to 0.01055 second.
Fig. 13. Force density distribution along the x-direction in every Busbar from time =0.01166 to 0.0166 second
553
V.
CONCLUSIONS
It can be seen that the developed expressions of local force density may be used to examine the local force densities acting on a certain busbar. The developed expressions may also be very useful in computing the overall forces applied on the three phase busbars. These forces can be taken as a guideline while selecting the suitable busbars support structure. The forces in the presence of harmonics causes excess vibrational stresses on the busbars as the changes of currents in the presence of harmonics are more than its absence. These stresses may cause rupture of the insulating supports and permanent busbar bending. Thus, the presence of harmonic currents resulting from non- linear load must be considered while calculating the forces between busbars. Fig. 14. Force density distribution along the Y-direction in every Busbar from time =0.01166 to 0.0166 second
5) From time = 0.01722 to 0.02 second
REFERENCES [1] [2] [3]
[4]
[5] [6] [7]
[8]
Fig. 15. Force density distribution along the x-direction in every Busbar from time =0.01722 to 0.02 second
[9] [10]
[11] [12] [13] [14]
Fig. 16. Force density distribution along the Y-direction in every Busbar from time =0.01722 to 0.02 second
554
R.T. Lythall, “The JSP Switchgear Book”, 7th Edition, NewnesButterworths, 1972. D. Simpson, “The Use of Compression Technology on Busbars”, 79th EESA Conference, Sydney Australia, 8-9 August 2003, pp. 21-23. D.P. Labridis and P.S. Dokopoulos, “Electromagnetic Forces in ThreePhase Rigid Busbars with Rectangular Cross-Sections”, IEEE Transactions on Power Delivery, Vol. 11, No.2, April 1996, pp. 793800. D.G Traintafyllidis, P. S. Dokopoulos and D. P. Labridis, “Parametric Short-Circuit Force Analysis of Three-Phase Busbars - A Fully Automated Finite Element Approach”, IEEE Transactions on Power Delivery, Vol. 18, No.2, April 2003, pp. 531-537. N.S. Attri and J. N. Edgad, “Response of Busbars on Elastic Supports Subjected to a Suddenly Applied Force”, IEEE Transactions on Power Apparatus and Systems, Vol. 86, No. 5, May 1967, pp. 636-650. G. J. Wakileh, “Power Systems Harmonics Fundamentals, Analysis and Filter Design”, Springer, 2001. P. Pejovic and Z. Janda, “An Analysis of Three-Phase Low Harmonic Rectifiers Applying the Third-Harmonic Current Injection”, IEEE Transactions on Power Electronics, Vol. 14, No.3, May 1999, pp. 397407. O.R. Schurig and M.F. Sayre, “Mechanical Stresses in Busbar Supports During Short-circuits”, AIEE Transaction, Vol. 44, February 1925, pp. 217-237. S. V. Marshall and G. G. Skitek, “Electromagnetic Concepts and Applications”, 3rd Edition, Prentic Hall International. Mona M. Abd-El-Aziz, Amr A. Adly and Essam-El-Din M. Abou-ElZahab, “Assessment of Electromagnetic Forces Resulting from Arbitrary Geometrical Busbar Configuration”, ICEEC04 Conference, Cairo, Egypt, 5-7 September 2004. D. K. Cheng, “Field and Wave Electromagnetics”, 2 nd Edition, Addison Wesley Massachusetts, U.S.A, 1989. I.S. Gradshteyn and L.M. Ryzhik, “Tables of Integral, Series and Product”, Academic press, Cambridge University Press, California, U.S.A, 1980. N. Mohon, T. M. Undeland and W. P. Robbins, “Power Electronics Converters, Applications and Design”, 3rd Edition, John Wiley & Sons, Inc., U.S.A., 2003. E. W. Kinbark, “Direct Current Transmission”, Volume 1, John Wiley & Sons, Inc. U.S.A., 1971.