Abstract—Among the major challenges in the development of real-time wearable ... mobile application using a technology s
Computation Offloading for Real-Time Health-Monitoring Devices Haik Kalantarian, Costas Sideris, Tuan Le, Anahita Hosseini, Majid Sarrafzadeh Department of Computer Science University of California, Los Angeles kalantarian, costas, tuanle, anahosseini,
[email protected] Local Processing
Abstract— Among the major challenges in the development of real-time wearable health monitoring systems is to optimize battery life. One of the major techniques with which this objective can be achieved is computation offloading, in which portions of computation can be partitioned between the device and other resources such as a server or cloud. In this paper, we describe a novel dynamic computation offloading scheme for real-time wearable health monitoring devices that adjusts the partitioning of data between the wearable device and mobile application as a function of desired classification accuracy.
(send only class labels)
Remote Processing
I. I NTRODUCTION
(send raw data)
A. Introduction to Wearables As smartphones have entered ubiquity in recent years, various wearable wireless health monitoring gadgets have emerged. These devices have broad applications ranging from activity monitoring to more experimental applications such as diet tracking [1] and rehabilitation [2]. Spurred by a rapidly aging global population and the emergency of lightweight, affordable microelectronics, wearable devices will have increasingly broad applications for consumers and clinicians in the years to come. One of the most significant challenges in medicine is nonadherence, as prior studies have shown that non-compliance to treatments is associated with a host of negative health outcomes [3]. Wearables are not exempt from this challenge, as there is evidence of a lack of sustained use associated with mobile health devices and applications. Among other factors, battery life has been reported to be a significant contributor to non-adherence. Therefore, an increasing amount of attention has been directed towards improving the battery life of wearable health monitoring devices is recent years. Regardless of function or application, wearables have many fundamental architectural similarities. The primary components typically consist of: 1) Sensors: One or more sensors, sampled at a particular frequency depending on the application. Examples include accelerometers, gyroscopes, infrared sensors, and microphones. 2) Microcontroller: A microcontroller that performs the sensor sampling, processes the data, and interfaces with other peripherals. 3) Transceiver: A wireless transceiver based on a technology such as Bluetooth, Zigbee, or Wifi, which transmits data remotely to a mobile phone or cloud services for analysis, visualization, and feedback.
978-1-4577-0220-4/16/$31.00 ©2016 IEEE
Fig. 1. Wearable devices must evaluate the performance penaltiy of RF transmission when deciding to perform data computation locally vs. remotely.
There are two predominate forms of power usage in a wearable device: wireless transmission, and local computation. Wireless transmission overhead refers to the power necessary to transmit data from the microcontroller to a mobile application using a technology such as Bluetooth. Local computation overhead refers to the power requirements of data processing performed on the wearable device’s microcontroller, before transmission. Unfortunately, as Figure 1 illustrates, it is often the case that optimizing the energy of the microcontroller and wireless transceiver are diametrically opposing goals. Assume there is some feature or property f, that we are interested in detecting from a continuous signal. An example of f could be a step (for a pedometer), a bite (for a nutrition monitor), or a fall (for a gait monitor). There are two possible approaches to detect such an event. The first option is to process the data locally on the wearable device, and only transmit the minimal information: that we have detected f. This puts a significant burden on the computation resources of the microcontroller, with minimal Bluetooth overhead. The second option is to perform no data processing on the local device, deferring the processing to the smartphone. Though this approach saves local computation energy, it requires us to transmit all the raw data from the mobile device to the phone. Thus, the wireless transmission overhead is higher using this approach. Computation offloading is a broad paradigm in which data is outsourced from local computation to a server, cloud, or other form of aggregator. The primary objective of computation offloading is to reduce the energy demands
4971
Some heuristic (or system call)
(2) Remote data processing. (1) Local data processing.
Performance Requirement Classifier Sample rate
Feature set (2) Transmission of class label.
Cost Analysis
(1) Transmission of raw data.
Fig. 2. When the required classification accuracy is adjusted, a new decision is made on whether to process the data locally or transmit for remote processing.
of a small microcontroller with a low battery capacity, or to perform very resource-heavy operations on more powerful hardware for performance reasons. In this paper, we propose a novel algorithm for dynamic computation offloading, targeted towards real-time wearable health monitoring applications. Many works have discussed different strategies for offloading computation [4], [5], [6]. However, our work focuses specifically on modern cutting-edge wearable devices, emphasizing the tradeoffs between local computation and Bluetooth transmission overhead as a function of the required classification accuracy.
this paper. This leaves dynamic offloading optimizations to feature extraction, and classification, both of which can be performed locally or remotely. B. Energy Modeling Assume we have a feature set F, consisting of a total of n features, f1 through fn . Similarly, assume each feature fi has a cost, Cfi . If we perform both the feature extraction and classification locally, the local energy can be modeled as the sum of the feature extraction and the cost of running the classifier K on feature set F, which we define as K(F).
II. A LGORITHM
Clocal = K(F) +
A. Classification Flow
n X
Cfi
(1)
i=1
We can also model the local cost of transmitting the raw data to the mobile device, and performing both the feature extraction and classification remotely. We assume these features are associated with a window of length L. Thus, the cost of transmitting a window of length L is: Ctx (L). Combining these equations gives us the equilibrium point, in which it is roughly equally costly to process the data locally and remotely: K(F ) +
n X
Cfi = Ctx (L)
(2)
i=1
An adaptive system could modify several parameters in real-time, to favor either local or remote processing. For
Local processing power curve
Power Consumption
In this subsection, we begin with the preliminaries of a modern real-time health monitoring system. An example processing pipeline is as follows: 1) Acquisition: In this stage, the microcontroller on the wearable device acquires data from a sensor and buffers it locally until the buffer is full. 2) Segmentation: Next, the signal is divided into shorter windows, each of which are typically processed independently of one another. 3) Extraction: From each window, a set of features are extracted. An example of a feature is to take the Fourier transform of the signal, and extract the magnitude of a particular frequency band. As expected, this extraction is associated with computational overhead. The exact features are pre-selected during the training process using various feature selection and dimension reduction algorithms. However, the feature extraction must be performed in real-time. 4) Classification: The features are the inputs to a pretrained classifier, which outputs a class label that descibes the actions represented by the window. Once again, the classifier may be trained a priori. However, a real-time system would generally require that the classifier be run periodically for user feedback. However, not all of these tasks can be offloaded. In almost all cases, signal acquisition would take place on the wearable device. And while signal segmentation can be a complex challenge depending on the heuristic used, we assume a fixed-length segmentation for the purposes of
Remote Processing Power Curve
Local vs. Remote Switching Threshold
Unachievable Region
Local Processing Region
Remote Processing Region
Unachievable Region
Classification Accuracy
Fig. 3. When the desired classification accuracy increases beyond a certain threshold, it becomes more energy efficient to transmit the data from the wearable to a mobile aggregator for processing.
4972
D. Dynamic Offloading The proposed computation offloading scheme is as follows. First, the system pre-trains n classifiers, M1 ...Mn , each with the objective of maximizing total classification accuracy for a given power budget. Based on the desired sample rate, we can predict the benefits of local and remote processing using Equation 2 and select one of the two schemes. When an adjustment in classification accuracy is necessary, we iterate through the n possible classifiers and select classifier Mi that which minimizes power consumption based on the required accuracy threshold. Subsequently, its predicted cost is computed using Equation 2 based on feature size and classifier, and a decision is made with respect to local and remote processing. Figure 3 shows the proposed scheme, which depicts both local processing regions, based on the desired classification accuracy. The point denoted by the star represents the condition shown in Equation 2; equal local and remote processing costs. The cost to process data locally is modeled as a function of two parameters: α and β. Parameter α represents
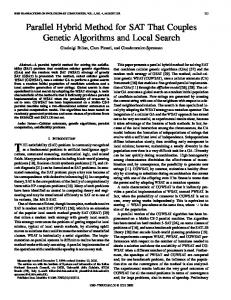
Classification Accuracy
95 90
RandomForest Logistic SMO NaiveBayes
85 80 75 70 5
10 15 Number of Features
20
Fig. 4. Variations in accuracy vs. classifier, and feature set size. Larger feature sets are generally more expensive to extract. 3.5 3
C. Classifier Accuracy Adjustment Many prior works have scaled down accuracy to save power, for various applications including classification and health monitoring. For example, Benbasat et al. propose a power efficient sensor system in [7], in which a wearable gait monitor is optimized by adjusting classification accuracy. In [8], Ghasemzadeh et al. propose a two-tiered classification scheme in which preliminary classification is achieved using lightweight, low-power techniques. A similar two-stage scheme was proposed by Shih et al. in [9] in which a power-efficient screening stage precedes a more computationally expensive analysis stage. The key insight these works is that it is not always necessary to run the classifier at its highest accuracy setting; often, a low-power detection strategy can be used, which transitions into a more expensive recognition stage when various criteria are met. Though these works are able to successfully reduce power consumption, they generally do not evaluate the tradeoffs between wireless transmission and local computation upon changes in classification accuracy.
Accuracy vs. Feature Size
100
Runtime (ms)
example, various classifiers such as RandomForest, Support Vector Machines, and k-Nearest Neighbor, have different runtimes. Switching to a lighter classifier can swing the balance in favor of local processing at the cost of classification accuracy. Moreover, choosing a different subset of features may have dramatic performance implications. A higher number of input features may, in some cases, improve classification accuracy. Each classifier M can be represented by its classifier choice and feature count, and is associated with a particular classification accuracy and power budget. The subsequent challenge is to identify the circumstances in which it is appropriate to vary the desired classification accuracy to save power. However, the specific scenarios are out of scope for this work; we refer the readers to [7], [8], [9] for a discussion of these issues.
2.5
Runtime Speed vs. Feature Size RandomForest Logistic SMO NaiveBayes
2 1.5 1 0.5 0 5
Fig. 5.
10 15 Number of Features
20
Variations in runtime speed vs. classifier, and feature set size.
the cost to extract one feature, while β represents the cost to run a classifier. III. E XPERIMENTAL M ETHODOLOGY Our experimental methodology was derived from an audio-based nutrition monitoring dataset described in [10]. In summary, twenty subjects consumed a variety of foods wearing a throat microphone; the primary challenges of nutrition monitoring are identifying eating (such as chewing or swallowing) from other ambient noises, and identifying the specific food using various heuristics. The dataset used corresponded to eating of three foods: nuts, chocolate, and a vegetarian patty. Evaluation was conducted using LeaveOne-Subject-Out cross validation. Power simulations were conducted in the nRFgo Studio software, based on the nRF8002 integrated circuit by Nordic Semiconductor. The simulations assumed no advertisement period, and a default connection interval of 1000 ms. The feature extraction tool used on the audio dataset was provided by the OpenSMILE framework [11]. Lastly, the WEKA data mining software is used to evaluate the performance of various classifiers [12], which are normalized and compared to our prior results on the MSP430 platform in [13], in which we measured the performance of various algorithms in realtime on a Texas Instruments development board. Similarly, the cost of extracting a particular feature is derived from our prior work in [13]. IV. R ESULTS AND D ISCUSSION A. Classifier Performance Figure 4 shows the classification accuracy among four classifiers, as a function of feature set size. Note that the
4973
Ratio of Remote vs. Local Power (- = 0.2)
4
, = 0.5 , = 0.3 , = 0.1
Power Ratio
3
Equal Cost
2
1
0 70
75 80 85 Classification Accuracy
90
Fig. 6. Ratio of power in the remote and local processing schemes at various values of α and β of 0.2. 3
Power Ratio
2.5 2
Ratio of Remote vs. Local Power (- = 0.5) , = 0.5 , = 0.3 , = 0.1
Equal Cost
1.5 1 0.5 0 70
75 80 85 Classification Accuracy
90
Fig. 7. Ratio of power in the remote and local processing schemes at various values of α and β of 0.5.
classification accuracy does not linearly increase with the number of features extracted; in some cases, more features are detrimental to performance due to overfitting. Moreover, some classifiers such the Naive Bayesian classifier, perform well with small feature sets but fail to improve significantly with greater numbers of attributes. Figure 5 shows classifier runtime, which is generally correlated to power consumption, along with feature set size. Logistic regression appeared to have a consistently low runtime speed, which did not noticably increase with number of features. By contrast, the Naive Bayesian classifier was quick with a small number of features, but did not scale well with larger feature sets. B. Comparison of Local and Remote Processing Assuming a connection interval of 1000 ms and a payload size of 12 bytes, simulator results show average power as 964 µw. Figures 6 and 7 show the power overhead of both techniques as a function of various values of α and β. More specifically, these graphs show how much power would be spent in a remote processing scheme compared to a local processing approach, at various desired accuracy levels. These figures show that systems with lower feature extraction costs and desired classification accuracies are dramatically cheaper to execute locally rather than remotely. However, as the required classification accuracy increases, it is often necessary to use more expensive classifiers and larger feature sets. Thus, these scenarios generally favor remote processing.
racy constraints. Our simulations show that with a baseline classifier execution cost of 0.2 mw and feature extraction cost of 0.1 mW, making a correct offloading decision can reduce power by over 75% when low classification accuracies are sufficient. Similarly, we show through simulation that systems with higher performance requirements can reduce power by over 50% by offloading computation. Future work will evaluate these algorithms in a system feature an implementation of real-time classification accuracy adjustment to benchmark our proposed scheme. R EFERENCES [1] H. Kalantarian, N. Alshurafa, T. Le, and M. Sarrafzadeh, “Monitoring eating habits using a piezoelectric sensor-based necklace,” Elsevier Computers in Biology and Medicine, vol. 58, no. C, pp. 46–55, 2015. [2] S. Patel, H. Park, P. Bonato, L. Chan, and M. Rodgers, “A review of wearable sensors and systems with application in rehabilitation,” Journal of NeuroEngineering and Rehabilitation, vol. 9, no. 1, p. 21, 2012. [3] J. Dunbar-Jacob and M. Mortimer-Stephens, “Treatment adherence in chronic disease,” Journal of clinical epidemiology, vol. 54, no. 12, pp. S57–S60, 2001. [4] U. Kremer, J. Hicks, and J. Rehg, “A compilation framework for power and energy management on mobile computers,” in Languages and Compilers for Parallel Computing, ser. Lecture Notes in Computer Science, H. Dietz, Ed. Springer Berlin Heidelberg, 2003, vol. 2624, pp. 115–131. [Online]. Available: http://dx.doi.org/10.1007/3-540-35767-X8 [5] K. Kumar and Y.-H. Lu, “Cloud computing for mobile users: Can offloading computation save energy?” Computer, vol. 43, no. 4, pp. 51–56, April 2010. [6] K. Kumar, J. Liu, Y.-H. Lu, and B. Bhargava, “A survey of computation offloading for mobile systems,” Mobile Networks and Applications, vol. 18, no. 1, pp. 129–140, 2013. [7] A. Y. Benbasat and J. A. Paradiso, “A framework for the automated generation of power-efficient classifiers for embedded sensor nodes,” in Proceedings of the 5th International Conference on Embedded Networked Sensor Systems, ser. SenSys ’07. New York, NY, USA: ACM, 2007, pp. 219–232. [Online]. Available: http://doi.acm.org/10.1145/1322263.1322285 [8] H. Ghasemzadeh and R. Jafari, “Ultra low-power signal processing in wearable monitoring systems: A tiered screening architecture with optimal bit resolution,” ACM Trans. Embed. Comput. Syst., vol. 13, no. 1, pp. 9:1–9:23, Sep. 2013. [Online]. Available: http://doi.acm.org/10.1145/2501626.2501636 [9] E. Shih and J. Guttag, “Reducing energy consumption of multichannel mobile medical monitoring algorithms,” in Proceedings of the 2Nd International Workshop on Systems and Networking Support for Health Care and Assisted Living Environments, ser. HealthNet ’08. New York, NY, USA: ACM, 2008, pp. 15:1–15:7. [Online]. Available: http://doi.acm.org/10.1145/1515747.1515767 [10] H. Kalantarian and M. Sarrafzadeh, “Audio-based detection and evaluation of eating behavior using the smartwatch platform,” Elsevier Computers in Biology and Medicine, 2015. [11] F. Eyben, M. W¨ollmer, and B. Schuller, “Opensmile: The munich versatile and fast open-source audio feature extractor,” in Proceedings of the International Conference on Multimedia, ser. MM ’10. New York, NY, USA: ACM, 2010, pp. 1459–1462. [Online]. Available: http://doi.acm.org/10.1145/1873951.1874246 [12] M. Hall, E. Frank, G. Holmes, B. Pfahringer, P. Reutemann, and I. H. Witten, “The weka data mining software: an update,” ACM SIGKDD explorations newsletter, vol. 11, no. 1, pp. 10–18, 2009. [13] H. Kalantarian, N. Alshurafa, M. Pourhomayoun, and M. Sarrafzadeh, “Power optimization for wearable devices,” in IEEE International Conference on Pervasive Computing and Communication Workshops, 2015.
V. C ONCLUSION In this paper, we have demonstrated a novel scheme for selective computation offloading based on user-defined accu-
4974