rent flow using computational models, it is thus important to model pre- cisely both the ... at engineers and programmers developing these tools. Clinicians and.
C H A P T E R
4 Computational Modeling Assisted Design of Optimized and Individualized Transcranial Direct Current Stimulation Protocols Dennis Truong, Preet Minhas, Abhilash Nair, and Marom Bikson Department of Biomedical Engineering, The City College of New York of CUNY, New York, NY, USA
O U T L I N E Introduction to Computational Models of Non-Invasive Neuromodulation
86
Methods and Protocols in the Generation of Computational Forward Models of tDCS
88
Pitfalls and Challenges in the Application and Interpretation of Computational Model Predictions
95
Use of Computational Models in Clinical Practice Consideration for Efficacy
101 101
Consideration for Safety
103
Consideration for Individual Dose Titration
104
Example Results of Computational Analysis in Susceptible Populations 105
The Stimulated Brain http://dx.doi.org/10.1016/B978-0-12-404704-4.00004-1
85
© 2014 Elsevier Inc. All rights reserved.
86
4. COMPUTATIONAL MODELING ASSISTED DESIGN
Case Case Case Case Case
1: Skull Defects 2: Brain Lesions (Stroke) 3: Pediatric Populations 4: Obese Populations Design
105 106 107 109 111
Conclusion
111
References
112
INTRODUCTION TO COMPUTATIONAL MODELS OF NON-INVASIVE NEUROMODULATION This chapter is intended to provide a broad introduction to both clinical researchers and engineers interested in translational work to develop and apply computational models to inform and optimize tDCS. This first section introduces the rationale for modeling, the next two sections address technical features of modeling relevant to engineers (and to clinicians interested in the limitations of modeling), the next three sections address the use of modeling in clinical practice, and the final section illustrates the application of models in dose design through case studies. Transcranial electrical stimulation is a promising tool in rehabilitation, based on the growing evidence that delivery of current to specific brain regions can promote desirable plastic changes (Ardolino, Bossi, Barbieri, & Priori, 2005; Zentner, 1989). Of particular interest are neurostimulation modalities that are low cost, portable, and simple to implement. Furthermore, stimulation should be applied using low-intensity current in a manner that is safe, well tolerated, and can be delivered concurrently with physical or cognitive rehabilitation and other therapies. In complement to other brain stimulation approaches (Fig. 4.1), transcranial direct current stimulation (tDCS) has been gaining considerable interest because it possesses all these desired qualities (Brunoni et al., 2012). In contrast to pharmacotherapy, non-invasive electrotherapy offers the potential for both anatomically specific brain activation and complete temporal control anatomical targeting, which can be achieved through the rational selection of electrode number, shape, and position. In training applications such as rehabilitation, neuromodulatory techniques such as tDCS can combine focal stimulation with “focused” training to reinforce a particular region of activation (Edwards et al., 2009). Temporal control is possible due to the practically instantaneous delivery of electrical dose. There is no electrical “residue,” no lingering half-life, as the generated brain current dissipates without stimulation. tDCS dose can be modeled for specific subjects and targets in ways not possible with other I. THE BASIS
INTRODUCTION TO COMPUTATIONAL MODELS
87
FIGURE 4.1 Comparable stimulation techniques. Deep brain stimulation, motor cortex stimulation, transcranial magnetic stimulation, and spinal cord stimulation (top row); classic transcranial direct current stimulation (tDCS) via sponge pads, optimized high definitiontDCS (HD-tDCS), and 4 � 1 HD-tDCS (bottom row). Transcranial direct current stimulation is an increasingly popular investigational form of brain stimulation, in part due to its low cost, portability, usability, and safety. However, there are still many unanswered questions. The number of potential stimulation doses is practically limitless. Stimulation can be varied by simply changing the electric current waveform, and electrode shape, size, and position. These variations can thus be analyzed through computational modeling studies that have resulted in montages such as HD-tDCS and 4 � 1 HD-tDCS.
interventions. Specifically, the “dose” of electrotherapy (see Peterchev et al., 2011, for definition) is readily adjustable by determining the location of electrodes (which determines spatial targeting) and selecting the stimulation waveform (which determines the nature and timing of neuromodulation). Indeed, a single programmable electrotherapy device can be simply configured to provide a diversity of dosages. Though this flexibility underpins the utility of neuromodulation, the myriad of potential dosages (stimulator settings and combinations of electrode placements) makes it difficult to readily ascertain the optimal choice. The essential issue in dose design is to relate each externally controlled dose with the associated brain regions targeted (and spared) by the resulting current flow – and hence the desired clinical outcome. Computational forward models aim to provide precisely these answers to the first part of this I. THE BASIS
88
4. COMPUTATIONAL MODELING ASSISTED DESIGN
FIGURE 4.2 Role of computational models in rational electrotherapy. (Left) Neuromodulation is a promising therapeutic modality, as it affects the brain in a way not possible with other techniques with a high degree of individualized optimization. The goal of computational models is to assist clinicians in leveraging the power and flexibility of neuromodulation (right). Computational forward models are used to predict brain current flow during transcranial stimulation to guide clinical practice. As with pharmacotherapy, electrotherapy dose is controlled by the operator and leads to a complex pattern of internal current flow that is described by the model. In this way, clinicians can apply computational models to determine which dose will activate (or avoid) brain regions of interest.
question (Fig. 4.2), and thus need to be leveraged in the rational design, interpretation, and optimization of neuromodulation. The precise pattern of current flow through the brain is determined not only by the stimulation dose (e.g., the positions of the electrodes) but also by the underlying anatomy and tissue properties. In predicting brain current flow using computational models, it is thus important to model precisely both the stimulation itself and the relevant anatomy upon which it is delivered on an individual basis. The latter issue remains an area of ongoing technical development, and is critical to establishing the clinical utility of these models. For example, cerebral spinal fluid (CSF) is highly conductive (a preferred “super highway” for current flow) such that details of CSF architecture profoundly shape current flow through adjacent brain regions (see later discussion). Especially relevant for rehabilitative applications is the recognition that individual anatomical idiosyncrasies can result in significant distortions in current flow. This is apparent when skull defects and brain lesions occur. The final section of this review highlights the nature and degree of distortions in brain current flow produced by defects and lesions, as well as dose considerations for susceptible populations such as children.
METHODS AND PROTOCOLS IN THE GENERATION OF COMPUTATIONAL FORWARD MODELS OF tDCS This is the first of two sections aimed at outlining the technical steps and principles of computational models for tDCS, and so aimed primarily at engineers and programmers developing these tools. Clinicians and I. THE BASIS
METHODS AND PROTOCOLS
89
experimentalists interested in understanding the technical challenges and limitations of modeling would also benefit from these sections, but may otherwise continue to the final four sections on using models in clinical practice and case examples. During tDCS, current is generated in the brain. Because different electrode montages result in distinct brain current flow, researchers and clinicians can adjust the montage to target or avoid specific brain regions in an application-specific manner. Though tDCS montage design often follows basic rules of thumb (e.g., increased/decreased excitability under the anode/cathode electrode), computational forward models of brain current flow provide a more accurate insight into detailed current flow patterns, and in some cases can even challenge simplified electrodeplacement assumptions. For example, clinical studies are often designed by placing the anode electrode directly over the target region desired to be excited, while the cathode electrode is placed over a region far removed from the target, to avoid unwanted reverse effects. This region could be the contralateral hemisphere or, in some cases, even extracephalic locations like the neck, shoulder, or arm. Researchers have used smaller stimulation-electrode sizes and bigger reference-electrode sizes to offset the focality limitations of tDCS. With the increased recognized value of computational forward models in informing tDCS montage design and interpretation of results, there have been recent advances in modeling tools and a greater proliferation of publications (Bikson, Datta, Rahman, & Scaturro, 2010; DaSilva et al., 2012; Datta, Elwassif, Battaglia, & Bikson, 2008, 2010, 2011; Datta, Baker, Bikson, & Fridriksson, 2011; Datta, Bikson, & Fregni, 2010; Datta, Elwassif, & Bikson, 2009; Halko et al., 2011; Mendonca et al., 2011; Miranda, Lomarev, & Hallett, 2006, Miranda, Faria, & Hallett, 2009; Oostendorp et al., 2008; Parazzini, Fiocchi, Rossi, Paglialonga, & Ravazzani, 2011; Sadleir, Vannorsdall, Schretlen, & Gordon, 2010; Salvador, Mekonnen, Ruffini, & Miranda, 2010; Suh, Kim, Lee, & Kim, 2009; Turkeltaub et al., 2011; Wagner et al., 2007). Miranda et al. (2006) was the first numerical modeling effort specifically looking at tDCS montages and intensities. In another spherical head paper, focality of cortical electrical fields was compared across various small electrode configurations and configurations proposed to achieve targeted modulation (Datta et al., 2008). Wagner et al. (2007) was the first CAD (Computer Aided Design)-rendered head model where current density distributions were analyzed for various montages including healthy versus cortical stroke conditions. The more recent efforts have been mostly MRI derived. Oostendorp et al. (2008) was the first to consider anisotropy in the skull and the white matter; Datta et al. built the first high-resolution head model with gyri/sulci specificity (Datta, Bansal, et al., 2009); Suh et al. (2009) concluded that skull anisotropy causes a large shunting effect and may shift the stimulated areas; I. THE BASIS
90
4. COMPUTATIONAL MODELING ASSISTED DESIGN
Sadleir et al. (2010) compared modeling predictions of frontal tDCS montages to clinical outcomes; Datta et al. (2010) studied the effect of tDCS montages on TBI and skull defects; Parazzini et al. (2011) was the first to analyze current flow patterns across subcortical structures; and Dmochowski, Datta, Bikson, Su, and Parra (2011) showed how a multi-electrode stimulation can be optimized for focality and intensity at the target. Recent efforts have focused on building patient-specific models and comparing modeling predictions to experimental outcomes. In considering new electrode montages, and especially in potentially vulnerable populations (e.g., skull damage, children), forward models are the main tool used to relate the externally controllable dose parameters (e.g., electrode number, position, size, shape, current) to resulting brain current flow. While the specific software applications can vary across groups, in general the approach and workflow for model generation follow a similar pattern (Fig. 4.3). The steps for generating high-resolution (anatomically specific) forward models of non-invasive neuromodulation are adapted from extensive prior work on computational modeling. These involve the following.
FIGURE 4.3 Imaging and computational work-flow for the generation of highresolution individualized models. Though the specific processes and software packages will vary across technical groups and applications, in each case high-resolution modeling initiated with precise anatomical scans that allow demarcation of key tissues. Tissues with distinct resistivity are used to form “masks.” These masks, along with the representation of the physical electrodes, are “meshed” to allow FEM calculations. The boundary conditions (generally simply reflecting how the electrodes are energized) and the governing equations (related to Ohm’s law) are well established. The reproduction of the stimulation dose and the underlying anatomy thus allow for the prediction of resulting brain current. These current flow patterns are represented in a false-color map and analyzed through various post-processing tools.
I. THE BASIS
METHODS AND PROTOCOLS
91
1. Demarcation of individual tissue types (masks) from high-resolution anatomical data (e.g., magnetic resonance imaging slices obtained at 1-mm slice thickness) using a combination of automated and manual segmentation tools. Specifically, from the perspective of stimulating current flow, it is necessary to distinguish tissues by their resistivity. A majority of effort in the development and implementation of models has involved this step (see also next section). The number and precision of the individual masks obtained is pivotal for the generation of accurate 3D models in order to capture critical anatomical details that may influence current flow. 2. Modeling of the exact physical properties of the electrodes (e.g., shape and size) and precise placement within the segmented image data (i.e., along the skin mask outer surface). 3. Generation of accurate meshes (with a high quality factor) from the tissue/electrode masks whilst preserving resolution of subject anatomical data. The generation of meshes is a process where each mask is divided into small contiguous “elements” which allow the current flow to then be numerically computed – hence the term “finite element method” stimulations. In modern efforts, the number of elements in tDCS models can exceed 10 million. 4. Importing the resulting volumetric meshes into a commercial finite element (FE) solver. 5. Assigning resistivity to each mask (every element in each mask) and imposing boundary conditions, including the current applied to the electrodes. 6. Solving the standard Laplacian equation using the appropriate numerical solver and tolerance settings. In modern efforts the degrees of freedom can exceed 14 million. 7. Plotting the data as induced cortical electric field or current density maps (Fig. 4.3). Though each of the above steps is required for high-resolution modeling, there remains technical expertise and hence variation in protocols across groups and publications (Bikson et al., 2010; DaSilva et al., 2012; Datta et al., 2008, 2010, 2011; Datta, Bansal, et al., 2009; Halko et al., 2011; Mendonca et al., 2011; Miranda et al., 2006, 2009; Oostendorp et al., 2008; Parazzini et al., 2011; Sadleir et al., 2010; Salvador et al., 2010; Suh et al., 2009; Turkeltaub et al., 2011; Wagner et al., 2007). These variations are relevant to clinical practice only in the sense that they change predictions in current flow that meaningfully effect dose decisions. The sources and impact of these variations are addressed in the next section. Initial models of transcranial current flow assumed simplified geometries such as concentric spheres that could be solved analytically as well as
I. THE BASIS
92
4. COMPUTATIONAL MODELING ASSISTED DESIGN
numerically (Datta et al., 2008; Miranda et al., 2006). Such concentric sphere models are useful to address generic dose questions, such as the global role of inter-electrode distance, electrode montage, or the relationship between electrode and brain current density, precisely because they exclude regional anatomical differences. More realistic models started to include explicit representation of human anatomy (Wagner et al., 2007). Datta et al. (2009) published the first model of tDCS with gyri resolution, illustrating the importance of anatomical precision in determining complex brain current flow. Addition of diffusion tensor imaging (DTI) incorporates anisotropic properties in the skull and the white matter regions (Suh et al., 2009). Fine resolution of gyri/sulci leads to current “hotspots” in the sulci, thereby reinforcing the need for high-resolution modeling (Salvador et al., 2010). An open-source head model comprising several different tissue types was adapted to analyze current flow through cortical, subcortical, and brainstem structures (Parazzini et al., 2011). Such models help determine whether current of sufficient magnitude reaches the deeper subcortical structures. Only a few studies have attempted to more directly link clinical outcomes and model predictions – and thus validate model utility. Clinical evaluation was combined with model predictions to investigate the effects of different montages in clinical conditions such as fibromyalgia (Mendonca et al., 2011). Patient-specific models have been used to analyze, retrospectively, the therapeutic success of a given experimental stimulation montage (Datta et al., 2011) and compare model predictions with patterns of activation revealed by functional magnetic resonance imaging (fMRI) (Halko et al., 2011). Post-mortem “current flow imaging” was also used to validate general model predictions (Antal et al., 2012). A focalized form of tDCS, called 4 � 1 High-Definition tDCS, was developed through computational models and then validated in a clinical neurophysiology trial (Kuo et al., 2012). The focal delivery of current using the 4 � 1 montage was further validated using supra-threshold Transcranial Electrical Stimulation (tES) pulses (Edwards et al., 2013); moreover, the models predicted individual variation in sensitivity to currents’ delivery, among typical adults, of greater than two-fold. These example applications opened the door for potentially customizing tDCS on a subject to subject basis within the clinical setting (Datta, Truong, Minhas, Parra, & Bikson, 2012). Table 4.1 summarizes the various tDCS montages explored in computational modeling studies. In a subsequent section we describe avenues for clinicians to practically access and use computational modeling tools but precisely because this is now the “standard” models approach, limitations of varied approaches need to be understood. If tDCS continues to emerge as an effective tool in clinical treatment and cognitive neuroscience, and concurrent modeling studies emphasize the need for rational (and in cases individualized) dose decisions, then it will become essential for tDCS researchers to understand
I. THE BASIS
93
METHODS AND PROTOCOLS
TABLE 4.1 Synopsis of Analytical and Numerical tDCS Computer Models* Study
Masks
Electrode Montage
Additional Methods
Miranda et al. (2006)
4
4 montages
Datta et al. (2008)
4
6 montages
Dmochowski, Bikson, and Parra (2012) neuralengr.com/ spheres
4
Arbitrary, user-specific, optimized montages
5
Healthy and stroke models with varied montages
Oostendorp et al. (2008)
5
C3–SO montage
Anisotropic conductivities for skull and white matter. Model derived from Wolters et al. (2006)
Datta, Bansal, et al. (2009)
4
C3–SO and high-definition (HD) montages.
High resolution with gyri-sulci topography
Suh et al. (2009)
5
C3–C4 montage using pointsource stimulation electrodes
Anisotropic conductivity for white matter
Datta et al. (2009)
4
Tissue temperature increases of C3–SO montage and HD montage
Sadleir et al. (2010)
11
F3–SO and F4–SO montage and comparison to reported clinical outcomes in literature
Datta et al. (2010)
4
Effect of skull defects and skull plates for C3–SO and O1–SO montages
Bikson et al. (2010)
7
C3–SO and C3-contralateral mastoid
Effect of “return electrode” position and size
Salvador et al. (2010)
5
C3–SO montage
High-resolution gyrisulci model
Concentric sphere
CAD rendered Wagner et al. (2007) MRI derived
Continued
I. THE BASIS
94
4. COMPUTATIONAL MODELING ASSISTED DESIGN
TABLE 4.1 Synopsis of Analytical and Numerical tDCS Computer Models—cont’d Study
Masks
Electrode Montage
Additional Methods
Suh, Lee, Cho, Kim, and Kim (2010)
5
C3 HD-tDCS montage
Comparison of isotropy and anisotropy in white matter and skull
Parazzini et al. (2011)
26
Analysis of current flow through cortical, subcortical, and brainstem regions for C3–SO montage
Model derived from virtual family opensource database
Mendonca et al. (2011)
8
C3-extracephalic, SOextracephalic and C3–SO montages.
Correlation of clinical effects in a fibromyalgia study with model predictions
Halko et al. (2011)
7
Oz–Cz montage
Patient-specific visual stroke model of a hemianopia patient undergoing tDCS; correlation of highresolution current flow model predictions with fMRI
Datta et al. (2011)
8
Retrospective analysis comparing experimental outcome with model predictions; LFC-RS, LFCcontralateral mastoid, LFC-SO, and RFC-LS
Patient-specific left hemisphere stroke model of a tDCS responder
DaSilva et al. (2012)
15
C3–SO montage analysis of current flow through subcortical structures
High-resolution individualized model
Turkeltaub et al. (2011)
8
Analysis of left pTC and right pTC montage in dyslexia study
Bonsai – Model Solution Analyzer neuralengr.com/ bonsai
6–8
Healthy and stroke model with varied montages
Online database of solved patient-specific head models; overlaid views of 2D MRI scans and model solutions
Dmochowski et al. (2011)
6
Healthy Head models with need-specific montages
Two distinct selections, focality-based or intensity-based
Datta et al. (2012)
8
C3–SO and HD tDCS montage
Interindividual variation across three subjectspecific models
I. THE BASIS
PITFALLS AND CHALLENGES IN THE APPLICATION OF MODEL PREDICTIONS
95
TABLE 4.1 Synopsis of Analytical and Numerical tDCS Computer Models—cont’d Study
Masks
Electrode Montage
Additional Methods
Minhas et al. (2012)
8
C3–SO and C3 HD-tDCS montages
Pediatric Brain modeling
Truong, Magerowski, Blackburn, Bikson, and Alonso-Alonso (2013)
9
C3–SO, C3 HD-tDCS, IFG–SO montage
Comparison of five individuals of varying body mass index
Shahid, Wen, and Ahfock (2013)
9
C3–SO montage
Effect of modeling white matter anisotropy
*Summary of tDCS forward head models using FEM techniques. Head models have progressed from being sphericalbased to being MRI-derived. The most recent ones have employed patient-specific models. The second, third, and fourth columns list number of tissue types, the montage used, and particular model specifics, respectively. Abbreviations: C3, C4, F3, F4, O1, Oz, Cz correspond to 10/20 EEG system; SO, contralateral supra-orbital; LFC, left frontal cortex; RFC, right frontal cortex; RS, right shoulder; LS, left shoulder; pTC, posterior temporal cortex; IFG, inferior frontal gyrus.
the applications (and limitations) of computational forward models (Borckardt et al., 2012).
PITFALLS AND CHALLENGES IN THE APPLICATION AND INTERPRETATION OF COMPUTATIONAL MODEL PREDICTIONS Computational models of tDCS range in complexity from concentric sphere models to high-resolution models based on individuals’ MRIs (as described above). The appropriate level of modeling detail depends on the clinical question being asked, as well as the available computational resources. Whereas simple geometries (e.g., spheres) may be solved analytically (Rush & Driscoll, 1968), realistic geometries employ numerical solvers, namely Finite Element Methods (FEMs). Regardless of complexity, all forward models share the goal of correctly predicting brain current flow during transcranial stimulation to guide clinical therapeutic delivery. Special effort has been recently directed towards increasing the precision of tDCS models. However, it is important to note that increased model complexity does not necessarily equate with greater accuracy or clinical value. To meaningfully guide clinical utility, attempts to enhance model precision must rationally balance detail (i.e. complexity) and accuracy. First, beginning with high-resolution anatomical scans, the entire model workflow should preserve precision. Any human head model is limited by the precision and accuracy of tissue segmentation (i.e., “masks”) and of the
I. THE BASIS
96
4. COMPUTATIONAL MODELING ASSISTED DESIGN
assigned conductivity values. One hallmark of precision is that the cortical surface used in the final FEM solver should capture realistic sulci and gyri anatomy. Models incorporating gyri-level resolution, starting with Datta et al. (Datta, Bansal, et al., 2009), clearly show that current is “clustered” in local hot spots correlated with cortical folding. Second, simultaneously, a priori knowledge of tissue anatomy and factors known to influence current flow should be applied to further refine segmentation. We believe that particularly critical are discontinuities not present in nature that result from limited scan resolution; notably, both unnatural perforations in planar tissues (e.g., ventricular architecture, discontinuities in CSF where brain contacts skull, misrepresented skull fissures) and microstructures (e.g., incomplete or voxelized vessels) can produce significant deviations in predicted current flow. Moreover, because of the sensitivity of current flow to any conductivity boundary, increasingly detailed segmentation (e.g., globe of the eye and related structures, glands, and deeper midbrain structures) without reliable reported human conductivity values in literature (especially at static frequency) may also lead to errors. It is worth noting that the respective contribution of the automated/manual interventions also depends on: (1) sophistication of the particular database or automated algorithm employed since they are usually not optimized for forward transcranial modeling (Datta et al., 2011), and (2) the need for identification of anomalies in suspect populations like skull defects, lesions, shunts, etc. Thus, addition of complexity without proper parameterization can evidently decrease prediction accuracy. An improper balance between these factors can introduce distortions in predicted brain current flow. Divergent modeling methods illustrate existing outstanding issues, including: 1. Detail in physically representing the stimulation electrodes and leads, including shape and material (Datta, Bansal, et al., 2009), and energy source boundary conditions. The approach taken by our group is to model both the electrodes and electrolyte substrate, and to do so with realistic dimensions. Typical electrode/sponge sizes are either 5 � 5 cm (25 cm2) or 5 � 7 cm (35 cm2). Small circular highdefinition (HD) electrodes and gel are also modeled to either a 1- or 2-cm radius. Anode and cathode conditions are defined as an inward current density and ground, respectively. 2. Differences between conductivity values derived from static resistivity measures and those extrapolated from 10-Hz data. The data available in literature vary from source to source in acquisition method as well as numerical value. Some data are extrapolated from low-frequency impedance rather than true DC resistance, such as that found in Gabriel, Gabriel, and Corthout (1996). The values used by our group were originally derived from averaged
I. THE BASIS
PITFALLS AND CHALLENGES IN THE APPLICATION OF MODEL PREDICTIONS
3.
4.
5.
6. 7. 8.
9. 10.
97
values found in literature (Wagner, Zahn, Grodzinsky, & PascualLeone, 2004). Sufficient caudal head volume representation (such that the caudal boundary condition does not affect relevant model prediction), including potential use of synthetic volumes (Datta et al., 2011; Mendonca et al., 2011). Optimal imaging modalities/sequences to differentiate amongst tissue types. Typically, T1 MRIs are used to identify soft tissue such as gray and white matter, while T2 MRIs are especially usefully for fluid-filled lesions as a result of stoke, epilepsy, or traumatic brain injury. CT scans, when available, are excellent for bone and sinus cavities. As an alternative to individualized modeling, simulated MRI- and segmentation atlases-based averaged anatomical data are also available (http://brainweb.bic.mni.mcgill.ca/brainweb/). Appropriate incorporation of anisotropy (from DTI) if relevant (Sadleir & Argibay, 2007; Shahid et al., 2013; Suh et al., 2009). While inclusion of anisotropy produces a numerical change in predicted current flow these changes are qualitatively far less significant than precision in anatomy and tissue conductivity; moreover, how anisotropy is implemented profoundly influences the predicted relevance of inclusion, as much as complete omission(Shahid et al., 2013). Suitability of existing image segmentation algorithms (generally developed for other applications) (Smith, 2002). The degree and nature of manual correction. The adequacy of the numerical solver (especially when making detailed predictions at tissue boundaries). To verify precision, one can assess whether refining the mesh (e.g., doubling the number of elements) or varying the solver (either the method within one program, or comparing across program) significantly changes model predictions. When modeling defects/injury, detail in segmenting true lesion borders (Datta et al., 2011) versus idealized defects. The need for parametric and interindividual analysis (see below).
Optimization of the above issues remains an open question, and inevitably reflects available resources (e.g., imaging, computational, anatomical expertise) and the specific clinical question addressed in each modeling effort. Even as computational and engineering groups continue developing greater modeling sophistication, clinicians must be aware of the limitations in any modeling approach and the inevitability of technical methodology affecting the predictions made. Having mentioned the importance of balancing increased complexity with clinical access to modeling, it is fundamental to emphasize a difference between the “value” of adding precision (complexity) as it is
I. THE BASIS
98
4. COMPUTATIONAL MODELING ASSISTED DESIGN
evaluated in engineering papers versus clinical translation. Increasingly detailed computational approaches have been proposed in recent years of varying anatomical and physiological detail (Oostendorp et al., 2008; Parazzini et al., 2011; Parazzini, Fiocchi, & Ravazzani, 2012). At the same time, computational models indicate subject-specific variability in susceptibility to the same dose (Datta et al., 2012; Shahid et al., 2013), indicating the value of individualized modeling, or at least modeling across a set of archetypes. Real clinical translational utility must therefore balance the value of increased sophistication with the cost associated with clinical scanning, computational time, and human resources/intervention (e.g., manual correction/pre- and post-processing, etc.). Thus the question is not whether “different models will yield different predictions” (as must be posed in an engineering paper), but rather does increased complexity change model predictions in a way that is clinically meaningful – that is, will complexity influence clinical decisions in study design? While this is a complex and application-specific question, a first step toward systematizing value, across a myriad of groups and efforts, is to develop a metric of change versus a simpler approach, and then apply a threshold based on perceived clinical value and added cost versus the simpler approach. A priori, it is simplistically assumed that added detail/complexity will enhance model precision and, if done rationally, model accuracy (Bikson & Datta, 2012; Bikson, Rahman, & Datta, 2012). Though an engineering group can devote extended resources and time to a “case” modeling study, the myriad of potential electrode combinations (dose) and variation across a normal head (Datta et al., 2012) and pathological heads means that in clinical trial design the particular models will likely now be solved (e.g., 4 � 1 over FP3 in a female head). Moreover, while different models will yield different predictions, practical dose decision is based on a clinical study-specific criterion: “a meaningful clinical difference.” Thus, two clinical applications of modeling are considered: (1) Deciding across montages – namely, which montage is expected to achieve the optimal clinical outcomes (safety/efficacy) in a given subject or on average across subjects; (2) Deciding on dose variation across subjects – namely, if and how to vary dose based on subject-specific anatomy. These aspects of using computational models in clinical practice are addressed in subsequent sections. Therefore, additional complexity and detail in model generation is only clinically meaningful if it results in a different clinical decision being made based on the model with regard to dose and/or individualization; otherwise, the additional detail is “academic” since this detail adds complexity without impacting clinical decisions. Assuming accurate and precise representation of all tissue compartments (anatomy, resistivity, anisotropy) relevant to brain current flow, it is broadly assumed that, using modern numerical solvers, the resulting prediction is independent of the numerical technique used. Our own
I. THE BASIS
PITFALLS AND CHALLENGES IN THE APPLICATION OF MODEL PREDICTIONS
99
experience across various commercial solvers confirms this implicit assumption when meshes are of sufficient detail – precise description in methods (use of publically available programs) and representation of resulting mesh density and quality (in figures or methods), as well as tests using various solvers, provides explicit control for errors generated by the computation itself. Literature regarding forward modeling – or, more broadly, the dissemination of modeling analysis to the clinical hands – introduces still further issues with regard to (1) interpretability, reproducibility, and accuracy (tissue masks), and (2) graphical representation of regions of influence (degree of “activation”). As there is no standard protocol for tissue imaging or segmentation, diversity in the nature of resulting tissue masks will invariably influence predicted current flow. As such, it is valuable to illustrate each 3D tissue mask in publication methods and/or classified serial sections. With regard to representation of relative activation, studies employ either maps of current density (unit of A/m2) or electric field (unit of V/m). Because the two are related linearly by local tissue resistivity, when plotting activation in a region with uniform resistivity (for example, the cortical surface) the spatial profile is identical. When plotting activation across tissues (e.g., coronal section), current density may be advantageous to illustrate overall brain current flow. However, the electric field in the brain is directly related to neuronal activation (e.g., for varied resistivity, the electric field, but not current density, provides sufficient information to predict activation). Despite best efforts, figure preparation invariably restricts tissue mask perspectives and comprehensive display of volumetric current flow, which can be supplemented with online data publication (http://www.neuralengr.com/bonsai). When interpreting simulation predictions, it is important to recognize that the intensity of current flow in any specific brain region does not translate in any simple (linear) manner to the degree of brain activation or modulation (even when considering current direction). Moreover, recent neurophysiological studies indicate that changes in “excitability” may not be monotonic with stimulation (Lindenberg, Zhu, & Schlaug, 2012). For example, increasing stimulation amplitude or duration can invert the direction of modulation, as can the level of neuronal background activity (Nitsche & Paulus, 2001). However, to a first approximation, it seems reasonable to predict that regions with more current flow are more likely to be “affected” by stimulation while regions with little or no current flow will be spared the direct effects of stimulation. As a first step to understanding the mechanism of action of tDCS, a relationship between model predicted regional current flow and changes in functional activation was recently demonstrated (Halko et al., 2011). The “quasi-uniform” assumption considers that if the electric field (or current density) is uniform on the scale of a region/neuron of interest, then “excitability” may
I. THE BASIS
100
4. COMPUTATIONAL MODELING ASSISTED DESIGN
be modulated with local electric field intensity (Bikson et al., 2004; see also discussion in Datta et al., 2008 and Miranda, Correia, Salvador, & Basser, 2007). Though efforts to develop suitable biophysical detailed models considering myriad neurons with distinct positions and morphologies or “continuum” approximations (Joucla & Yvert, 2009) of modulation are pending, the current state of the art requires (implicit) application of the “quasi-uniform” assumption. Many of the theoretical and technical foundations for modeling brain stimulation were established through modeling studies on peripheral nerve stimulation (Functional Electrical Stimulation, FES) and then Spinal Cord Stimulation (SCS) and Deep Brain Stimulation (DBS) (reviewed in McIntyre, 2007; Holsheimer, 1998; Rattay, 1986). In light of the challenges to tDCS modeling cited above, we note that FES and DBS use electrodes implanted in the body such that relatively small volume of brain is needed to be modeled, and with none of the complications associated with precisely representing gross anatomy (e.g., skull, fat, CSF. . .). From the perspective of computational burden, the volume, number of masks, and mask complexity results in tDCS models with > 5 million elements, compared to < 200,000 elements for FES and DBS models. In addition, FES and DBS are suprathreshold, allowing modeling studies to represent simply demarcated “regions of influence” inside which action potentials are triggered. tDCS affects large areas of superficial and deep brain structures (many types of cells and processes) and is subthreshold, interacting with ongoing activity rather than driving action potentials, making it challenging to simply delineate “black-and-white” regions of influence. Forward modeling studies and analysis are often published as “case reports” with predictions only on a single head (Mendonca et al., 2011; Parazzini et al., 2011; Salvador et al., 2010; Turkeltaub et al., 2011). The suitability of single-subject analysis reflects available (limited) resources and the clinical question being addressed. For a given electrode montage and stimulation dose, the sensitivity of global brain current to normal variation in anatomy (including across ages, gender) is unknown; however, high-resolution modeling suggests gyri-specific dispersion of current flow, which could potentially account for individual variability. More generally, gross differences in tissue dimensions, notably skull thickness and CSF architecture, are expected to influence current flow. In some cases, modeling efforts specifically address the role of individual anatomical pathology, such as skull defects (Datta et al., 2010) or brain lesions (Datta et al., 2011); it is precisely because these studies have shown the importance of specific defect/lesion details, that findings cannot be arbitrarily generalized. This in turn stresses the importance of individualized modeling, as illustrated in the next section. Though this section has focused on the technical features of modeling, there is a broader concern in promoting effective collaboration between
I. THE BASIS
USE OF COMPUTATIONAL MODELS IN CLINICAL PRACTICE
101
engineers and clinicians. For analogy, clinicians are generally aware of the challenges and pitfalls in post-processing and feature-selection of fMRI data, and indeed are thus intimately involved in data analysis rather than blindly relying on a technician. For computational “forward” models of neuromodulation, where results may inform study design and patient treatment, it is evidently as important to consider the uses and technical limitations of modeling approaches, and vigilance and skepticism on the part of clinicians will only enhance model rigor. Critically, for this reason, clinician/investigator experience and “judgment” supersedes all model predictions, even as these models form one important tool in dose design.
USE OF COMPUTATIONAL MODELS IN CLINICAL PRACTICE Consideration for Efficacy Before beginning our sections regarding consideration for clinical practice, we note that the ability of clinicians to leverage computational models is limited by access to modeling tools. For clinicians who are interested in using computational forward models to inform study design or interpretation but do not have the time and resources to establish an independent modeling program (e.g., hire engineers), several options are available: 1. Collaboration with a modeling group (Turkeltaub et al., 2011) or a company can allow for customized exploration of montage options. 2. Existing published reports or databases (Table 4.1; www.neuralengr. com/bonsai) can be referenced for comparable montages (with careful consideration of the role of individual variation and other caveats presented in the next section). 3. With some coding experience, a novel process where a desired brain region can be selected and the optimized electrode montage is proposed within a single step (Dmochowski et al., 2011) can be used. 4. A GUI-based program to stimulate arbitrary electrode montages in a spherical model is now available (www.neuralengr.com/spheres). The latter solution illustrates an important trend: even as increasingly complex and resource-expensive modeling tools are being developed, parallel efforts to simplify and automate (high-throughput) model workflow are needed to facilitate clinical translation. With regard to efficacy, it is typically the case that scientists and clinicians identify one or more brain regions that they wish to modulate (e.g., based on fMRI and prior behavioral studies (Bikson, Rahman, Datta, Fregni, & Merabet, 2012; Coffman, Trumbo, & Clark, 2012; Dmochowski et al., 2013; Medina et al., 2013; Turkeltaub et al., 2012), and typically this
I. THE BASIS
102
4. COMPUTATIONAL MODELING ASSISTED DESIGN
modulation is expressed as a desire to enhance or inhibit function in the region. While this is a starting point for rational dose optimization using computational models, several additional parameters and constraints need to be specified. A central issue relates to the concern, if any, about current flow through other brain regions. In one extreme, current flow through other regions outside of those targeted is considered unimportant for trial outcomes; in such a case, the optimization would be for intensity at the target while ignoring details of current flow through other brain regions. Conversely, the requirement may be to minimize current flow through all other brain regions while maximizing current flow intensity in the targeted brain region; in this case, the optimization would be for focality. The reason this distinction between optimization for intensity and optimization for focality is so critical is that it produces highly divergent “best” dose solutions (Dmochowski et al., 2011). Optimization for intensity often produces a bipolar (one anode and one cathode) montage across the head; such montages typically produce broad current flow across both the target and other brain regions. Optimization for focality typically produces a “ring” montage (with one polarity surrounded by another, analogous to the HD-tDCS 4 � 1 [Datta, Bansal, et al., 2009]) that spares much of the brain regions outside of the target but also produces less relative current flow at the target than does optimization for intensity. Practically, though distinctions between optimization for intensity and optimization for focality must be made, the (iterative) process of dose optimization may be subtler. Certain brain regions outside of the target may be “neutral” regarding collateral stimulation, others may be “avoid” regions, and others may in fact be considered “beneficial” to the outcomes. The best montage therefore is highly dependent on both the trial design outcomes and the experimenter’s opinion on how distinct brain regions are implicated. A second critical parameter to consider in trial design is the desired electric field intensity at the target(s). As emphasized throughout this review, optimization based on the electric field at the target is expected to produce more consistent outcomes then optimization by external current intensity. Nonetheless, an experimenter may choose to select a current level (e.g., 1 mA, 2 mA) simply because of historical experience and trends. It is important to emphasize that, at least for neurophysiological measures (such as transcranial magnetic stimulation, TMS) and likely for behavioral and clinical outcomes, the relationship between current and outcomes is not linear and not necessarily monotonic (Batsikadze, Moliadze, Paulus, Kuo, & Nitsche, 2013; Weiss & Lavidor, 2012) – meaning that reversing current direction (at the level of electrodes and the brain) may not reverse the direction of change, and increasing current intensity may not increase (and can even reverse) the direction of change. The effects of stimulation may vary with the brain region (e.g., prefrontal may not respond as motor)
I. THE BASIS
CONSIDERATION FOR SAFETY
103
or the state of that region (e.g., is there ongoing activity [due to a concurrent task] or pathology [due to injury or disease; Hasan et al., 2013]?) in ways that remain poorly understood. In general, more applied current does not necessarily mean more brain changes, and thus the decision regarding what current intensity is desired is a complex and critical one for outcomes. The same challenges apply to selecting a desired brain electric field where a higher electric field at a target may not produce increased neuromodulation or more of the type of change desired; moreover, increasing electric-field intensity at the target by increasing applied current will increase electric field intensity at every other brain region proportionally. Finally, the orientation of the electric field at the target may be critical, and, depending on the orientation, different montages may be considered. Though the above paints an increasingly complex picture of dose optimization in tDCS, it may be unwise to simply ignore these issues and use “historical” montages (e.g., whatever is popular in the literature) and not leverage computational models to the extent possible to optimize dose. In the face of complexity (and risk), experimenters may wish simply to revert to using what has already been reported as successful in the literature, but such an approach seems inconsistent with broader efforts to advance the field, especially when these previous approaches did not involve optimization (and indeed a very limited set of montages are used across highly disparate indications). Nonetheless, given the complexity and unknowns, historical montages do represent a good starting point for dose optimization. Practically, we recommend that the optimization process begins by simulating previously used successful and unsuccessful montages to consider the brain current flow patterns generated in each case; it is against these standard montages that any optimized montage can be compared. Safety parameters provide additional constraint parameters for optimization, as discussed below.
CONSIDERATION FOR SAFETY Computational models also provide a tool to support assessment of safety. tDCS is considered a well-tolerated technique (Brunoni et al., 2012), but vigilance is always warranted with an investigational tool; moreover, given that most montages produce current flow through many brain regions, combined with the desire to explore increasing intensities and durations/repetitions of treatment, as well as stimulation in susceptible subjects (e.g., children), computational models (though only predictions) provide quantitative methods to increase confidence and identify hazards.
I. THE BASIS
104
4. COMPUTATIONAL MODELING ASSISTED DESIGN
We distinguish effects at the skin (which relate largely to electrode design/electrochemical issues and electrode current density) from effects at the brain (which relate to electric fields in the brain) (Bikson, Datta, & Elwassif, 2009). Computational models predict current flow at both the skin and the brain. Often, dose design simply avoids crossing (or even approaching) a threshold for intensity in any given region both inside and outside the target. This threshold is often based on historical approaches. Here, the distinction between dose optimization based only on stimulation parameters (e.g., total current) versus brain electric field (with leveraged computational models) is evident. Maintaining applied current (e.g., 1 mA) but changing electrode montage and/or subject inclusion (e.g., skull defects) may profoundly change current density/electric field in the skin and brain. Computational models are thus useful to relate new montages/approaches to historically safe ones. It is often the case that even when current density/electric field is predicted, the experimenter still used the upper limit of applied current. Thus, maximum current density/electric field and maximum current intensity become constraints in the efficacy optimization process.
CONSIDERATION FOR INDIVIDUAL DOSE TITRATION There are two general uses for computational models in designing rational experiments and clinical trials. The first is the selection of the best generic dose as discussed above. The second point to consider is whether and how to customize doses to individual subjects. Even across normal healthy adults there is a > 2 � difference in the electric field generated in the brain for a given applied current (Datta et al., 2012; Edwards et al., 2013). This variation is potentially profoundly significant when considering that two-fold changes in applied current can invert the direction of change (see above). Therefore, anatomical differences, even across healthy adults, may explain some of the known variation in existing tDCS studies, and normalizing for brain electric field across subjects, by leveraging computational models, may in part correct for individual differences. When considering extremes of age (Minhas, Bikson, Woods, Rosen, & Kessler, 2012) or body mass (Truong, Magerowski, Pascual-Leone, Alonso-Alonso, & Bikson, 2012), or the presence of variable brain or skull injuries (Datta et al., 2010), the potential for individual differences to influence current flow increases (Dmochowski et al., 2013). While it is not unusual for tDCS montages to be changed based on individual disease etiology (e.g., stroke location), this is often done using basic rules of thumb (e.g., position the “active” electrode over the brain region), which may not always produce the desired brain current flow (Datta et al., 2011).
I. THE BASIS
EXAMPLE RESULTS OF COMPUTATIONAL ANALYSIS
105
The need to normalize (wide) individual variations in response to tDCS is universally recognized (along with the desire to increase efficacy), and it is rational that normalizing the brain electric field should help to reduce variability, since the brain electric field determines outcomes. Yet the use of computational models for individual optimization is rare, and limited by accessibility to rapid modeling tools. We note that the value of individualization is evident in TMS studies in the visual and motor domains, where it is almost unheard of to apply the same intensity across subjects. It is no less important in tDCS, but because tDCS does not produce an overt physiological response such as TMS does, computational models are valuable tools to individualize doses.
EXAMPLE RESULTS OF COMPUTATIONAL ANALYSIS IN SUSCEPTIBLE POPULATIONS We conclude this chapter with some case studies to illustrate the application of computational models for informing clinical guidelines.
Case 1: Skull Defects There is interest in the application of tDCS during rehabilitation of patients with brain lesions or skull defects (i.e., with or without skull plates) – for example, subjects with traumatic brain injury (TBI) or patients undergoing neurosurgery. As some of the neurological sequelae are presumably consequences of disrupted cortical activity following the traumatic event, the use of tDCS to deliver current to both damaged and compensatory regions in such circumstances can be a useful tool to reactivate and restore activity in essential neural networks associated with cognitive or motor processing. In addition, because of the reported antiseizure effects of tDCS (Fregni et al., 2006), this technique might be useful for patients with refractory epilepsy who have undergone surgery and have skull plates or decompressive craniectomy for trauma and cerebrovascular disease. Despite rational incentives for investigation of tDCS in TBI or patients with other major neurological deficits and skull defects, one perceived limitation for the use of tDCS in these patients is the resulting modification of current flow by the skull defects and the presence of surgical skull plates. Modeling studies can provide insight into how skull defects and skull plates would affect current flow through the brain, and how to modify tDCS dose and/or electrode locations in such cases (Fig. 4.4, adapted from Datta et al., 2010). For example, a skull defect (craniotomy) that is filled with relatively highly conductive fluid or tissue represents a “shunt”
I. THE BASIS
106
4. COMPUTATIONAL MODELING ASSISTED DESIGN
FIGURE 4.4 Computational model of current flow in subjects with skull defects/ plates. A defect in skull tissue, which is the most resistive tissue in the head, would hypothetically affect current flow in the underlying brain regions. Furthermore, the exact location of the defect (under/between the stimulation pads) in combination with the “material” filling up the defect with the stimulation montage employed will influence induced current flow. Sample segmentation masks are shown on the left. A small defect under the anode pad (top right) leads to current flow in the cortex restricted to directly under the defect (avoiding the intermediate regions). A similar sized defect placed between the pads (bottom right) does not significantly alter current flow patterns in comparison with a healthy head with no defects. Figure adapted from Datta et al. (2010).
pathway for current entering the brain, but in a manner highly dependent on defect position relative to electrode montage. In such cases, the underlying cortex would then be exposed to a higher intensity of focused current flow. This in turn might be either beneficial in targeting the underlying brain region, or hazardous if the increased current levels resulted in undesired neurophysiologic or pathological changes. Our modeling results confirm the notion that skull defects and skull plates can change the distribution of the current flow induced in cortical areas by tDCS. However, the details of current modulation depend entirely on the combination of electrode configuration and nature of the defect/ plate, thus indicating the importance of individual analysis. Based on model predictions, application of tDCS without accounting for skull defects can lead to suboptimal and undesired brain current.
Case 2: Brain Lesions (Stroke) Transcranial DCS has been shown to modulate cognitive, linguistic, and motor performance in both healthy and neurologically impaired individuals, with results supporting the feasibility of leveraging interactions
I. THE BASIS
EXAMPLE RESULTS OF COMPUTATIONAL ANALYSIS
107
between stimulation-induced neuromodulation and task execution As emphasized throughout this review, electrode montage (i.e., the position and size of electrodes) determines the resulting brain current flow and, as a result, neurophysiological effects. The ability to customize tDCS treatment through electrode montage provides clinical flexibility and the potential to individualize therapies. However, while numerous reports have been published in recent years demonstrating the effects of tDCS upon task performance, there remain fundamental questions about the optimal design of electrode configuration, especially around lesioned tissue (Datta et al., 2011; Fridriksson, 2011). Several modeling studies have predicted a profound influence of stroke-related brain lesions on resulting brain current produced by tDCS (Datta et al., 2011; Halko et al., 2011; Wagner et al., 2007). Fig. 4.5 illustrates an example of predicted current flow during tDCS from two subjects with a lesion due to stroke located within the motorfrontal cortex (A) and occipital cortex (B) (adapted from Datta et al., 2011 and Halko et al., 2011). Computational modeling suggests that current flow pattern during tDCS may be significantly altered by the presence of the lesion as compared to intact neurological tissue. Importantly, significant changes in the resulting cortical electric fields were observed not just around peri-lesional regions but also within wider cortical regions beyond the location of the electrodes. In a sense, the lesion itself acts as a “virtual” electrode modulating the overall current flow pattern (Datta et al., 2011).
Case 3: Pediatric Populations There is increasing interest in the use of neuromodulation in pediatric populations for a range of indications, including rehabilitation, cognitive performance, and epilepsy treatment (Krause & Cohen Kadosh, 2013; Mattai et al., 2011; Schneider & Hopp, 2011; Varga et al., 2011). However, a rational protocol/guideline for the use of tDCS on children has not been formally established. Previous modeling studies have shown that current flow behavior is dependent on both the tDCS dose (montage and current intensity) and the underlying brain anatomy. Because of anatomical differences (skull thickness, CSF volume, and gray/white matter volume) between a growing child and an adult, it is expected that the resulting brain current intensity in a child would be different as compared to that in an adult. Evidently, it would not be prudent to adjust the stimulation dose for children through an arbitrary rule of thumb (e.g., reduce electrode size and current intensity by the ratio of head diameter). Again, computational forward models provide direct insight into the relation between external tDCS dose and resulting brain current, and thus can
I. THE BASIS
108
4. COMPUTATIONAL MODELING ASSISTED DESIGN
FIGURE 4.5 Computational models predict current flow during tDCS in subjects with lesions. Brain lesions, as occur during stroke, are considered to be largely cannibalized and replaced by CSF, which is significantly more conductive than brain. For this reason, brain current flow during tDCS is expected to be altered. (A) Patient-specific left hemisphere stroke model. Two stimulation montages are illustrated: a conventional sponge montage (top right), and a high-definition montage (bottom right). (B) Patient-specific visual stroke model. Segmentation masks (left) and induced current flow using the experimental montage (right).
I. THE BASIS
EXAMPLE RESULTS OF COMPUTATIONAL ANALYSIS
109
FIGURE 4.6 Individualized head model of two adolescents as compared to an adult: induced current flow for motor cortex tDCS at different intensities. 1 mA of stimulation in the adolescent is similar to 2 mA of stimulation in an adult.
inform dose design in children. Fig. 4.6 shows an example of a model of tDCS in a 12-year-old compared to a standard adult model. Both the peak and spatial distributions of current in the brain are altered compared to the typical adult case. In fact, for this particular case, the peak electric fields, at a given intensity, were nearly double in the 12-year-old as compared to the adult. Though questions remain about the impact of gross anatomical differences (e.g., as a function of age or gender) in altering generated brain current flow during neuromodulation, computational “forward” models provide direct insight into this question, and may ultimately be used to rationally adjust stimulation dose.
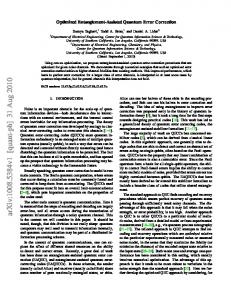
Case 4: Obese Populations Montages that have been evaluated for pain, depression, or appetite suppression have been modeled in average adults, but unique challenges exist in the obese model (Fig. 4.7, adapted from Truong et al., 2012). The additional subcutaneous fat present in the obese model warranted an additional layer of complexity beyond the commonly used five-tissue model (skin, skull, CSF, gray matter, white matter). Including fat in the model of a super-obese subject led to an increase in cortical electric field magnitude of approximately 60 percent compared to the model without
I. THE BASIS
110
4. COMPUTATIONAL MODELING ASSISTED DESIGN
FIGURE 4.7 Predicted cortical electric field during inferior prefrontal cortex stimula-
tion via 500 � 700 pads. Two conditions, homogenous skin (A.1) and heterogeneous skin (A.2), are contrasted on the same scale (0.364 V/m per mA peak). The homogeneous skin condition is displayed (A.3) at a lowered scale (0.228 V/m per mA peak) to compare the spatial distribution to the heterogeneous condition (A.2). The effect due to a range of varying fat conductivities (B.1–B.8) is compared on a fixed scale (0.364 V/m per mA peak). The conductivity of fat (0.025 S/m) is within an “optimum” range of influence that causes an increase in peak cortical electric field when included. Figure adapted from Truong et al. (2012).
fat (Fig. 4.7A.1–A.3). A shift was also seen in the spatial distribution of the cortical electric field, most noticeably on the orbito-frontal cortex. To gain an intuition regarding how subcutaneous fat influences the cortical electric field and current density, additional models examined a range of conductivity values from the conductivity of skull (0.010 S/m, Fig. 4.7B.1) to the conductivity of skin (0.465 S/m, Figure 4.7B.8). Coincidentally, the conductivity commonly used for fat (0.025 S/m, Fig. 4.7B.4) was in the range that causes a peak increase in cortical electric field magnitude. It was postulated that more current was blocked by subcutaneous fat at an extremely low conductivity (4.7B.1), while more current was redirected at an extremely high conductivity. This, in effect, led to an “optimum” range of influence where the conductivity of fat is believed to reside. Ultimately, the need to precisely parameterize models rests hand in hand with the intended use of the model. From an engineering perspective, the increased complexity of this model caused a noteworthy change within the subject modeled, but this change would not be clinically noteworthy if the stimulation dose were not to change from subject to subject. This clinical analysis requires an additional comparison between subjects,
I. THE BASIS
CONCLUSION
111
and consideration of the wide variation already inherent in “typical” subjects (Datta et al., 2012). What can be concluded, however, is that a comparison between models would require consistent parameterization of subcutaneous fat.
Case Design These cases demonstrate the potentially profound influence of lesions and skull defects on resulting current flow, as well as the need to customize tDCS montages to gross individual head dimensions. If tDCS continues to become a viable option for treatment in cases such as chronic stroke, the consideration of tDCS-induced current flow through the brain is of fundamental importance for the identification of candidates, optimization of electrotherapies for specific brain targets, and interpretation of patient-specific results. Thus, the ability and value of individualized tDCS therapy must be leveraged. Whereas tDCS electrode montages are commonly designed using “gross” intuitive general rules (e.g., anode electrode positioned “over” the target region), the value of applying predictive modeling as one tool in the rational design of safe and effective electrotherapies is becoming increasingly recognized. Electrode montage (i.e., the position and size of electrodes) determines the resulting brain current flow and, as a result, neurophysiological effects. The ability to customize tDCS treatment through electrode montage provides clinical flexibility and the potential to individualize therapies (Bikson et al., 2010; Datta et al., 2011; Mendonca et al., 2011). However, while numerous reports have been published in recent years demonstrating the effects of tDCS upon task performance, there remain fundamental questions about the optimal design of electrode configurations, with computational “forward” models playing a pivotal role.
CONCLUSION While numerous published reports have demonstrated the beneficial effects of tDCS upon task performance, fundamental questions remain regarding the optimal electrode configuration on the scalp. Moreover, it is expected that individual anatomical differences, in the extreme case manifest as skull defects and lesioned brain tissue, will consequently influence current flow and should therefore be considered (and perhaps leveraged) in the optimization of neuromodulation therapies. Variance in clinical responses may result from many sources, but the alteration of brain current flow due to both normal and pathological causes can be elucidated through computational “forward” models, which can then be leveraged to individualized therapy.
I. THE BASIS
112
4. COMPUTATIONAL MODELING ASSISTED DESIGN
References Antal, A., Bikson, M., Datta, A., Lafon, B., Dechent, P., Parra, L. C., et al. (2012). Imaging artifacts induced by electrical stimulation during conventional fMRI of the brain. NeuroImage. http://dx.doi.org/10.1016/j.neuroimage.2012.10.026. Ardolino, G., Bossi, B., Barbieri, S., & Priori, A. (2005). Non-synaptic mechanisms underlie the after-effects of cathodal transcutaneous direct current stimulation of the human brain. Journal of Physiology, 568, 653–663. Batsikadze, G., Moliadze, V., Paulus, W., Kuo, M. F., & Nitsche, M. A. (2013). Partially nonlinear stimulation intensity-dependent effects of direct current stimulation on motor cortex excitability in humans. The Journal of Physiology, 591(Pt 7), 1987–2000. Bikson, M., & Datta, A. (2012). Guidelines for precise and accurate computational models of tDCS. Brain Stimulation, 5(3), 430–431. Bikson, M., Datta, A., & Elwassif, M. (2009). Establishing safety limits for transcranial direct current stimulation. Clinical Neurophysiology, 120(6), 1033–1034. Bikson, M., Datta, A., Rahman, A., & Scaturro, J. (2010). Electrode montages for tDCS and weak transcranial electrical stimulation: Role of “return” electrode’s position and size. Clinical Neurophysiology, 121(12), 1976–1978. Bikson, M., Inoue, M., Akiyama, H., Deans, J. K., Fox, J. E., Miyakawa, H., et al. (2004). Effects of uniform extracellular DC electric fields on excitability in rat hippocampal slices in vitro. Journal of Physiology, 557, 175–190. Bikson, M., Rahman, A., & Datta, A. (2012). Computational models of transcranial direct current stimulation. Clinical EEG and Neuroscience, 43(3), 176–183. Bikson, M., Rahman, A., Datta, A., Fregni, F., & Merabet, L. (2012). High-resolution modeling assisted design of customized and individualized transcranial direct current stimulation protocols. Neuromodulation, 15(4), 306–315. Borckardt, J., Bikson, M., Frohman, H., Reeves, S., Datta, A., Bansal, V., et al. (2012). A pilot study of the tolerability, safety and effects of high-definition transcranial direct current stimulation (HD-tDCS) on pain perception. The Journal of Pain, 13(2), 112–120. Brunoni, A. R., Nitsche, M. A., Bolognini, N., Bikson, M., Wagner, T., Merabet, L., et al. (2012). Clinical research with transcranial direct current stimulation (tDCS): Challenges and future directions. Brain Stimulation, 5(3), 175–195. Coffman, B. A., Trumbo, M. C., & Clark, V. P. (2012). Enhancement of object detection with transcranial direct current stimulation is associated with increased attention. BMC Neuroscience, 13, 108. DaSilva, A., Zaghi, S., Lopes, M., DosSantos, M., Spierings, E., Bajwa, Z., et al. (2012). tDCSinduced analgesia and electrical fields in pain-related neural networks in chronic migraine. Headache, 52, 1283–1295. Datta, A., Baker, J. M., Bikson, M., & Fridriksson, J. (2011). Individualized model predicts brain current flow during transcranial direct-current stimulation treatment in responsive stroke patient. Brain Stimulation, 4(3), 169–174. Datta, A., Bansal, V., Diaz, J., Patel, J., Reato, D., & Bikson, M. (2009). Gyri-precise head model of transcranial direct current stimulation: Improved spatial focality using a ring electrode versus conventional rectangular pad. Brain Stimulation, 2, 201–207. Datta, A., Bikson, M., & Fregni, F. (2010). Transcranial direct current stimulation in patients with skull defects and skull plates: High-resolution computational FEM study of factors altering cortical current flow. NeuroImage, 52(4), 1268–1278. Datta, A., Elwassif, M., Battaglia, F., & Bikson, M. (2008). Transcranial current stimulation focality using disc and ring electrode configurations: FEM analysis. Journal of Neural Engineering, 5(2), 163–174. Datta, A., Elwassif, M., & Bikson, M. (2009). Bio-heat transfer model of transcranial DC stimulation: Comparison of conventional pad versus ring electrode. Conference proceedings: . . . Annual International Conference of the IEEE Engineering in Medicine and Biology, 2009, 670–673.
I. THE BASIS
REFERENCES
113
Datta, A., Truong, D., Minhas, P., Parra, L. C., & Bikson, M. (2012). Inter-individual variation during transcranial direct current stimulation and normalization of dose using MRIderived computational models. Front in Psychiatry, 3, 91. Dmochowski, J. P., Bikson, M., & Parra, L. C. (2012). The point spread function of the human head and its implications for transcranial current stimulation. Physics in Medicine and Biology, 57(20), 6459–6477. Dmochowski, J. P., Datta, A., Bikson, M., Su, Y., & Parra, L. C. (2011). Optimized multielectrode stimulation increases focality and intensity at target. Journal of Neural Engineering, 8(4), 046011. Dmochowski, J. P., Datta, A., Huang, Y., Richardson, J. D., Bikson, M., Fridriksson, J., et al. (2013). Targeted transcranial direct current stimulation for rehabilitation after stroke. NeuroImage, 75, 12–19. Edwards, D., Cortes, M., Datta, A., Minhas, P., Wassermann, E. M., & Bikson, M. (2013). Physiological and modeling evidence for focal transcranial electrical brain stimulation in humans: A basis for high-definition tDCS. NeuroImage, 74, 266–275. Edwards, D. J., Krebs, H. I., Rykman, A., Zipse, J., Thickbroom, G. W., Mastaglia, F. L., et al. (2009). Raised corticomotor excitability of M1 forearm area following anodal tDCS is sustained during robotic wrist therapy in chronic stroke. Restorative Neurology and Neuroscience, 27(3), 199–207. Fregni, F., Thome-Souza, S., Nitsche, M. A., Freedman, S. D., Valente, K. D., & Pascual-Leone, A. (2006). A controlled clinical trial of cathodal DC polarization in patients with refractory epilepsy. Epliepsia, 47(2), 335–342. Fridriksson, J. (2011). Measuring and inducing brain plasticity in chronic aphasia. (Research Support, N.I.H., Extramural Review). Journal of Communication Disorders, 44 (5), 557–563. Gabriel, C., Gabriel, S., & Corthout, E. (1996). The dielectric properties of biological tissues: I. Literature survey. Physics in Medicine and Biology, 41(11), 2231–2249. Halko, M. A., Datta, A., Plow, E. B., Scaturro, J., Bikson, M., & Merabet, L. B. (2011). Neuroplastic changes following rehabilitative training correlate with regional electrical field induced with tDCS. NeuroImage, 57(3), 885–891. Hasan, A., Misewitsch, K., Nitsche, M. A., Gruber, O., Padberg, F., Falkai, P., et al. (2013). Impaired motor cortex responses in non-psychotic first-degree relatives of schizophrenia patients: A cathodal tDCS pilot study. Brain Stimulation, 6(5), 821–829. Holsheimer, J. (1998). Computer modelling of spinal cord stimulation and its contribution to therapeutic efficacy. Spinal Cord, 36(8), 531–540. Joucla, S., & Yvert, B. (2009). The “mirror” estimate: An intuitive predictor of membrane polarization during extracellular stimulation. (Research Support, Non-U.S. Gov’t). Biophysical Journal, 96(9), 3495–3508. Krause, B., & Cohen Kadosh, R. (2013). Can transcranial electrical stimulation improve learning difficulties in atypical brain development? A future possibility for cognitive training. Developmental Cognitive Neuroscience. http://dx.doi.org/10.1016/j. dcn.2013.04.001. Kuo, H. I., Bikson, M., Datta, A., Minhas, P., Paulus, W., Kuo, M. F., et al. (2012). Comparing cortical plasticity induced by conventional and high-definition 4 x 1 ring tDCS: A neurophysiological study. Brain Stimulation, 6(4), 644–648. Lindenberg, R., Zhu, L. L., & Schlaug, G. (2012). Combined central and peripheral stimulation to facilitate motor recovery after stroke: The effect of number of sessions on outcome. Neurorehabilitation and Neural Repair, 26(5), 479–483. Mattai, A., Miller, R., Weisinger, B., Greenstein, D., Bakalar, J., Tossell, J., et al. (2011). Tolerability of transcranial direct current stimulation in childhood-onset schizophrenia. Brain Stimulation, 4(4), 275–280. McIntyre, C. C., Miocinovic, S., & Butson, C. R. (2007). Computational analysis of deep brain stimulation. Expert Review of Medical Devices, 4(5), 615–622.
I. THE BASIS
114
4. COMPUTATIONAL MODELING ASSISTED DESIGN
Medina, J., Beauvais, J., Datta, A., Bikson, M., Coslett, H. B., & Hamilton, R. H. (2013). Transcranial direct current stimulation accelerates allocentric target detection. Brain Stimulation, 6(3), 433–439. Mendonca, M. E., Santana, M. B., Baptista, A. F., Datta, A., Bikson, M., Fregni, F., et al. (2011). Transcranial DC stimulation in fibromyalgia: Optimized cortical target supported by high-resolution computational models. Journal of Pain, 12(5), 610–617. Minhas, P., Bikson, M., Woods, A. J., Rosen, A. R., & Kessler, S. K. (2012). Transcranial direct current stimulation in pediatric brain: A computational modeling study. Conference proceedings: . . . Annual International Conference of the IEEE Engineering in Medicine and Biology, 2012, 859–862. Miranda, P. C., Correia, L., Salvador, R., & Basser, P. J. (2007). The role of tissue heterogeneity in neural stimulation by applied electric fields. Conference proceedings: . . . Annual International Conference of the IEEE Engineering in Medicine and Biology, 2007, 1715–1718. Miranda, P. C., Faria, P., & Hallett, M. (2009). What does the ratio of injected current to electrode area tell us about current density in the brain during tDCS? Clinical Neurophysiology, 120(6), 1183–1187. Miranda, P. C., Lomarev, M., & Hallett, M. (2006). Modeling the current distribution during transcranial direct current stimulation. Clinical Neurophysiology, 117(7), 1623–1629. Nitsche, M. A., & Paulus, W. (2001). Sustained excitability elevations induced by transcranial DC motor cortex stimulation in humans. Neurology, 57, 1899–1901. Oostendorp, T. F., Hengeveld, Y. A., Wolters, C. H., Stinstra, J., van Elswijk, G., & Stegeman, D. F. (2008). Modeling transcranial DC stimulation. Conference proceedings: . . . Annual International Conference of the IEEE Engineering in Medicine and Biology, 2008, 4226–4229. Parazzini, M., Fiocchi, S., & Ravazzani, P. (2012). Electric field and current density distribution in an anatomical head model during transcranial direct current stimulation for tinnitus treatment. Bioelectromagnetics, 33(6), 476–487. Parazzini, M., Fiocchi, S., Rossi, E., Paglialonga, A., & Ravazzani, P. (2011). Transcranial direct current stimulation: Estimation of the electric field and of the current density in an anatomical head model. IEEE Transactions on Bio-Medical Engineering, 58(6), 1773–1780. Peterchev, A., Wagner, T., Miranda, P., Nitsche, M., Paulus, W., Lisanby, S., et al. (2011). Fundamentals of transcranial electric and magnetic stimulation dose: Definition, selection, and reporting practices. Brain Stimulation. http://dx.doi.org/10.1016/j.brs.2011.10.001, 1 Nov. Rattay, F. (1986). Analysis of models for external stimulation of axons. IEEE Transactions on Biomedical Engineering, 33(10), 974–977. Rush, S., & Driscoll, D. A. (1968). Current distribution in the brain from surface electrodes. Anesthesia and Analgesia, 47(6), 717–723. Sadleir, R., & Argibay, A. (2007). Modeling skull electrical properties. Annals of Biomedical Engineering, 35(10), 1699–1712. Sadleir, R. J., Vannorsdall, T. D., Schretlen, D. J., & Gordon, B. (2010). Transcranial direct current stimulation (tDCS) in a realistic head model. NeuroImage, 51(4), 1310–1318. Salvador, R., Mekonnen, A., Ruffini, G., & Miranda, P. C. (2010). Modeling the electric field induced in a high resolution head model during transcranial current stimulation. Conference proceedings: . . . Annual International Conference of the IEEE Engineering in Medicine and Biology, 2010, 2073–2076. Schneider, H. D., & Hopp, J. P. (2011). The use of the bilingual aphasia test for assessment and transcranial direct current stimulation to modulate language acquisition in minimally verbal children with autism. Clinical Linguistics & Phonetics, 25(6–7), 640–654. Shahid, S., Wen, P., & Ahfock, T. (2013). Numerical investigation of white matter anisotropic conductivity in defining current distribution under tDCS. Computer Methods and Programs in Biomedicine, 109(1), 48–64.
I. THE BASIS
REFERENCES
115
Smith, S. M. (2002). Fast robust automated brain extraction. (Comparative Study Research Support, Non-US Government Review). Human Brain Mapping, 17(3), 143–155. Suh, H. S., Kim, S. H., Lee, W. H., & Kim, T. S. (2009). Realistic simulation of transcranial direct current stimulation via 3-D high resolution finite element analysis: Effect of tissue anisotropy. Conference proceedings: . . . Annual International Conference of the IEEE Engineering in Medicine and Biology, 2009, 638–641. Suh, H. S., Lee, W. H., Cho, Y. S., Kim, J. H., & Kim, T. S. (2010). Reduced spatial focality of electrical field in tDCS with ring electrodes due to tissue anisotropy. Conference proceedings: . . . Annual International Conference of the IEEE Engineering in Medicine and Biology, 1, 2053–2056. Truong, D. Q., Magerowski, G., Blackburn, G. L., Bikson, M., & Alonso-Alonso, M. (2013). Computational modeling of transcranial direct current stimulation (tDCS) in obesity: Impact of head fat and dose guidelines. NeuroImage Clinical, 2, 759–766. Truong, D. Q., Magerowski, G., Pascual-Leone, A., Alonso-Alonso, M., & Bikson, M. (2012). Finite element study of skin and fat delineation in an obese subject for transcranial direct current stimulation. Paper presented at the 34th Annual International Conference of the IEEE Engineering in Medicine and Biology Society, Conference proceedings: . . . Annual International Conference of the IEEE Engineering in Medicine and Biology Society, 2012, 6587–6590. Turkeltaub, P. E., Benson, J., Hamilton, R. H., Datta, A., Bikson, M., & Coslett, H. B. (2011). Left lateralizing transcranial direct current stimulation improves reading efficiency. Brain Stimulation, 5, 201–207. Turkeltaub, P. E., Benson, J., Hamilton, R. H., Datta, A., Bikson, M., & Coslett, H. B. (2012). Left lateralizing transcranial direct current stimulation improves reading efficiency. Brain Stimulation, 5(3), 201–207. Varga, E. T., Terney, D., Atkins, M. D., Nikanorova, M., Jeppesen, D. S., Uldall, P., et al. (2011). Transcranial direct current stimulation in refractory continuous spikes and waves during slow sleep: A controlled study. Epilepsy Research, 97(1–2), 142–145. Wagner, T., Fregni, F., Fecteau, S., Grodzinsky, A., Zahn, M., & Pascual-Leone, A. (2007). Transcranial direct current stimulation: A computer-based human model study. NeuroImage, 35(3), 1113–1124. Wagner, T. A., Zahn, M., Grodzinsky, A. J., & Pascual-Leone, A. (2004). Three-dimensional head model simulation of transcranial magnetic stimulation. IEEE Transactions on Biomedical Engineering, 51(9), 1586–1598. Weiss, M., & Lavidor, M. (2012). When less is more: Evidence for a facilitative cathodal tDCS effect in attentional abilities. Journal of Cognitive Neuroscience, 24(9), 1826–1833. Wolters, C. H., Anwander, A., Tricoche, X., Weinstein, D., Koch, M. A., & MacLeod, R. S. (2006). Influence of tissue conductivity anisotropy on EEG/MEG field and return current computation in a realistic head model: A simulation and visualization study using highresolution finite element modeling. NeuroImage, 30(3), 813–826. Zentner, J. (1989). Noninvasive motor evoked potential monitoring during neurosurgical operations on the spinal cord. Neurosurgery, 24, 709–712.
I. THE BASIS