Computer Availability, Computer. Experience and Technophobia Among. Public School Teachers. Larry D. Rosen. California State University, Dominguez Hills.
Pergamon
Computers in Human Behavior, Vol. 11, No. 1, pp. 9-31, 1995 Copyright © 1994 Elsevier Science Ltd Printed in the USA. All rights reserved 0747-5632/95 $9.50 + .00
074%5632(94)00018-2
Computer Availability, Computer Experience and Technophobia Among Public School Teachers Larry D. Rosen California State University, Dominguez Hills
Michelle M. Weft Chapman University
A b s t r a c t - - Since Time named the microcomputer their "Man of the Year" in
1983 there has been a continued drive for public school teachers to become computer literate. A nationwide study concluded that although teachers have increased computer availability in their classrooms, they are not integrating computers into the standard curricula. The present study examined "technophobia" as an explanation for low levels of computer utilization. Elementary teachers (N = 171), secondary science teachers (N = 117), and secondary humanities teachers (N = 200) in 54 schools across five urban school districts completed three measures of technophobia and a measure of demographic characteristics, computer/technology experience, computer availability, and current computer use. Results indicated that: (1) computers are available at all schools, but are not being used by many teachers; (2) many teachers are technophobic, particularly elementary teachers and secondary humanities teachers; (3) teachers are most worried about dealing with the actual computer machinery in their classroom, about computer errors, and about learning to use computers; and (4) predictive models showed that although Requests for reprints should be addressed to Larry D. Rosen, Professor of Psychology, California State University, Dominguez Hills, CA 90747.
10
Rosen and Weil computer experience is the most prominent predictor of technophobia, it is not the only predictor - - age, gender, teaching experience, computer availability, ethnicity, and school socioeconomic status also play an important role in predicting technophobia. Implications of these results are discussed in terms of the long-term effects that technophobie teachers will have on their current and future students.
In 1983, Time named the microcomputer the "Man of the Year" while the National Commission on Excellence in Education announced that computing would be treated by our schools as the fourth basic skill along with reading, writing, and arithmetic. By that fall more than 50,000 public schools were using microcomputers, more than double the number from only 1 year prior (Tucker, 1985). By 1985, 82% of all elementary schools and 93% of all secondary schools offered computer instruction (Naiman, 1988). By 1988 there were nearly 2 million computers in public schools (Martinez & Mead, 1988) and by 1990 each K-6 elementary school was estimated to have nearly 20 computers, while each high school was estimated to have nearly 45 computers (Becker, 1991; Pelgrum & Plomp, 1991). Becker's (1991) study of 1,416 U.S. schools showed that the number of computers in schools had risen steadily in the 6 years between 1983 and 1989, adding between 300,000 and 400,000 new computers per year. This rise in the use of computer technology has been accompanied by rules and regulations governing the credentialing of teachers. For example, California mandated in the 1988 Title 5 Regulations that all "clear" credentialed teachers show evidence of coursework in the use of computers including: (a) issues surrounding computer-based education; (b) knowledge of basic computer operations and terminology; (c) demonstrated ability to use computer hardware, software and system components; (d) demonstrated ability to use specific applications such as word processing, databases, spreadsheets, telecommunications, etc; and (e) demonstrated ability to integrate computer-based education into the curriculum (Section 44161.7, California Education Code). With this decade-old emphasis on computing in the classroom one would expect to find students and teachers hunched over their computer consoles chattering excitedly about bits and bytes, DO loops, and other computer jargon. However, a recent report by Educational Testing Service (ETS; Martinez & Mead, 1988) has shown that this is simply not true. This nationwide study of 24,000 public school students in grades 3, 7, and 11 produced discouraging results about the "Fourth R." Although the study showed a strong increase in weekly computer usage from low levels in 1983 (16% of the elementary and 13% of the secondary students used computers at least once a week) to higher levels in this 1986 data collection (48% of the 3rd grade students, 40% of the 7th grade students, and only 20% of the llth grade students used computers weekly), the authors concluded that "in general, computers have not been integrated into the standard curricula." (Martinez & Mead, 1988, p. 35). Quoting results from the International Association for the Evaluation of Educational Achievement (IEA) "Computers in Education" Survey in 1989, Becker (1991) concluded that "Yet, in spite of the changes that computers have brought to schools, only a small minority of teachers and students can be said to be major computer users" (p. 405-406). In a recent study of the etiology of technophobia, Weil, Rosen, and Wugalter (1990) remarked that "... the early role modeling of technology by people who are
Technophob& teachers
11
not themselves comfortable with technology can be predictive of later technological discomfort." (p. 376). Weil et al. concluded that "this study has demonstrated an important role played by attitudes of the 'introducers' of technology. This suggests that computerphobia may be reduced if early computer experiences are introduced by a person who holds a positive attitude about technology and feels skilled and comfortable with computers." (p. 377). In the ETS report, older children were asked who had helped them the most to learn how to use a computer. By far the most common response was the school teacher (49% for Grade 7; 48% for Grade 11). The ETS study also queried 837 computer coordinators at the same schools as the study's student sample. Although this sample represented only a 50% voluntary response rate the results were staggering enough to force the study's authors to conclude that "many school coordinators have minimal training in computer studies and rate themselves as mediocre in their ability to use computers." (Martinez & Mead, 1988, p. 3). If the computing coordinators feel underprepared and inadequate to teach computing where does this leave the elementary or secondary teacher who suddenly finds boxes containing a computer, a monitor, and a printer deposited in the classroom? Worse, where does this leave the students? Will computer education follow the path of mathematics education where researchers (c.f., Berebitsky, 1985) have documented the causal relationship between math anxiety, the teachers' lack of math skills, and their own math anxiety?
Empirical Studies of Technophobia Through studies of thousands of college students, business people, elementary and secondary teachers, and students, Rosen and Weil (1990) have defined technophobia as including: "(a) anxiety about current or future interactions with computers or computer-related technology; (b) negative global attitudes about computers, their operation or their societal impact; and/or (c) specific negative cognitions or selfcritical internal dialogues during actual computer interaction or when contemplating future computer interaction." (p. 276). In their recent meta-analytic study of computerphobia, Rosen and Maguire (1990) reported only nine empirical studies of elementary and secondary teachers. In perhaps the largest study of school teachers to date, Heller and Martin (1987) used a Stages of Concern model to assess 495 teachers from three suburban east coast school districts. Heller and Martin found that the teachers from each district showed the same pattern of personal concern that characterizes a nonuser profile, regardless of computer experience, usage, or training. This profile reflects a person whose personal concerns about implementing the computer technology outweigh concerns about actually using the computer in the classroom. This type of person is one who will not successfully use the computer until personal concerns are abated. In two earlier studies (Bannon, Marshall & Fluegal, 1985; Lumsden & Norris, 1985), researchers found that teachers and administrators in their Denton, TX and St. Louis, MO school districts responded quite positively to attitudinal questionnaires about plans for educational computing. However, when Norris and Lumsden (1984) asked a series of questions that decreased the functional distance between the teacher and computer, they found quite different results. When Norris and Lumsden asked if computers are valuable tools and whether teachers should know how to use computers in their classroom over 80% of the educators agreed. In contrast, when asked reactions to the direct statement "I would like to have a computer for use in my classroom" only 66% agreed. This result was corroborated by two
12
Rosen and Well
other studies (Stevens, 1980; Stimmel, Cormor, McCaskill & Durrett, 1981), which found that teachers, student teachers, and educators were less than comfortable with computer technology. Both authors reported that the student teachers had particularly noticeable negative affect concerning computer implementation in the classroom. Recently, Summers (1988) found that 42% of a sample of 111 primary teacher trainees had negative feelings about computers. Finally, Lichtman (1979) found that teachers viewed computers as more dehumanizing than other segments of the population and that teachers were concerned about many aspects of the introduction of computers into the school system. Several researchers have attempted to relate teachers' negative affect about computers with a variety of variables. Loyd and Loyd (1985) and Issa and Lorentz (1989) found that computer experience and computer exposure were negatively related to computer anxiety and positively related to computer attitudes. A study of vocational agriculture teachers (Kotrlik & Smith, 1989) revealed that five variables were needed to predict computer anxiety including teacher's level of computer skills, principal's support of computer use, computer availability at school, perceived mathematical ability, and formal computer training. In addition, two research studies (Kotlrlik & Smith, 1989; Loyd & Gressard, 1986) reported that female teachers had more computer anxiety than male teachers. A number of researchers have examined the attitudes of preservice teachers (students who plan to become teachers) with a variety of common and conflicting conclusions. While some studies (Baylor, 1985; Liu, Reed & Phillips, 1990; Violato, Marini & Hunter, 1989) found female preservice teachers to be more anxious than males, others (Koohang, 1987; Mertens & Wang, 1988) found no gender differences. In most studies, the general conclusion was that those preservice teachers with more computer experience showed less computer anxiety. Finally, two researchers (Summers, 1988; Liu et al., 1990) noted that many preservice teachers were highly apprehensive about computers and technology.
Technophobia Interventions There is a widely held belief among computer educators that lack of experience with computers is the cause of technophobia. With this in mind, many researchers have proposed to reduce computer anxiety through computer training. Honeyman and White (1987) reported that for teachers with little computer experience, state anxiety did not decrease over the first 30 hours of instruction, but did diminish after an additional 30 class hours. Kelly (1983) reported on a class in word processing to overcome computer anxiety while Sutphin (1987) proposed a complete inservice model that focused on curriculum, theory, and sociological/psychological issues. Several authors have reported decreased anxiety and/or improved attitudes after a computer literacy course with inservice teachers (Cicchelli, Baecher & Nygren, 1984; Ernest & Lightfoot, 1986; Madsen & Sebastiani, 1987; Overbaugh & Reed, 1990) and preservice teachers (Baylor, 1985; Robinson, Mikkelsen, & Ellermeyer, 1987; Thompson, 1985). Finally, Gressard and Loyd (1985) showed decreased anxiety and increased confidence and liking for computers after participation in a staff development program. In contrast to the studies that suggest intensive, computer inservice instruction as a solution to the problem, Rosen and Maguire's (1990) meta-analysis showed that computer experience does not eliminate technophobia. Analysis of studies of college students and business people showed that past experience is inversely related
Technophobic teachers
13
to technophobia, but this is confounded because technophobes actively avoid computer interaction and thus comprise the group that has little computer experience. During forced computer interaction, technophobes took more time, committed more errors and performed more poorly than others. Many increased their anxiety, negative beliefs, and future avoidance after forced computer interaction. As an alternative solution, Rosen and Maguire (1990) report two studies (Heinssen, 1987; Weil, Rosen, & Sears, 1987) demonstrating that psychological intervention techniques are successful in eliminating uncomfortable reactions to computers and technology and decreasing the negative anticipatory responses to future computer interaction while increasing confidence and positive attitudes toward computer technology use. Bloom and Hautaluoma (1990) have also shown that these psychological techniques may be appropriate when the software is relatively difficult to use.
The Present Study As computers becomes more available in the classroom, it is imperative to clarify the reactions that teachers have to the technology. This study was designed to assess technophobia in the public school system in a large, urban area. Unlike previous studies which limited the definition of "technophobia" to a single dimension (either computer anxiety or some measure of computer attitudes), this study examined the three-dimensional structure of technophobia as suggested in Rosen and Weil (1990), thus providing a broader base of information. The present study also assessed the computer availability, past computer experience, and current computer use among elementary and secondary school teachers and examined the ability of computer/technology experience, current computer use, computer availability, teaching experience, school socioeconomic status, and demographic characteristics to predict the teachers' level of technophobia on each of the three dimensions.
METHOD
Subjects
Pilot study. During the 1987-1988 school year a pilot study was undertaken to modify the three measures of technophobia (Computer Anxiety Rating Scale, Computer Thoughts Survey, and Attitudes Toward Computers Scale; Rosen, Sears, & Weil, 1987a) used in previous research. The measures, originally created and validated with college students, were modified to include additional items reflecting areas of concern for school teachers. The measures were then administered to teachers in six schools in a large, urban school district in southern California. Based on data collected on 102 teachers, the measures were judged to be both valid and reliable and were used in the present study.
Study sample. During the 1988-1989 school year 2066 technophobia questionnaires were distributed to 54 schools across five urban school districts in southern California. This distribution represented a "convenience" sample based on the willingness of the school principal to allow the researchers to distribute the questionnaires. The survey packet included the three modified technophobia measures (corresponding to Rosen and Weil's [1990] three-dimensional definition of technophobia)
14
Rosen and Weil
and a short questionnaire that assessed demographic data, prior and current computer/technology experience, and computer availability (school and personal). The entire survey required 20-45 minutes and was completed on the teacher's own time. With a 25% response rate, 485 questionnaire surveys were completed. Although low by absolute standards, this is a remarkable return rate given the length of the questionnaire, the sensitivity of the topic, and an impending teacher's strike and c o n c o m i t a n t work slowdown for much of the 1988-1989 academic year. Preliminary analyses allowed the researcher to combine the results of the pilot study with these data to comprise a total sample of 587 teachers from 60 schools. It should be noted that the 587 teachers did not form a representative sample of all teachers in the five school districts. The fact that participation was voluntary suggests that the sample may be biased, although the direction of that bias is not apparent. On the one hand, it is possible that teachers who are technophobic might be hesitant to complete any survey dealing with computers, while on the other hand, the survey topic ("Attitudes Toward Computers") might have attracted teachers who were uncomfortable with technology and wanted an avenue to vent that discomfort. This latter potential source of bias should have produced lengthy comments at the end of the survey where participants were asked: "Do you have any further comments about your attitudes and/or feelings about computers and other forms of technology?" However, only 3% of the sample responded with negative comments. The 587 school teachers were predominantly female (67%) averaging 44 years of age (range 20-65 years old) with 17 years of teaching experience (range from 1-40 years). The sample was composed mainly of Caucasian (81%) secondary teachers (61%) with a sizable representation of elementary teachers (29%) and teachers who crossed the traditional elementary/secondary boundaries (6%). The schools themselves adequately represented all levels of financial status including affluent (9%), middle income (63%) and lower income (28%). Preliminary analyses indicated vast differences between elementary teachers (Kindergarten through 6th grade; N = 171) and secondary teachers (7th grade through 12th grade; N = 317), and further differences between secondary science teachers (including computers, mathematics, and business courses; N = 117) and those who teach secondary humanities (including history, English, physical education, art, applied topics, remedial education courses; N = 200). Thus, all additional data were analyzed separately for these three groups. (Note: an additional 99 teachers, who taught across the traditional science/humanities boundaries, were eliminated from all analyses). Data were collected mainly from two school districts. District A (N = 350 teachers from 29 schools) is among the largest in the nation with over 30,000 K-12 teachers, while District B (N = 204 teachers from 27 schools) is a smaller district with approximately 1000 K-12 teachers. District A has more schools in low income neighborhoods while District B's schools are typically situated in middleincome neighborhoods. Both districts are comprised of more than twice as many female teachers as male teachers with District A including more of an ethnic mix of teachers (60% White, 21% Black, 11% Hispanic, 7% Asian) than District B (94% White teachers). Although in both districts the teachers averaged around 45 years of age, teachers in District A averaged 11 years of district service compared to 16 years in District B. Some data were available on computerization in the two major districts. In District A, there were 16,849 computers with 57% found on secondary school campuses. The computers on elementary campuses were more often found in the class-
Technophobic teachers
15
room with computer labs on some campuses; computers on secondary campuses were most often found in computer labs with computers in some classrooms. The majority of secondary campuses had two computer labs, one with 30 computers and another with between 10 and 30 computers, yielding a ratio of 70 students per computer. In those elementary classrooms that had computers, the ratio was 24 students to each computer. In District B, there were 1076 computers in Grades K-8 and 769 in Grades 9-12. This yields a ratio of one computer per 12 students in Grades K-8 and one computer per 8 students in Grades 9-12. Again, most computers in the lower grades are found in the classroom and those in the upper grades are found in computer labs. Instrumentation
Technophobia measures. The Computer Anxiety Rating Scale Form T (CARS-T), the Attitudes Toward Computers Scale Form T (ATCS-T), and the Computer Thoughts Survey Form T (CTS-T) included appropriate original items plus new items specifically geared to issues surrounding computer implementation for school teachers (e.g., anxiety about unpacking and setting up a new computer or attitudes about how computers allow students to work independently). The CARST consists of 75 items each rated on a 1 (not at all) to 5 (very much) scale that reflects how anxious or nervous each item makes the rater feel at this point in time. The CTS-T includes 50 items rated on the same 1 to 5 scale reflecting how often the rater has the specified thoughts when using or thinking about using a computer. Twenty three of the items reflected positive cognitions and 27 displayed negative cognitions. The ATCS-T includes 45 items on a five-point Likert scale (strongly agree to strongly disagree) where the teacher rated his/her general attitude toward computers and technology. Eighteen items were phrased in the positive direction and 27 were phrased in the negative direction to balance for response biases. Individual items, reliability, and validity of the original scales has been reported earlier (Rosen et al., 1987a, 1987b) and were examined for the modified scale prior to any data analyses.
Demographic, computer~technology experience, computer availability, and current computer use questionnaire. A two-page questionnaire examined: (a) demographic characteristics (gender, age, years taught, ethnic background, grade level and subject matter taught, and income level of the school); (b) prior computer/technology experience in eight areas (automatic banking, word processing, as a student, learning programming, on the job, in a library, playing video arcade games, and playing computer games) plus a single self-rating of computer knowledge; (c) computer availability in three areas (computer in the classroom, computers available for teacher use at school, computers available for student use at school); and (d) current computer use in three areas (teacher use of computers at school, teacher uses computers with students, and teacher owns a personal computer). The computer availability and current computer use items were all answered Yes or No while the prior computer/technology experience questions were answered on a 1 to 4 scale to reflect how often each item was used in the past (1 = never, 2 = 1-2
16
Rosen and Weil
times, 3 = 3-5 times, and 4 = 6 or more times). Self-rated computer knowledge was on a 5-point scale (1 = much lower than average, 2 = below average, 3 = average, 4 = above average, and 5 = much higher than average). This questionnaire also included three questions designed to assess validity of the expanded technophobia measures. Subjects were asked to rate their current attitude about computers (very negative, negative, neutral, positive or very positive), their current level of anxiety and confidence about computers (both used a fivepoint scale: very low, low, moderate, high, very high).
Reliability and validity. Each of the three technophobia measures included the original items contained in the CARS, CTS, and ATCS as described by Rosen et al. (1987a) plus additional items related specifically to teachers. Cronbach's alpha, computed for each of the expanded measures, showed comparable and somewhat higher alpha coefficients than for the original measures in two validation studies reported in Rosen et al. (1987a) and for a large-scale study of freshman university students at six universities across the United States (Weil & Rosen, 1992): (a) CARS-T tx = 0.98 (compared with 0.97 in the validation study; 0.92 in the nationwide study); (b) CTS-T o~ = 0.96 (compared with 0.93 and 0.91); and (c) ATCS-T t~ = 0.86 (compared with 0.76 and 0.60). The intercorrelation matrix also showed much more overlap between the three measures than in the original work with college students: (a) CARS-T vs. CTS-T r = -0.67 (compared to -0.35 and -0.51); (b) CARS-T vs. ATCS-T r = -0.39 (compared to -0.29 and -0.39); and (c) CTS-T vs. ATCS-T r = 0.60 (compared to 0.46 in the nationwide study; NOTE: these two measures were not compared in the validation study). Construct validity was assessed by examining correlations between the three technophobia measures and the three "validation" items (anxiety, attitudes, and confidence) from the questionnaire. The CARS-T was significantly correlated with the "anxiety validation item" (r = 0.67, p < 0.001) and this correlation was higher than with either of the other validation items. Similarly, the ATCS-T was significantly and most highly correlated with the "attitude validation item" (r = 0.60, p < 0.001). Although no prediction was made, it was expected that the CTS-T would be more highly correlated with the "attitude" and "confidence" validation items than the "anxiety validation" item. This was supported with significant correlations between the CTS-T and the "attitude validation item" (r = 0.73, p < 0.001) and the "confidence validation item" (r = 0.68, p < 0.001). Based on the data from 958 students across seven studies, Rosen et al. (1987b) delineated levels of "technophobia" including no technophobia, low technophobia, and high technophobia for each of the three measures. These delineations were based on the distributional characteristics of each measure and were validated in a clinical treatment study (Weil et al., 1987; Rosen, Sears, & Weil, 1993). For the present study, the distributional characteristics of the measures were compared to the normative data in Rosen et al. (1987b) and then the scores marking each level of technophobia were extrapolated to include scores from the augmented scales. Procedure
Five research assistants contacted school principals in local school districts to gain permission to distribute the survey. When a principal agreed, an arrangement was made to deliver and collect surveys. In most cases, surveys were placed directly in teachers' mailboxes with a sealed box to collect them when completed. The cover page of each
Technophobic teachers
17
questionnaire packet included an informed consent declaration that assured the teacher of anonymity and informed her about the general nature of the questionnaires. Each packet began with the consent form, was followed by one of six counterbalanced arrangements of the technophobia measures, and concluded with the Demographic, Computer Experience, Computer Availability and Current Computer Use Questionnaire. Completed questionnaire packets were dispersed roughly equally among the six counterbalanced orders. Since no significant differences in any measures were found between the questionnaire packets all packets were combined to form the study sample.
RESULTS
The results of this study will be described in four areas: (a) demographic differences between the elementary teachers and the two groups of secondary teachers, (b) computer availability and current computer use, (c) level of technophobia, and (d) predictive models of technophobia.
Demographic Differences Between Groups Table 1 presents the demographic data for the three teacher groups. Only two significant demographic differences were seen between the three groups. As might be expected from the pool of available subjects, there were more female elementary teachers (84%) than either female secondary humanities teachers (61%) or female secondary science teachers (45%). Although the F-test showed a significant between-group difference in age, Scheff'e's Test indicated that no groups differed significantly. All other characteristics were similar between the two groups.
Table 1. Sample Demographic Data for Elementary, Secondary Science, and Secondary Humanities Teachers Secondary Teachers Demographic
Characteristic
Elementary Teachers (N= 171)
Science Humanities (N= 117) (N= 200)
Significance Test
Gender: Male Female
Age: Teaching experience:
16% 84% 44.56 17.28
55% 45% 44.58 16.76
39% 61% 42.33 16.28
49.32**
8% 5% 5% 81% 1%
9% 6% 4% 78% 4%
5% 7% 4% 84% 1%
8.08
7% 58% 29%
7% 69% 24%
9% 65% 26%
5.42
3.02* 0.39
Ethnic background:
Asian Black
Hispanic White Other School Socioeconomic Level: Affluent Middle income Low income
Note. Chi-square tests are reported for percentages; F-tests for means. *p < .05; **p < .001.
18
Rosen and Weil
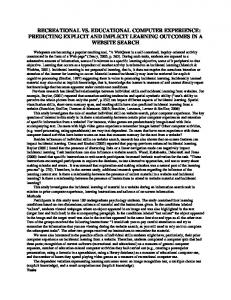
Computer Availability and Computer Use Teachers were asked several questions about computer availability on their school campus including whether computers were available for student use on campus, whether they used computers with their students, whether computers were available for the teacher's own personal use on campus, and whether the teacher personally used computers on campus. These data are displayed in Figure 1. The top half of the figure displays the availability and utilization data with students as reported by the three teacher groups while the bottom half of the figure report the data for teacher use. As expected from the data supplied by the school districts, the dark bars in the top half of Figure 1 show that at both the elementary and secondary levels, nearly all schools had computers available for student use. However, as is evident from the striped bars, even though computers were available for student use on the school campus, quite a few teachers did not use computers with the students. In addition, there was a large difference between the teacher groups in utilization of computers with students [Z2(2, N -- 488) -- 40.94, p < 0.001]. Nearly two-thirds of the elementary teachers used computers with their students compared to only one-third of the secondary humanities teachers. The secondary science teachers fell between these two groups with 43% using computers with their students. This difference may be due to the fact that while 52% of the elementary teachers had computers in their classrooms, only 37% of the secondary science teachers and 27% of the secondary humanities teachers had computers in their classrooms. The bottom half of Figure 1 shows computer availability for teacher use at school and actual teacher use of computers at school. Although computers were available to nearly all teachers at all schools, roughly half the teachers used computers at their elementary or secondary school. Teachers who used computers with their students were compared with those who did not on each of the demographic variables. Several differences were found. First, more white elementary teachers (71%) used computers with students than nonwhite elementary teachers [47%; ;~2(1, N = 169) - 6.64, p < 0.01]. Second, more white secondary humanities teachers (36%) used computers with students than nonwhite secondary humanities teachers [18%; Z2(1, N = 200) = 3.92, p < 0.05]. Third, elementary teachers with more teaching experience were less likely to personally use computers (r = -0.21, p < 0.01). Fourth, male secondary science teachers (94%) were more likely to personally use computers than female secondary science teachers [81%; ~2(1, N = 117) = 4.38, p < 0.05]. Thus, across all three groups, teaching experience was only related to personal computer use for elementary teachers, gender was only related to personal computer use for secondary science teachers and ethnicity was related to computer use with students for elementary teachers and secondary humanities teachers. Teacher age was not related to computer use for any teacher group.
Technophobia Based on normative data from thousands of college students on the three technophobia measures, teachers were categorized as having either no technophobia, low technophobia, or high technophobia based on their CARS-T, CTS-T, and GATCST scores (Rosen et al., 1987a). Table 2 displays this distribution for the three teacher groups including the means and standard deviations for each measure. For com-
Technophobic teachers
19
T E A C H E R C O M P U T E R USE W I T H S T U D E N T S 100~
80~
60~ ,~
e f.t
40~
20g~
i"
Og~
Elementary Teachers
o
Secand~ry' Science Teachers
Secondary Humlnities Teachers
I
I I CornputersA',~lebleforStudentUse [] Tether UsesComputersWithStudents
T E A C H E R C O M P U T E R USE A T S C H O O L
'~ (p0Q ==,=
°ej C
~ 0
L 41
Elementary' Teachers
Secondary Science Te~ohers
Secondtury Hum~ities Teachers
I : ComputersA',,,'~lebleforTe~eherUse= SchoolI TeecherUsesComputersat School
Figure 1. Percentage of schools with computers available for student use and percentage of teachers who use computers with students (top panel). Percentage of schools with computers available for teacher use and percentage of teachers who use computers at school (bottom panel).
parison purposes, the far right column of Table 2 presents data averaged over eleven studies with 2,940 university students in nearly 100 courses at six universities (Rosen & Weil, 1992). The top three rows of Table 2 show teachers and university students divided into no technophobia, low technophobia, and high technophobia based on their scores
Rosen and Weil
20
Table 2. Percentage of Teachers Who Demonstrated No, Low, or High Technophobia with Comparison Normative Data From College Students* Secondary Teachers Level of Technophobia No technophobia Low technophobia High technophobia Technophobia measures: CARS b Mean SD CTSb Mean SD ATCSb Mean SD
Elementary Teachers
Science
Humanities
University Studentsa
48% 30% 22%
65% 24% 11%
56% 27% 17%
65% 10% 25%
139.71 46.98
117.56 45.01
131.60 49.11
155.48 53.44
185.27 33.21
199.23 29.87
189.70 34.42
190.35 34.78
155.03 14.05
154.98 14.29
152.15 18.21
151.02 12.85
*Including means and standard deviations from all samples. aBased on data from 11 studies of 2940 university students. bTeacher measures were modified and lengthened versions of the university student measures, so means for university students are scaled to correspond to increased length.
on the three technophobia measures. A person was classified as having "high technophobia" if he/she scored in the high technophobia range on any of the three measures. A person was classified as having "no technophobia" if he/she scored in the no technophobia range all three measures. All other people were classified as having low technophobia since they scored in the low range on at least one measure and did not score in the high range on any of the three measures. Three points are worth noting. First, over half of the elementary teachers and between one-third and one-half of the secondary teachers were technophobic. Compared with the university students, the elementary teachers and secondary humanities teachers showed more technophobia while the secondary science teachers showed slightly less. Second, when the low and high technophobic groups are combined and compared with the no technophobic group, there is a significant difference between the teacher groups [Z2(2, N = 487) = 8.16, p < 0.05] with more technophobic elementary teachers (52%) compared to secondary humanities teachers (44%) and secondary science teachers (35%). Third, these percentages suggest that there may be more low technophobic teachers than there are low technophobic university students when compared with the normative data presented in Table 2. There also may be comparable numbers of high technophobic elementary teachers and university students but fewer high technophobic secondary humanities teachers and secondary science teachers than university students. Individual items were examined on each of the three measures to determine where the highest levels of technophobia occurred. Table 3 displays the ten items on the CARS that teachers reported as the most anxiety producing. As seen in Table 3, only 12 different items were represented in the top ten items for the three groups showing strong agreement in the anxiety-producing situations for all school teachers. These 12 items formed three coherent groupings with "anxiety about
Technophobic teachers
21
Table 3. Ten Computer Anxiety Rating Scale Items Generating the Most Anxiety Among Elementary, Secondary Science and Secondary Humanities Teachers
Secondary Teachers Computer Anxiety Item Put in charge of a computer lab Unable to receive info - - computer down Learning to write computer programs Dealing with computer billing errors Unpack and set up new computer Dealing with computer record errors Apply for job with computer training Getting error messages from computer Helping teacher who has computer trouble Using calculator with statistical functions Reading computer manual Thinking about taking computer class
Elementary Teachers
Science
Humanities
1 2 3 4 5 6 7
2 1 9 3 8 4 6
1 2 4 3 7 5
8
5
6
9 10
7 --
9 8
w
10 --
-10
Note. The numbers represent the top ten most-anxiety provoking items for each group with "1" showing the highest CARS-T score and "10" the tenth highest CARS-T score.
computers on the job" and "anxiety about computer errors" accounting for eight of the first nine items for elementary teachers and secondary science teachers and seven of the first nine items for secondary humanities teachers. The remaining items appeared to reflect "anxiety about learning to use computers." On the CTS-T the items that showed the most negative cognitions were consistent across groups. The teachers did not think that: "computers will help me learn faster," "computers make learning more interesting," "I can be more creative with the computer, .... I'm excited," "I feel competent," "I like playing on the computer, .... computers will help me get ahead," and "this (the computer) will shorten my work." On the GATCS-T two items were viewed with uniformly negative attitudes. Teachers strongly agreed that "in the future there will still be jobs that don't require computer skills" and "it takes a logical mind to learn to program a computer." Predictive Models
Stepwise multiple regressions were examined for each of the three technophobia measures using all demographics, usage, availability, and experience measures as predictors. These results are displayed in Table 4. For each group Table 4 lists two columns of numbers. The first column indicates the order in which variables were entered into the Stepwise Regression equation with all variables having a significant F-score at p < 0.05 and 0.05 < p < 0.10 listed. (NOTE: Variables that were entered into the equation with a significance level between the 0.05 and 0.10 level have their step number enclosed in parentheses.) The second column of Table 4 lists the simple correlation between the predictor and the dependent variable. The following three subsections examine each technophobia measure separately followed by an analysis that integrates the three measures into levels of technophobia. For each analysis predictors include computer/technology experience, current computer utilization, computer availability, gender, teaching experience, ethnicity and school socioeconomic status. Age was not included in these analyses due to its high correlation with teaching experience for all three groups (between 0.75 and 0.83).
Rosen and Well
22
Table 4. Stepwiae Regression Predictors of Computer Anxiety, Computer Cognitions, and Computer Attitudes Secondary Teachers Elementary Teachers Dependent Variables/Predictors Computer anxiety: Computer/technology experience Current computer use Computer availability Gender Teaching experience Ethnicity School SES Negative computer cognitions: Computer/technology experience Current computer use Computer availability Gender Teaching experience Ethnicity School SES Negative computer attitudes: Computer/technology experience Current computer use Computer availability Gender Teaching experience Ethnicity School SES
Science
Humanities
Step
ra
Step
ra
Step
ra
#1
-.54"** -.28"** -.06 .13" .18" .02 -.05
#1 #2
-.56"** -.50*** -.25** -.07 .20* .04 .00
#1
-.43"** -.24"** -.18"* -.02 .29"** .19"* -.02
.57"** .41"** .11 -.09 -. 11 .04 -.05
#2 #1
.45"** .48"** .31"** -.07 .09 .04 .09
#1 #2
.53"** .44"** .28*** .07 -. 15" .01 .09
.29"** .30*** .15 .17* .05 .02 -.01
#2 #1
.37"** .41"** .24*** .19** -.07 .02 .16"
#2
#1 #2 (#3)
#1
.45"** .29*** .22** -.03 .01 -. 13* -.06
#3
#1 (#2)
#3 #2
#3 (#4)
Note. Predictors entered into stepwise multiple regression at p < .05 significance level are indicated by a # sign followed by the step in which the predictor was entered. Predictors entered into the equation at .05 < p < .10 have their step number enclosed in parentheses. aThis value (r) reflects the simple correlation between each predictor and the indicated dependent variable. *p < .05; **p < .01; *** p < .001. Abbreviation: SES = socieconomic status.
Computer anxiety. For all three groups, the best predictor of computer anxiety was past computer/technology experience. However, beyond this initial predictor, there were different predictors for each group. For Elementary Teachers, gender was a significant predictor with female teachers (M = 142.32) having significantly more computer anxiety than male teachers (M = 125.89). In addition, there was a significant relationship between computer anxiety and teaching experience with teachers with more teaching experience having more computer anxiety. Finally, teachers who currently used computers less had more computer anxiety. For secondary science teachers, computer anxiety was best predicted by a combination of computer/technology experience and current computer use although teaching experience was also correlated with computer anxiety with more experienced teachers showing more computer anxiety. For secondary humanities teachers, computer/technology experience was again the best predictor followed by ethnic background (Black teachers had significantly more computer anxiety than all other groups) and teaching experience (more experienced teachers had more computer anxiety). In addition, three other predictors were significantly related to computer
Technophobicteachers
23
anxiety with older teachers, teachers who had more computer availability, and teachers who used the computer more often showing more computer anxiety.
Computer cognitions. For all three groups, the two major predictors were computer/technology experience and current computer use. However, beyond those, each group had a different constellation of predictors and significant correlates with computer cognitions. For the elementary teachers, computer availability was also a significant predictor at the 0.05 < p < 0.10 level, whereas the secondary science teachers' teaching experience was a significant predictor and computer availability was a significant correlate. Finally, for the secondary humanities teachers, computer availability, age, and teaching experience were all significantly correlated with computer cognitions.
Computer attitudes. For elementary teachers, computer/technology experience was a significant predictor, but current computer use, computer availability and ethnic background all were significant correlates. More negative attitudes toward computers could be attributed to Black or Asian elementary teachers who had less computer/technology experience, less current computer use, and less computer availability. For secondary science teachers, more negative attitudes were seen for male teachers with less computer/technology experience and less current computer use. Secondary humanities teachers presented a different picture in the model to predict computer attitudes. Four variables were needed to significantly predict this dimension of technophobia: current computer use, computer/technology experience, gender (males had more negative attitudes), and school socioeconomic status (teachers from less affluent schools had more positive attitudes). In addition, computer availability was a significant correlate.
Technophobia. As stated earlier, the CARS-T, CTS-T, and ATCS-T were combined to partition teachers into "no technophobia," "low technophobia," and "high technophobia" groups. For each teacher group, a discriminant function analysis was performed using the same variables that were used in the stepwise multiple regressions. Table 5 displays the standardized canonical discriminant function coefficients of the first function for each teacher group. For each group, only this first function was significant in separating the "no," "low," and "high" technophobia teachers. The top portion of Table 5 shows the variables that were most important in discriminating the three technophobic groups. For all three groups, computer experience was the most important discriminator. However, other variables did add substantial discriminability to the discriminant function. For the elementary teachers, gender played an important discriminating role with a beta weight one-third as large as computer experience and twice as large as the next most important variable. In contrast, for the secondary science teachers, ethnic background, current computer use, computer availability, and teaching experience were the more important discriminators after computer experience. Finally, for secondary humanities teachers, all six discriminators current computer use, gender, school socioeconomic status, computer availability, teaching experience, and ethnic background had some discriminating power ranging from half as important as computer experience to about one-third as important. The middle of Table 5 shows the results of using the discriminant function to predict which of the three "technophobic" groups each teacher would best fit based on
24
Rosen and Weil
Table 5. Discriminant Function Canonical Discriminant Function Coefficients and Classification Results Separating "No Technophobla," "Low Technophobia," and "High Technophobia" Groups by Computer Experience, Computer Availability, Current Computer Use, and Demographic Characteristics Secondary Teachers Discriminating Variables Discriminators: Computer/technology experience
Current computer use Computer availability Gender Teaching exper. Ethnicity School SES
Elementary Teachers
Science
Humanities
.96 .16 -. 10 -.23 -.04 .00 -.03
.86 .50 -.35 .12 .34 -.49 -.17
.60 .31 .23 .31 -.23 -.20 .28
Classification results: No technophobia Low technophobia High technophobia
73% 37% 73%
65% 39% 54%
68% 38% 61%
Equation: Chi-square test Canonical correlation
53.35* .56
42.17" .64
58.39* .57
*p < .001. Abbreviation: SES = socieconomic status.
the seven variables listed in the table. The figures in the table represent the percentages of "correct" classifications by the single discriminant function. For example, 73% of the elementary teachers who actually showed "no technophobia" were classified by the discriminant function as predicted to have "no technophobia." It is clear from this section of the table that the discriminant function was best at guessing who had "no technophobia" and nearly as good at guessing who had "high technophobia." The real difficulty for the discriminant function for all three groups was in discriminating those teachers with "low technophobia" from the other two groups.
DISCUSSION
This large-scale, cross-sectional study was designed to assess levels of teacher technophobia in the urban public school system. Three separate subgroups of teachers were studied including elementary teachers (N = 171), secondary science teachers (N = 117), and secondary humanities teachers (N = 200). The three groups were quite similar in all but one demographic characteristic with mainly White teachers from low- and middle-income schools averaging 45 years of age with 17 years of teaching experience. The elementary teachers were predominantly female while there were more male secondary science teachers. The secondary humanities teachers were in between the two groups in their gender distribution.
Computer Availability Versus Current Computer Use This study verified that computers are, indeed, available to nearly all students and all teachers. Further, in half the elementary classrooms, there is at least one
Technophobic teachers
25
computer. Unfortunately, with computers available nearly everywhere, it appears that many teachers do not make use of this technology. Although nearly every campus has computers available for student use, only between one-third (secondary humanities teachers) and two-thirds (elementary teachers) actively use computers with their students. This is also evident in the discrepancy between the vast number of teachers who have computers available for their own use and do not use them. While computers were available for nearly all teachers' use, only about half the teachers actually used them. Sadly, this points out that a substantial segment of the teacher population are avoiding computer technology. Who are these teachers that are not making use of the available technology either for their own use or with their students? In general, they are the more experienced, female, non-White teachers. Perhaps equally discouraging is the finding that many teachers had not used computers when they, themselves, were students. When asked how often they had used computers as a student, 42% of the elementary teachers, 30% of the secondary science teachers, and 45% of the secondary humanities teachers said that they had never used computers as a student. Who are they? Again, they are the older, more experienced, non-White, female teachers. Most likely many of these teachers went to school before the introduction of computers into the educational curriculum although the magnitude of the correlations (all in the 0.15-0.25 range) indicates that this is not the only explanation. Other teachers were in school when computers were available; they simply chose to avoid them. Thus, a substantial minority of teachers may have either been educated before computers were part of the university curriculum or actively avoided learning about computers. With the increased emphasis on computing in our school systems, these teachers are continuing to avoid using the technology that is available to them and to their students. This avoidance may be caused by their discomfort. Are they passing it along to their students?
Technophobia The enhanced CARS-T, CTS-T, and ATCS-T measures were found to be reliable and valid indicators of three overlapping, but different dimensions of technophobia. Extrapolating from earlier validation work (Rosen et al., 1987b) with university students and a recent nationwide study (Weil & Rosen, 1992) of university students it was estimated that 52% of the elementary teachers are technophobic compared with 45% of the secondary humanities teachers and 35% of the secondary science teachers. Weil et al. (1990), stressing the important role played by the "introducer" of technology in the eventual development of technophobia, found that the liklihood of technophobic reactions could be reduced if the "introducer" of technology held a positive attitude about technology and felt skilled and comfortable with computers. This study has demonstrated clearly that teachers do not hold a positive attitude and do not feel comfortable with computers. The recent Educational Testing Service (ETS) nationwide study (Martinez & Mead, 1988) also indicated that even the computer coordinators who were surveyed did not feel that they have the skills and preparation to teach computing. If the coordinators do not feel prepared, then the classroom teacher, who the ETS study showed was the most likely "introducer" of technology, must feel even less competent. This places the students at a severe disadvantage. They are going to learn about computers and technology from role
26
Rosen and Weil
models who are, themselves, uncomfortable around computers and who may be hesitant to teach them in the first place. This leaves the technophobic teachers two choices: avoid teaching computers if possible (covert technophobia) or teach computers while passing their anxiety, negative cognitions, and negative attitudes to their students (overt technophobia). This is a no-win situation. Rather than technophobia disappearing with the increasing role of technology in our society, this process may actually promote the continuation of negative reactions to computers and other forms of technology. What specific fears, negative cognitions, and negative attitudes do these teachers impart to their students? Some of the answers to this question can be found in the items on the three technophobia measures. On the CARS-T teachers found a core of items to be the most anxiety provoking. It is noteworthy that the same items were seen as anxiety provoking by all three groups of teachers. The 12 items that represented the top ten most feared situations showed three clear aspects of computers that trouble teachers. First and foremost, teachers are worded about using and dealing with the actual computer machinery in their school teaching job. This includes concerns about being put in charge of a computer lab, unpacking and setting up a computer, applying for a job that requixes some computer training, and helping another teacher who is having trouble with the computer. When a teacher displays this type of discomfort with computer machinery, particularly an elementary school teacher, it cannot help but get transmitted to the students. Second, teachers are troubled about computer errors including both consumertype errors (billing, personal records) and problems with the computer and its operation (the computer is "down" and getting error messages from the computer). In essence, in all of these situations, the teacher is most likely feeling "victimized" by the computer. She can't get it to do what she wants and it doesn't do things for her without making mistakes. This is a common reaction to computers, particularly as they are evident in consumer products. It is not uncommon to hear people say that their VCR won't work right because it doesn't want to work right. In many houses, when the power falls, people simply let the digital readouts in the VCR and other appliances blink 12:00 rather than "fight" to get them reset to the proper time. In a sense, people are feeling victimized and are simply surrendering control of the clock to the tiny microchips inside their appliances. Such "victims of technology" surely must convey feelings of hopelessness to those around them with such obvious continuous reminders of their own helplessness. In the classroom, the victimized teacher will surely impart a mistrust of technology to the students either overtly or covertly through actions or lack of actions around the computer. Even if the teacher's only role in the students' computer education is to take them to the computer lab, what will the teacher say about the impending trip? Will the teacher stay and interact with the computers and the children or will he/she knowingly or unknowingly show concerns, negative attitudes, and discomfort about the technology? The final group of items that cause anxiety were all directed toward learning about computers. Many teachers felt that computers were difficult to learn and had anxiety about the prospect of taking computer classes. These fears were corroborated by the items on the other two measures where teachers displayed the most negative cognitions and negative attitudes. Teachers felt that they did not often feel (cognitively) that computers aid their work process, make them feel competent, or help them perform their job. They also expressed strong negative attitudes
Technophobic teachers
27
concerning future jobs and the type of logical mind they felt was necessary to program computers. With these fears, negative cognitions, and negative attitudes, teachers will not be able to provide confident role models to the students as they attempt to teach the the students how to use the machines. As earlier work has shown, these students will likely become the next generation's technophobic adults. Predictive Models of Technophobla Stepwise multiple regression models were used to predict each separate measure of technophobia and a discriminant function analysis looked at the combination of all three measures into three "technophobic" groups. The most important result of all these analyses is the prominent role played by variables other than computer experience and current computer use. Each demographic characteristic (gender, teaching experience, and ethnicity), and both school characteristics (computer availability and school socioeconomic status) proved to be important predictors of one or more components of technophobia. The discriminant function analysis showed similar patterns. For each group of teachers a different set of variables were important in separating the technophobes from those with no technophobia with computer experience providing the most, but by no means the only, discriminating power. For elementary teachers gender was an important discriminator whereas for secondary science teachers, ethnicity, current computer use, computer availability, and teaching experience were critical. For secondary humanities teachers all variables contained some discriminating power! What does this mean about who is technophobic and who is not? Perhaps the most important conclusion is that lack of computer experience is not the only predictor of technophobia. Depending on the group of teachers and the measure used, all other demographic characteristics and availability measures were important in predicting computer anxiety, negative computer cognitions, and negative computer attitudes and discriminating among groups of technophobes. There is a common myth that technophobia is simply a lack of experience with computers and all you need to do is to provide a technophobic person with some computer experience and this will eliminate the problem. This study has shown that this is simply not true. There are other characteristics beyond a simple count of computer experiences that determines a teacher's level of technophobia. This is particularly relevant given the current Zeitgeist to make all teachers more "computer literate." The results of this study suggest that literacy may need to be geared to different types of teachers in terms of the grade level they teach, their past computer experiences, the availability of computers in their schools, their level of technophobia, and their personal characteristics. Simply giving teachers more computer experience may not be effective in combating technophobia as suggested by Weil et al. (1987) and Heinssen (1987). Psychological intervention strategies are needed to combat the personal nature of the discomfort toward computers and technology in general. Conclusions and Implications With the permeation of technology in our homes and in our schools, it is tempting to suggest that technophobia will soon be a problem of the past. For that to happen, however, children must be taught about technology by adults who are comfortable with the technology and confident in their technological skills. After their
28
Rosen and Weil
parents, the adults who have the most impact on children are their teachers. This study has clearly demonstrated that between one-third and two-thirds of those teachers are not using computer technology personally or with their students because they lack confidence and feel uncomfortable and even a bit frightened by computers and modern technology. They are scared to set up and work with new computer equipment. They are troubled by computer errors and often feel "victimized" by the computer. They are concerned that it will be too difficult to learn how to use these machines. In Rogers' (1983) classic work on the diffusion of innovations, this teacher would be exactly the person who would not be expected to accept the computer as a classroom innovation. In his later study of the diffusion of microcomputers in schools Rogers (1985) concluded that "findings indicate that.., introduction of the microcomputer produces a great deal of uncertainty and attendant anxiety in schools that adopt this technology" (p. 52). This result is certainly evident in this study. Where does this leave the students? What type of message does it send when the teacher has a computer in the classroom, but does not use that computer or the teacher does not work with the children in the computer laboratory? This technophobic teacher is a role model that says (either overtly or covertly) that computers are not easy to learn, are scary, and are to be avoided. Through action or inaction, this teacher is helping to create the next generation of technophobes. Who is the technophobic teacher? Contrary to popular conceptions, this teacher is not necessarily an older grandmotherly-type woman teaching kindergarten. When correlation patterns and predictive models were examined, it was clear that the technophobic could not be categorized or pigeon-holed. For example, older, more "veteran" teachers did show more computer anxiety (one component of technophobia), but there was no relationship between either age or teaching experience and negative computer cognitions or negative computer attitudes (the other two components of technophobia). A technophobic teacher might be old or young; male or female; or White, Black, Asian, or Hispanic. It is clear that technophobic teachers have less computer experience. However, it is not the lack of computer/technology experience that makes these teachers technophobic. Rather, it is the avoidance of technology by the technophobic teachers that makes these teachers inexperienced in utilizing technology. The avoidance is caused by anxiety and internally-generated negative self-statements (e.g., "I can't learn this"). The avoidance of technology also maintains the technophobe's belief system as the technophobe never comfortably interacts with technology and thereby challenges or changes these beliefs. When "forced" to interact with computers (e.g., in a teacher inservice training program), the technophobe experiences anxiety and discomfort leading to faulty learning (including an increased error rate), thereby reinforcing and maintaining the technophobe's belief system. Technophobia is caused by an ingrained psychologically-based belief system. A brief intervention strategy has been described by Weil et al. (1987) where in 5 hours or less, the distress of technophobia was removed, confident behaviors and attitudes were learned, and increased interest in computers and technology was acquired. Simply putting more computers into the schools will not make teachers use them as learning tools. Requiring teachers to become computer literate will not help them use computers with their students nor remove their technophobia. Before computer education can truly become the fourth "r," school administrators must become cognizant of the massive numbers of technophobic teachers in their
Technophobic teachers
29
schools and take steps to provide psychological assistance to eliminate this psychologically-based problem. Acknowledgements - - Preparation of this article was supported in part by U.S. Department of Education Grant G008541203. We gratefully acknowledge the research assistance of Gwendolyn Brown, Pamela Regan, Jill Slutter, Lisa Sorensen, and Stuart Wugalter, and the conceptual contributions of Dr. Deborah Sears.
REFERENCES Bannon, S. H., Marshall, J. C., & Fluegal, S. (1985). Cognitive and affective computer attitude scales: A validity study. Educational and Psychological Measurement, 45, 679-681. Baylor, J. (1985). Assessment of microcomputer attitudes of education students. University of South Alabama, Mobile, Alabama. (ERIC Document Reproduction Services No. ED 264 284). Becker, H. J. (1991). How computers are used in United States schools: Basic data from the 1989 L.E.A. Computers in Education Survey. Journal of Educational Computing Research, 7(4), 385-406. Berebitsky, R. D. (1985). An annotated bibliography of the literature dealing with mathematics anxiety. Indiana University. (ERIC Document Reproduction Services No. ED 257 684). Bloom, A. J., & Hautaluoma, J. E. (1990). Anxiety management training as a strategy for enhancing computer user performance. Computers in Human Behavior, 6, 337-349. Cicchelli, T., Baecher, R. E., & Nygren, J. (1984). Turning teachers on to microcomputers: Results of a two-year staff development project. Paper presented at the National Council of States on Inservice Education Conference, Orlando, FL. (ERIC Document Reproduction Services No. ED 279 613). Ernest, P. S., & Lightfoot, R. M. (1986). A model to reduce anxiety and increase utilization of computers in the classroom. University of Montevallo, Montevallo, AL. (ERIC Document Reproduction Services No. ED 275 662). Gressard, C., & Loyd, B. H. (1985). Age and staff development experience with computers as factors affecting teacher attitudes toward computers. School Science and Mathematics, 85(3), 203-209. Heinssen, R. K. (1987). Client-treatment matching in computer anxiety intervention (Doctoral Dissertation, Catholic University, Washington, D.C.). Dissertation Abstracts International, 48, 564-B. Heller R. S., & Martin, C. D. (1987). Measuring the level of teacher concerns over microcomputers in instruction. Education and Computing, 3, 133-139. Honeyman, D. S., & White, W. J. (1987). Computer anxiety in educators learning to use the computer: A preliminary report. Journal of Research on Computing in Education, 20, 129-138. Issa, R. A., & Lorentz, R. L. (1989). Variations in anxiety~attitudes of Black high school teachers towards computers. Mississippi Valley State University. (ERIC Document Reproduction Services No. ED 309 209). Kelly, P. P. (1983). Overcoming computer anxiety with word processing. (ERIC Document Reproduction Services No. ED 239 296). Koohang, A. A. (1987). A study of the attitudes of preservice teachers toward the use of computers. Education Communications Technology Journal, 35(3), 145-149. Kotrlik, J. W., & Smith, M. N. (1989). Computer anxiety levels of vocational agriculture teachers. Journal of Agricultural Education, 30, 41-48. Lichtman, D. (1979, January). Survey of educator's attitudes toward computing. Creative Computing, pp. 48-50. Liu, M., Reed, W. M., & Phillips, P. D. (1990) Teacher education students and computers: Gender, major, use, occurrence, and anxiety. Paper presented at the annual meeting of the American Educational Research Association, Boston, MA. (ERIC Document Reproduction Services No. ED 324 338). Loyd, B. H., & Gressard, C. P. (1986). Gender and amount of computer experience of teachers in staff development programs: Effects on computer attitudes and perceptions of the usefulness of computers. AEDS Journal, 19, 302-311.
30
Rosen and Weil
Loyd, B. H., & Loyd, D. E. (1985). The reliability and validity of an instrument for the assessment of computer attitudes. Educational and Psychological Measurement, 45, 903-909. Lumsden, D. B., & Norris, C. A. (1985). A survey of teacher attitudes and beliefs related to educational computing. Computers in the Schools, 2, 53-59. Madsen, J. M., & Sebastiani, L. A. (1987). The effect of computer literacy instructions on teachers' knowledge of and attitudes toward microcomputers. Journal of Computer-Based Instruction, 14, 68-72. Martinez, M. E., & Mead, N. A. (1988). Computer competence: Thefirst national assessment (Report No. 17-CC-01). Princeton, NJ: Education Testing Service. Mertens, D. M., & Wang, Z. (1988). Attitudes toward computers of preservice teachers of hearingimpaired students. American Annals of the Deaf, 133, 40-42. Naiman, A. (1988, April 28). Computers now a classroom constant but roles are a variable. Los Angeles Times, Part V., p. 16. Norris, C. A., & Lumsden, D. B. (1984). Functional distance and the attitudes of educators toward computers. T.H.E. Journal, 11, 129-132. Overbaugh, R. C., & Reed, W. M. (1990). The effects of brief instructional activities on teacher education students' computer anxiety and performance. Paper presented at the Eastern Educational Research Association Conference, Clearwater, FL. (ERIC Document Reproduction Services No. ED 325 073). Pelgrum, W. J., & Plomp, T. J. (1991). The use of computers around the world: Results of a cross national survey in 22 countries. Oxford: Pergamon Press. Robinson, L., Mikkelsen, V., & Ellermeyer, D. (1987). Let the computer introduce itself to education majors. Paper presented at the annual meeting of the Association of Teacher Educators, Houston, TX. (ERIC Document Reproduction Services No. ED 286 466). Rogers, E. M. (1983). Diffusion of innovations. New York: Free Press. Rogers, E. M. (1985). Microcomputers in the schools: A case of decentralized diffusion. Paper presented at the International Communication Association Conference, Honolulu, HI. (ERIC Document Reproduction Services No. ED 267 770). Rosen, L. D., & Maguire, P. D. (1990). Myths and realities of computerphobia: A meta-analysis. Anxiety Research, 3, 175-191. Rosen, L. D., Sears, D. C., & Weil, M. M. (1987a). Computerphobia. Behavior Research Methods, Instruments, & Computers, 19(2), 167-179. Rosen, L. D., Sears, D. C., & Weil, M. M. (1987b). Computerphobia Measurement. A Manual for the Administration and Scoring of Three Instruments: Computer Anxiety Rating Scale (CARS), Attitudes Toward Computers Scale (ATCS), and Computer Thoughts Survey (CTS). Unpublished manuscript. California State University, Dominguez Hills, Carson, CA. Rosen, L. D., Sears, D. C., & Weil, M. M. (1993). Treating technophobia: A longitudinal evaluation of the Computerphobia Reduction Program. Computers in Human Behavior, 9, 27-50. Rosen, L. D., & Weil, M. M. (1990). Computers, classroom instruction, and the computerphobic university student. Collegiate Microcomputer, 8, 275-283. Rosen, L. D. & Weil, M. M. (1992). A Manual for the Administration and Scoring of the Computer Anxiety Rating Scale (Form C), Computer Thoughts Survey (Form C) and the General Attitudes Toward Computers Scale (Form C). Unpublished manuscript. California State University, Dominguez Hills, Carson, CA. Stevens, D. J. (1980). How educators perceive computers in the classroom. AEDS Journal, 13, 221-232. Stimmel, T., Connor, J. L., McCaskill, E. D., & Durrett, H. J. (1981). Teacher resistance to computerassisted instruction. Behavior Research Methods & Instrumentation, 13, 128-130. Summers, M. (1988). New primary teacher trainees and computers: Where are they starting from? Journal of Education for Teachers, 14(2), 183-190. Sutphin, D. (1987). Educating teachers on instructional applications of microcomputers. Technological Horizons of Education Journal, 14, 54-58. Thompson, A. D. (1985). Helping preservice teachers learn about computers. Journal of Teacher Education, 36, 52-54. Tucker, M. S. (1985). Computers in the schools: What revolution? Journal of Communication, 35, 12-23. Violato, C., Marini, A., & Hunter, W. (1989). A conftrrnatory factor analysis of a four-factor model of attitudes toward computers: A study of preserviee teachers. Journal of Research on Computing in Education, 22, 199-213.
Technophobic teachers
31
Weil, M. M., & Rosen, L. D. (1992). Psychological ramifications of the technological revolution from a global perspective. Unpublished manuscript. California State University, Dominguez Hills, Carson, CA, 1992. Weil, M. M., Rosen, L. D., & Sears, D. C. (1987). The computerphobia reduction program: Year 1. Program development and preliminary results. Behavior Research Methods, Instrumentation, & Computers, 19(2), 180-184. Weil, M. M., Rosen, L. D., & Wugalter, S. (1990). The etiology of computerphobia. Computers in Human Behavior, 6, 361-379.