Apr 28, 1999 - encouragement and guidance inspired me to continue forward throughout my degree program. Finally, I would like to thank my family for ...
Computer Program Development for the Design of IFAS Wastewater Treatment Processes Tongchai Sriwiriyarat
Thesis submitted to the Faculty of Virginia Polytechnic Institute and State University in partial fulfillment of the requirements for the degree of
Master of Science in Environmental Engineering
Clifford W. Randall, Ph.D., Chair Daniel L. Gallagher, Ph.D. John C. Little, Ph.D.
April 28, 1999 Blacksburg, Virginia Tech
Keywords: IFAS, activated sludge model, integrated fixed film media, biofilm, mathematical modeling, nitrification, denitrification Copyright ã 1999, Tongchai Sriwiriyarat
Computer Program Development for the Design of IFAS Wastewater Treatment Processes By Tongchai Sriwiriyarat
ABSTRACT
The Integrated Film Activated Sludge Process (IFAS) was developed to reduce the cost of additional facilities required to complete year round nitrification in the design of new or retrofit wastewater treatment plants. The purpose of this project was to develop a computer-based mechanistic model, called IFAS, which can be used as a tool by scientists and engineers to optimize their designs and to troubleshoot a full-scale treatment plant. The program also can be employed to assist researchers conducting their studies of IFAS wastewater treatment processes. IFAS enables the steady-state simulation of nitrification-denitrification processes as well as carbonaceous removal in systems utilizing integrated media, but this current version supports only sponge type media. The IFAS program was developed by incorporating empirical equations for integrated biofilm carbonaceous uptake and nitrification developed by Sen and Randall (1995) into the general activated sludge model, developed by the International Association on Water Quality (IAWQ, previously known as IAWRC), plus the biological phosphorus removal model of Wentzel et al (1989). The calibration and evaluation of the IFAS model was performed using existing data from both an IFAS system and a conventional activated sludge bench-scale plant operated over a wide range of Aerobic Mean Cell Residence Times (Aerobic MCRT’s). The model developed provides a good fit and a reasonable prediction of the experimental data for both the IFAS and the conventional pilot-scale systems. The phosphorus removal component of the model has not yet been calibrated because of insufficient data and the lack of adequately defined parameters.
ACKNOWLEDGEMENTS I am sincerely indebted to my major advisor, Dr. Clifford W. Randall, who provided his invaluable ideas, guidance, suggestions and encouragement throughout my graduate studies, without whom the IFAS program would not have been developed. Also the expansion of my professional knowledge and completion of my degree would not have been possible if it were not by his support, assistance, and inspiration.
I am also grateful to Dr. Daniel L. Gallagher, and Dr. John C. Little for their insights into my research and their invaluable time to make suggestions and comments. Their sincere encouragement and guidance inspired me to continue forward throughout my degree program.
Finally, I would like to thank my family for allowing me to pursue my graduate studies through their financial support, time, and encouragement. Also I would like to thank my close friends for their friendship and moral support.
ii
TABLE OF CONTENTS ABSTRACT..................................................................................................................................... i ACKNOWLEDGEMENTS............................................................................................................ ii TABLE OF CONTENTS............................................................................................................... iii LIST OF TABLES.......................................................................................................................... v LIST OF FIGURES ....................................................................................................................... vi CHAPTER 1 INTRODUCTION .................................................................................................... 1 CHAPTER 2 LITERATURE REVIEW ......................................................................................... 3 2.1 NUTRIENT EFFECTS ON AQUATIC ECOSYSTEMS ............................................ 3 2.2 BIOLOGICAL NUTRIENT REMOVAL .................................................................... 3 2.2.1 Biological Nitrogen Removal ................................................................................ 4 2.2.2 Biological Phosphorus Removal............................................................................ 4 2.3 BIOFILM PROPERTIES.............................................................................................. 5 2.3.1 Competition in Biofilms ........................................................................................ 5 2.3.2 Simultaneous Nitrification and Denitrification...................................................... 5 2.4 INTEGRATED FIXED FILM BIOLOGICAL PROCESS .......................................... 6 2.5 MEDIA TYPES AND APPLICATIONS ..................................................................... 7 2.6 MATHEMATICAL MODELING................................................................................ 9 2.6.1 Suspended Growth Model...................................................................................... 9 2.6.2 Attached Growth Model ...................................................................................... 10 2.7 NUMERICAL SIMULATION APPROACH............................................................. 12 2.8 REFERENCES ........................................................................................................... 12 CHAPTER 3 COMPUTER PROGRAM DEVELOPMENT FOR THE DESIGN OF IFAS WASTEWATER TREATMENT PROCESSES .......................................................................... 17 INTRODUCTION ............................................................................................................ 18 MODEL DEVELOPMENT.............................................................................................. 19 iii
PROGRAM DEVELOPMENT AND OPERATION....................................................... 22 MODEL CALIBRATION AND EVALUATION............................................................ 24 RESULTS AND DISCUSSION ....................................................................................... 28 CONCLUSIONS............................................................................................................... 38 APPENDIX I. REFERENCES ......................................................................................... 38 APPENDIX II. NOTATION ............................................................................................ 39
iv
LIST OF TABLES Table 1. Stoichiometric parameters for the IFAS model .............................................................. 26 Table 2 Kinetic parameters for the IFAS model at 20 oC ............................................................. 27 Table 3 Switching function parameters for the IFAS model ........................................................ 28
v
LIST OF FIGURES Figure 1 Experimental Data and Model Predictions for SCOD, IFAS-Sponge System at 12 oC…………………………………………………30 Figure 2 Experimental Data and Model Predictions for SCOD, Control System at 12 oC……………………………………………………….31 Figure 3 MLVSS Profiles of IFAS System with UCT/VIP Configuration at 12 oC…………..32 Figure 4 MLVSS Profiles of Control System with UCT/VIP Configuration at 12 oC………...33 Figure 5 Experimental Data and Model Prediction for NH4+-N, NO3--N, IFAS-Sponge System at 12 oC at 3.1 aerobic MCRT….………………………34 Figure 6 Experimental Data and Model Prediction for NH4+-N, NO3--N, IFAS-Sponge System at 12 oC at 1.0 aerobic MCRT…………………………35 Figure 7 Experimental Data and Model Prediction for NH4+-N, NO3--N, Control System at 12 oC at 3.1 aerobic MCRT………………………………..36 Figure 8 Experimental Data and Model Prediction for NH4+-N, NO3--N, Control System at 12 oC at 1.0 aerobic MCRT………………………………..37
vi
CHAPTER 1
INTRODUCTION Biological Nutrient Removal (BNR), i.e., the removal of nitrogen and phosphorus from wastewaters using biological mechanisms, is an advanced wastewater treatment technology that has been developed to reduce the impacts of nutrients on receiving waters. Eutrophication effects and algae blooms may be accelerated and stimulated in water bodies as a consequence of nutrient discharges. Every kilogram of phosphorus assimilated by algae (C106H263O110N16P) typically generates 111 kilograms of biomass, which is equivalent to 138 kg of COD. If the treatment plant discharges 5 mg/L of phosphorus, the potential COD formation is 690 mg/L, which substantially exceeds the 400 mg/L COD concentration of typical untreated USA municipal sewage. Also a kilogram of nitrogen could potentially produce 16 kilograms of algae, which is equivalent to 20 kilograms of COD (Randall et al., 1992). The typical treatment plant discharges about 18 mg/L Total Nitrogen (TN), which can produce 360 mg/L of COD as algae, and almost equal the COD of raw sewage. The COD thus produced accumulates in the bottom sediments of lakes, reservoirs, and estuaries when the algae die and settles. This increases the sediment oxygen demand and accelerates nutrient recycling and eutrophication.
Research and investigations have shown that algal growth in most North American estuaries is nitrogen limited (Randall et al., 1992 and STAC, 1986), and point source nitrogen controls are necessary to manage and restore water quality. At many wastewater treatment plants (WWTP), nitrification and nitrogen removal are seasonal and depends on the growth rate of the nitrifiers, which is lower in winter than in summer and fall. To obtain complete nitrification all through the year, the aerobic Mean Cell Residence Time (MCRT) of the biomass must be increased during winter to exceed the critical MCRT for nitrifiers. However, increasing the MCRT increases the mixed liquor suspended solids (MLSS) concentration and this may overload the secondary clarifiers. If so, either the activated sludge basin volume must be increased to reduce the MLSS concentration going to the clarifiers, or additional clarifier capacity must be added, unless an innovative approach is used. Recent full-scale and laboratory research has 1
demonstrated that a viable innovative technology is the integration of fixed film media into the aerobic zone of BNR activated sludge reactors (Sen and Randall, 1995). This technology, labeled the Integrated Fixed Film Activated Sludge (IFAS) system (Sen, 1995), enhances COD removal and denitrification, thus enabling year round nitrification and nitrogen removal in activated sludge systems that are otherwise undersized . Mechanistically-based mathematical models have been developed to account for the major reactions that occur in IFAS systems, to assist engineers or scientists in the development of optimized design and operation of wastewater treatment systems (Sen, 1995). This is desirable because IFAS systems are complicated and difficult to analyze because of the large number of biochemical reactions that occur in the different environmental zones, i.e., anaerobic, anoxic, and aerobic. Such models reduce the amount of time and the budget needed to explore the feasibility of the different process options.
The first version of a model called Multiple Cell Wastewater Treatment Plant (MCWTP) was developed to predict COD removal, nitrification, and denitrification in IFAS systems (Sen, 1995). This model can also be used to compare the performance of IFAS processes with both conventional BNR and traditional activated sludge processes. However, this version was developed on a spreadsheet program and for a University of Cape Town/ Virginia Initiative Project (UCT/VIP) plant configuration. The objectives of this research were to develop a second mathematical model and a computer program that is more useful and practical. The model was expected to be more user friendly, interactive, and simpler handling. To be able to characterize the complex system efficiently, the second version of the IFAS program integrated the empirical equations for substrate uptake by biofilm on supporting media into the International Association on Water Quality (IAWQ) general activated sludge model (Model No. 1). The empirical IFAS equations were modified so that they were compatible with the general model and were able to reasonably predict the behavior of the fixed film microorganisms. These changes should make the IFAS program easier to use for practicing design engineers and scientists, and make it possible to analyze a wide variety of plant configurations.
2
CHAPTER 2
LITERATURE REVIEW 2.1 NUTRIENT EFFECTS ON AQUATIC ECOSYSTEMS
Two primary sources of nutrients, point and non-point, typically contribute nutrients to receiving waters. An increase of algae and other photosynthetic aquatic life in the water bodies would be a consequence of increased nutrient inputs. These organisms and plants grow autotrophically, thus manufacturing organic matter, then eventually die and settle down to the bottom. Some of the nutrients are then released and recycled back to the water column for new growth. The algal organic remains can also be consumed by bacteria resulting in the depletion of dissolved oxygen (DO) in the lower layers of the water column. Also, ammonia-nitrogen formed by deaminiation of organic compounds can, for instance, be converted to nitrite and nitrate by nitrifying bacteria with the consumption of DO. The oxygen consumed by this process is typically referred to as Nitrogenous Oxygen Demand (NOD).
2.2 BIOLOGICAL NUTRIENT REMOVAL
Biological nutrient removal (BNR) can be used to reduce the impact of nutrient discharge on the oxygen content of the receiving water. It potentially can provide a more economical alternative of nutrient removal than conventional activated sludge treatment plants using physicochemical or chemical processes. Excess biological phosphorus removal (EBPR) eliminates or reduces chemical addition for phosphorus removal. Also, Randall (1991, 1992) reported that the aeration energy required for BOD stabilization is reduced due to some substrate utilization that occurs in the anaerobic during BPR. Biological nitrogen removal utilizing the wastewater BOD for denitrification can result in an aeration energy reduction of as much as 62.5% of the energy required for nitrification (Randall et al., 1992). Both EBPR and biological nitrogen removal will reduce the amount of sludge that must be processed for disposal, and
3
nitrogen removal will reduce or eliminate the need to add alkalinity for pH adjustment (Randall et al., 1992).
2.2.1 Biological Nitrogen Removal
Biological Nitrogen Removal consists of two separate sets of reactions to convert ammonia-nitrogen (NH3N) to gaseous molecular nitrogen (N2). The first set is the oxidation of the ammonia-nitrogen to nitrite and then to nitrate by Nitrosomonas spp. and Nitrobacter spp., respectively. Typically, the nitrite concentration found in the bulk solution is less than 0.2 mg/L because the rate of the over all process is limited by Nitrosomonas spp and nitrite is converted rapidly to nitrate. The second set of reaction involves the reduction of nitrate to molecular nitrogen. BOD is required for denitrification, which reduces the amount of DO that must be transferred by aeration if the wastewater BOD is used for this purpose. Denitrification also produces alkalinity and can restore up to 50 % of that which was destroyed during the nitrification process, 7.14 mg (as CaCO3) alkalinity consumed per milligram NH3-N oxidized,. 3.57 mg alkalinity produced per mg of nitrate reduced. Many microorganism species are capable of denitrifying nitrate in the anoxic zone, but the most commonly observed are Pseudomonas species. Münch et al.(1996) observed that the denitrification rate depends on the DO concentration and is accurately described by the switching functions presented in the IAWQ model. They also found that the denitrification rate decreased gradually with time during aeration periods in sequencing batch reactors (SBRs). It has been reported that some species may be able to nitrify and denitrify under aerobic conditions. Robertson et al.(1988) reported that Thiosphaera pantotropha are able to nitrify NH3-N and denitrify NO3-N using acetate as a carbon source under aerobic conditions with 30 % saturation of dissolved oxygen. However, no practical application has ever been demonstrated.
2.2.2 Biological Phosphorus Removal
4
The Excess Biological Phosphorus Removal (EBPR) method of wastewater treatment was developed after numerous observations of the accumulation of phosphorus in excess of typical activated sludge nutritional requirements were reported in the 1960s. Fuhs et al.(1975) concluded that the principal microorganism group mediating biological phosphorus removal was the Acinetobactor genus. These organisms take up short-chain fatty acids (SCFA) into their cells under anaerobic conditions and store them as poly-βhydroxyalkanoates (PHA). The stored PHA is used for energy and growth under subsequent aerobic conditions, and excess energy is stored in polyphosphate bonds, resulting in phosphorus removal and storage. The cycle is completed when the energy stored in the polyphosphate as bonds is used to polymerize the SCFAs as PHAs under anaerobic conditions. This results in the release of phosphorus to the bulk solution. Therefore, the anaerobic zone of activated sludge is necessary for biological phosphorus removal process.
2.3 BIOFILM PROPERTIES
2.3.1 Competition in Biofilm
Studies of biofilm properties have shown that the heterotrophs, nitrifiers, and denitrifiers coexist in a unit volume of biofilm, increasing with the biofilm depth. Although the microorganism population increases with biofilm depth, the number of reactions taking place in the biofilm does not change. From studies, the dissolved oxygen flux was a key parameter determining the activity of these bacteria. High dissolved oxygen within biofilm increases the activity of nitrifiers and decreases the amount of denitrified nitrate (Masuda et al., 1991; Watanabe et al., 1992). Various models have been developed to characterize the behavior of competition microorganisms in biofilm as mentioned in the attached growth model section.
2.3.2 Simultaneous Nitrification and Denitrification
5
Masuda et al. (1991) observed the nitrogen loss from a Rotating Biological Contactor (RBC) plant and hypothesized that there were simultaneous nitrification and denitrification processes in the biofilm. This occurred when the oxygen transfer rate decreased enough to create a micro-aerofilic environment. They also demonstrated that the nitrogen removal efficiency correlated with the temperature, oxygen pressure, influent organic to ammonia ratio, and hydraulic loading.
Bang et al. (1995) investigated the denitrification process in the aerobic environment of the biofilm on a RBC. Polyvinyl alcohol (PVA) was used as a carbon source at 25 oC with an influent C/N ratio of 1.2. The net denitrification in the aerobic zone was about 78%. They also observed that the number of denitrifiers and PVA decomposing bacteria accumulating in the surface layer were higher than those in the middle and bottom layers, by up to 1 to 2 orders of magnitude. The nitrification efficiency was directly proportional to the oxygen flux. The denitrification efficiency, on the other hand, was indirectly proportional to the oxygen flux to the biofilm layers. They verified this experiment with a computer simulation. Adequate agreements between both results were obtained (Watanabe et al., 1992).
2.4 INTEGRATED FIXED FILM BIOLOGICAL PROCESS
The integrated fixed film activated sludge (IFAS) process was introduced to enhance carbonaceous and nutrogen removal. This technology combines the main advantages of the attached growth system and the suspended growth system, and minimizes their disadvantages. The attached growth system provides a high volumetric density of microorganisms accumulating by natural attachment as biofilm on the media. Shock load and toxic load problems can be minimized by this process due to the large amount of biomass on the integrated media. This increases the cell retention time without increasing the mixed liquor concentration in the system and overloading the secondary clarifier. These are potential problems with suspended growth biological system. However, suspended growth treatment systems are more flexible than fixed film systems for meeting higher effluent quality standards particularly nutrient removal. IFAS process, however, is a hybrid system which provides both stability and flexibility. 6
Researchers have reported that temperature has a primary impact on the kinetics of various biochemical conversions in the biological nutrient removal processes that result in substantially lower growth rates of the microorganisms. Large wastewater treatment plants located in the temperate zones of North American were observed and found that they fall in the range of 10-12 oC (Sen, 1995). McClintock et al. (1991,1993) also found that EBPR could not be completed at 5 days MCRT and 10 oC. More adverse effects on the performance of EBPR and nitrogen removal due to low temperature can be due to low MCRT. Mamais and Jenkins (1992) reported that EBPR functioned efficiently at 2.9 days aerobic MCRT for the temperature range investigated (13.5-20 oC). Temperature affected EBPR when the system MCRT was operated below 2.9 days. The growth rate of nitrifiers is dramatically lower at temperatures of 10-12 oC as in winter compared to summer when temperatures exceed 20 oC (Ekama and Marais, 1984). A primary thrust of the Chesapeake Bay Program is to incorporate BNR into the existing conventional activated sludge plants as economically as possible. To accomplish year round nitrification, it is necessary to increase the quantity of biomass maintained in smaller the aerobic zone. This can be done by increasing the Mixed Liquor Suspended Solid (MLSS) concentration , but this will result in higher sludge loadings to the clarifiers, and may exceed their capacity. Alternatively, the aeration basin volume can be increased. Therefore, larger aeration basins or clarifier tanks are required. Due to the constraints economic resources and space, the integrated fixed film activated sludge was an option which was evaluated and shown that can minimize the size needs of the aeration tank or clarifier. This is because a large amount of microorganisms can be maintained on the support media without substantially increasing loading to the clarifier.
2.5 MEDIA TYPES AND APPLICATIONS
Several types of media can be utilized in integrated fixed film activated sludge treatment
systems. Ringlace , a rope type media, was installed in the wastewater treatment plant of the city of Geiselbullach, Germany to upgrade the wastewater treatment plant to achieve a year round nitrification. This purpose of this upgrading was to maintain nitrification throughout the year and improve sludge settling and it has successfully accomplished. (Lessel, 1991; Lessel, 1993). In the United States, Ringlace IFAS was installed in the treatment plant of the city of Annapolis, 7
Maryland and operated as both a Modified Ludzack Ettinger (MLE) and a Step Feed BNR process. (Sen and et al., 1993; Sen and et al., 1994a; Sen, 1995; Randall and et al., 1996; and Randall, 1997). The data showed that the integrated Ringlace enhanced nitrogen removal. In both plant configurations, nitrification in the IFAS section was more than three times as much as in the control section without media. Also, the amount of aerobic denitrification was enhanced in the IFAS system when operation was changed from MLE to Step Feed BNR.
Sponge media was tested in the Geiselbullach, Germany by Lessel (1991), but was not selected as a biofilm media because of its anaerobic sludge production. Randall (1997) categorized applications of floating sponge media into three types. For the first type, the media zone was placed after primary sedimentation and operated without recycles before the activated sludge zone. This was used at Moundsville, West Virginia, USA by Golla et al.(1993) with
Captor as the sponge media. There was 70-75% nitrogen removal in the Captor zone over a three-year monitoring period. The average ammonia nitrogen effluent was 5.4 mg/L with a standard deviation of 3.6 mg/L, and was below the effluent ammonia nitrogen standard. For the
second type, Linpor-N , another floating sponge media designed to enhance nitrification, was installed as a last treatment step without subsequent clarification at Wyk, Germany (Morper and Wildmoser, 1989; Schonberger,1989). At least 50% nitrogen removal was achieved even at a temperature as low as 10 oC. For the last concept, the floating media was added directly to the aeration tank of the activated sludge process to enhance nitrification in winter. This system was successfully implemented by Sen and Randall (1994) at the Cox Creek Wastewater treatment plant, Maryland, USA. Also a bench-scale plant with sponge IFAS obtained almost complete nitrification while only 50% was obtained in a control system with no sponges. In Japan, Kondo (1992) conducted an experiment of porous media application in a domestic wastewater treatment plant. Effluent BOD and nitrogen concentrations of less than 20 and 15 mg/L were obtained over water temperature range of 13-31 oC could be achieved as long as the optimum pore size and pad dimensions were chosen. This plant was operated with only 1.5 hours of aeration and a subsequent 0.5 hours of agitation. Tsuno and et al., (1992) investigated the applicability of polyurethane foam cubes in the sewage treatment plant at Kyoto City, Japan. Polyurethance foam cubes of 8 cm3 were added into an aerobic reactor consisting of 6 cells that operated
8
without recycle. The nitrification rate could reached 0.33 mg N/hr-cube at a temperature of 15 o
C.
Jensen (1995) found that freely floating media significantly increased nitrification at a temperature of 12 oC under operating conditions of low aerobic MCRT (3.4 to 1.7 days).
Ringlace did not perform nitrification as well as Captor media. However, denitrification in the
aerobic reactor was higher with the Ringlace media (Mitta, 1994). Liu (1996) confirmed that
nitrification could be maintained in the Captor system at 12 oC at aerobic MCRTs as low as 1.7 days. There was at least 15 mg/L difference in effluent ammonia between the IFAS and the control system at the selected aerobic MCRT. It was shown that the IFAS system could maintain nitrification at an aerobic MCRT and temperature at which the control system would fail.
2.6 MATHEMATICAL MODELING
The complexity of activated sludge systems has expanded from system designed for carbonaceous compounds removal only to include nitrification, denitrification and excess biological phosphorus removal. Many biochemical reactions and compounds are involved in these processes. The computer model plays an important role in the simplification of the complexity of wastewater treatment processes for both full-scale and bench-scale systems. In full-scale operation, the model can be used to optimize the processes or troubleshoot the treatment systems. It can be applied at the bench-scale in research studies for testing results, optimizing processes, or selecting processes. The computer models mainly are divided into two categories according to the type of biological growth, i.e., suspended growth or attached growth.
2.6.1 Suspended Growth Model
A task group was formed by IAWQ (previously known as IAWPRC) in 1982 to facilitate the application of models for designing and operating activated sludge systems and many models have since been developed to describe various complex activated sludge systems. Grady (1986) initially presented a single-sludge system model, which
9
consisted of seven processes including carbon oxidation, nitrification, and denitrification, which was the outline for a model that was agreed on by the task group. The SSSP was developed to describe a single sludge system with the matrix approach proposed by IAWQ (Bidstrup, 1988). A preliminary model was evaluated by Dold and Marais(1986) and this led to the development of Activated Sludge Model No. 1 (ASM1) development. Modifications were made and adopted as a final version of ASM1 (Henze and et al., 1987). Subsequently, many other models have been developed building upon the ASM1 model. ASM1 does, however, not include the phenomenon of EBPR. Extension of ASM1 to include EBPR was proposed and developed by IAWQ and called ASM2. ASM2 includes both the excess biological phosphorus removal processes and chemical processes for phosphorus precipitation (Henze et al., 1994). Barker and Dold (1997) developed their general model, which includes 36 processes, among them, the EBPR component. The anoxic growth of poly-P microorganisms also has been incorporated in the model. Anoxic and anaerobic hydrolysis of slowly enmeshed biodegradable COD processes are incorporated into this model as well as the fermentation of readily biodegradable organic materials. The general model is based on the original ASM1 and the Wentzel Model (1989). Henze (1999) proposed ASM No. 2d that includes phosphorus removal by of poly-P microorganisms during denitrification. Gujer (1999) presented an ASM No. 3, which is a modification of ASM No. 1. A substrate storage process was introduced into this version as a new process and it is assumed that there is no COD flow from nitrifier decay. The modeling of heterotroph and autotroph decay processes were clearly separated in ASM3.
2.6.2 Attached Growth Model
Two factors have been raised when dealing with the modeling of fixed growth systems. First, the effects of diffusive resistance on substrate removal need to be incorporated into the model to accurately predict the performance of the system. Second, the heterogeneous nature and poor characterization of these conditions within the biofilm result in the difficulty of the biofilm modeling difficulties. Early mathematical models focused on substrate utilization in the biofilm. Substrate utilization was described as a 10
process of molecular diffusion and simultaneous biochemical reactions (Williamson and McCarty, 1976). Numerous steady state models have been developed, which vary from a single microorganism species to multiple-species and from a single substrate to multiplesubstrates. Subsequently, a steady state biofilm model of a single substrate coupled with substrate flux into the biofilm has been developed by assuming neither net growth nor decay over time. A minimum substrate concentration in the bulk liquid must be maintained to achieve a steady state condition. The substrate flux and thickness are assumed to be zero when the substrate concentration is below this criteria. The Monod equations are used to describe biochemical reactions and Fick’s law is used to describe diffusion equations, which combined together are the basic mechanisms in biofilms. Idealized biofilms have been described as having uniform cell density and uniform thickness. All nutrients required for growth are assumed to be in excess concentrations (Rittmann and McCarty, 1980a). The model was evaluated and the results showed that the model successfully predicted the substrate utilization rate and biofilm thickness.(Rittmann and McCarty, 1980b). Mass transport by diffusion is assumed to be one dimensional because the biofilms are typically very thin. Due to the possibility of extensive computational efforts, steady state mechanistic models with multiple-species with competition of substrate and space were developed. A multi-species model for COD removal and nitrification was proposed by Wanner and Gujer (1984), but this model was not verified with experimental data. Wanner and Gujer (1984) showed that given the competition for oxygen, the heterotrophs may be washed out at low substrate concentrations. In contrast, at high substrate concentrations, they may overgrow the slowgrowing autotrophic organisms. The heterotrophs have a tendency to reside at the surface and autotrophs may accumulate more in the deeper layers. The biomass flux was used to simulate biomass growth. However, this model is not a true steady state model. Subsequently, Rittmann and Manem (1992) presented a steady state model that described multi-species behavior with multiple active species, inert biomass, substrate utilization, diffusion within the biomass, external mass transport, and the detachment phenomenon. This model was verified experimentally and its predictions agreed with the observed data in terms of space competition. Higher acetate concentrations resulted in NH4+N flux decrease because autotrophs were forced deeper into the biofilm by heterotrophs. Kissel 11
et al.(1984) proposed a dynamic model, allowing the volume of biomass to increase with time from V to V+∆V at time t to t+∆t when biomass increases due to positive net growth.
2.7 NUMERICAL SIMULATION APPROACH
The equations applied in the activated sludge model form a system of non-linear equations. Many numerical approaches are available from the literature to solve these equations. However, the approach that can be used to solve most conditions is preferred. The global convergence method was used since it is reported in the literature that it guarantees the convergence of these equations with any starting point (Press et al., 1992). Although more computational needs are required, the Modified Newton-Raphson method, combines the rapid local convergence of Newton’s method and the global convergent strategy, it is a powerful method because it guarantees some degree of progression toward the solution at each iteration.
2.8 REFERENCES
Bang, D.Y., Watanabe, Y., and Noike, T. (1995). “An experimental study on aerobic denitrification with polyvinyl alcohol as a carbon source in biofilms”. Wat. Sci. Tech., 32(8), 235-242. Barker, P.S., and Dold, P.L. (1997). “General model for biological nutrient removal activated sludge systems: model presentation”. Water Environment Research., 69(5), 969-984. Bidstrup, S.M. and Grady Jr., C. P. L. (1988). “SSSP --simulation of single-sludge processes”. J. Wat Pol. Con. Fed. 60(3), 351-350. Dold, P.L., and Marais, G.v.R (1986). “Evaluation of the general activated sludge model proposed by the IAWPRC task group. Wat. Sci. Tech., 18, 63-89. Ekama, G.A. and Marais, G.v.R. (1984). “Chapter 5: Nitrification”. In: Theory, Design and Operational of Nutrient Removal Activated Sludge Processes”. Water Research Commission, Pretoria, SA. Fuhs, G.W., and Chen M. (1975). “Microbiological basis of phosphate removal in the activated sludge process for the treatment of wastewater”. Microbiol. Ecology, 2, 119-138. 12
Grady, C.P.Jr., Gujer, W., Henze, M., Marais G.v.R., and Matsuo, T. (1986). “A model for single-sludge wastewater treatment systems”. Wat. Sci. Tech., 18, 47-61. Golla, P.S., Reddy, M.P., Simms, M.K., and Laken, T.J. (1993). “Three years of full scale Captor process operation at Moundsville, WWTP”. Proc. 2nd International Conference on Biofilm Reactors, IAWQ, Paris, Frace, 239-245. Gujer W., Henze, M., Mino, T. and Van Loosdrecht, M.C.M (1999). “Activated sludge model No.3”. Wat. Sci. Tech., 39(1), 183-193. Henze, M., Grady, C.P.L., Gujer, W., Marais, G.v.R., and Matsuo, T. (1987). “ Activated sludge model No.1”. Sci. Tech. Report No.1, Int. Assoc. Water Pollut. Res. Control, London, U.K. Henze, M., Gujer, W., Mino, T., Matsuo,T.,Wentzel, M.C., and Marais, G.v.R. (1994). “Activated sludge model No.2.” Sci. Tech. Report No.3, Int. Assoc. Water Qual., London, U.K. Henze, M., Gujer, W., Mino, T., Matsuo, T., Wentzel, M.C., Marais, G.v.R., and Van Loosdrecht, M.C.M.(1999). “Activated sludge model No. 2d, ASM2D”. Wat. Sci. Tech., 39(1), 165-182. Jensen, K.R. (1995). “Effects of integrated fixed film activated sludge on nitrogen removal in biological nutrient removal systems”. MS Thesis, Virginia Tech, Blacksburg, VA 24061. Kissel, J.C., McCarty, P.L., and Street, R.L.(1984). “Numerical simulations of mixed-culture biofilm”. J. Environ.Engr. (ASCE) 110, 393-411. Kondo, M. Hozo, S., and Inamori, Y. (1992). “Simultaneous removal of BOD and nitrogen with anoxic/oxic porous biomass support system”. Wat. Sci. Tech., 26(9-11), 2003-2006. Lessel, T.H. (1991). “First practical experience with submerged rope type (Ringlace) biofilm Reactors for upgrading and nitrification”. Wat. Sci. Tech, 23, 825-834. Lessel, T.H. (1993). “Upgrading and nitrification by submerged biofilm reactors – Experiences from a large scale plant”. Proc.: 2nd International Specialized Conf. On Biofilm Reactors. IAWQ, Sep 29-Oct 1, Paris, 231-238. Liu, H. (1996). “Utilization of captor sponges to maintain nitrification and denitrification in BNR activated sludge at low aerobic MCRTs”. MS Thesis, Virginia Tech, Blacksburg, VA 24061. Mamais, D. and Jenkins, D.. (1992). “The effects of MCRT and temperature on enhanced 13
biological phosphorus removal”. Wat. Sci. Tech., 26(5/6), 955-965. Masuda, S., Watanabe, Y., and Ishiguro, M. (1991). “Biofilm properties and simultaneous nitrification and denitrification in aerobic rotating biological contactors”. Wat. Sci. Tech., 23, 1355-1363. McClintock, S. A., Randall,C.W., Pattarkine,V.M. (1993). “Effect of temperature and Mean Cell Residence Time on biological nutrient removal processes”. Water Environment Research, 65(2), 110-118. McClintock, S.A., Randall, C.W., and Pattarkine, V.M.(1991). “Effects of temperature and mean cell residence time on enhanced biological phosphorus removal”. Proc. Specialty Conf. on Environ. Eng. J. Environ.Eng., Reno, NV.,319-324. Mitta, P.R. (1994). “Utilization of fixed film media in BNR activated sludge systems”. MS Thesis, Virginia Tech, Blacksburg, VA 24061. Morper, M., and Wildmoser, A. (1989). “Improvement of existing wastewater treatment plants efficiencies without enlargement of tankage by application of the Linpor-Process – Case studies”. Proc. Upgrading of Wastewater treatment plants. IAWPRC, International Specialized Conference, Munich, Germany, 3-7. Mÿnch E.V., Lant P., and Keller J. (1996). “Simultaneous nitrification and denitrification in bench-scale sequencing batch reactors”. Water Research, 30(2), 277-284. Press, W.H, Teukolsky, S.A., Vetterling, W.T., and Flannery, B.P.(1992). “Numerical recipes in C: The art of scientific computing”. 2nd , Cambridge University Press, 383-393. Randall, C.W., Brannan, K.L, McClintock,S.A., and Pattarkine, V.M. (1991). “The case for anaerobic reduction of oxygen requirements in biological phosphorus removal system”. Water Envir. Res., 64(6), 824-833. Randall, C.W., Barnard, J.L., Stensel, H.D.(1992). “Design and retrofit of wastewater treatment plants for biological nutrient removal”. Water Quality Management Library. Vol.5. Technical Publishing Company, Inc., Allentown, PA. Randall, C.W., and Sen, D.(1996). “Full scale evaluation of an integrated fixed film activated sludge (IFAS) process for enhanced nitrogen removal”. Wat. Sci. Tech., 33(12), 155-162. Randall, C.W. (1997). “Activated Sludge: Lastest developments and a look into the future”.
14
CIWEM Conference: Activated Sludge into the 21st Century”. The University of Manchester, England. 17-19 September 1997. 30 pages. CIWEM Services Ltd. 15 John Street, London, WCIN 2EB, England. Rittmann, B.E., and McCarty, P.L. (1980a). “Model of steady-state-biofilm kinetics”. Biotechnol. Bioeng., 22, 2343-2357. Rittmann, B.E., and McCarty, P.L. (1980b). “Evaluation of steady-state-biofilm kinetics”. Biotechnol, Bioeng., 22, 2359-2373. Rittmann, B.E., and Manem, J.A. (1992). “Development and experimental evaluation of a steady state, multispecies biofilm model”. Biotechnol Bioeng, 39, 914-922. Robertson, L.A., et al. (1988). “Simultaneous nitrification and denitrification in aerobic chemostat cultures of Thiosphaera pantotropha”. Appl. and Env. Microbiol. 54, 2812. Sen, D., Farren, G.D., Copithorn, R.R., and Randall, C.W., (1993). “Full scale evaluation of nitrification and denitrification on fixed film media (Ringlace) for design of single sludge system”. Proc: Water Environment Federal, 66th Annual Conference, Volume 3-Liquid Treatment Symposium, 137-148, Anaheim, CA. Sen, D., and Randall, C.W.(1994a). “Performance of fixed film media integrated in the activated sludge reactors to enhance nitrogen removal”. Wat.Sci.Tech.,30(11), 13-24. Sen, D., Randall, C.W., Jensen, K., and et al. (1994b). “Design parameters for integrated fixed film activated sludge (IFAS) processes to enhance biological nitrogen removal”. Proc: Water Environment Federal, 67th Annual Conference, Volume 1-Part1 Biological Treatment Systems and Part 2 Biological Nutrient Removal, Chicago, IL. Sen, D.(1995). “COD Removal, Nitrification and Denitrification kinetics and mathematical Modeling of an Integrated Fixed Film Activated Sludge (IFAS) System”. Ph.D. Dissertation, Virginia Tech, Blacksburg, VA 24061. Schonberger, R. (1989). “Conversion of existing primary clarifiers according to the EASC process for biological phosphorus removal”. Proc. Upgrading of Wastewater treatment plants. IAWPRC, International Specialized Conference, Munich, Germany, 3-7. Tsuno, H., Somiya, I., Matsumoto, N., and Sasai, S.(1992). “Attached growth reactor for BOD removal and nitrification with polyurethane foam medium”. Wat. Sci. Tech.,26(9/11). 2035-2038. Watanabe, Y., Masuda, S., and Ishiguro, M. (1992) “Simultaneous nitrification and 15
denitrification in micro-aerobic biofilms”. Wat. Sci. Tech, 26(3/4), 511-522. Wanner O. and Gujer W. (1985). “Competition in biofilms”. Wat. Sci. Tech., 17, 27-44. Wentzel, M.C., Dold, P.L., Ekama, G.A., and Marais, G.v.R. (1989) “Enhanced polyphosphate organism cultures in activated sludge systems. III, Kinetic Model.” Water SA, 15, 89 Williamson, K., McCarty, P.L.(1976a). “A model of substrate utilization by bacterial films”. J. Water Pollut. Control Fed., 48(1), 9-24.
16
Computer Program Development for the Design of IFAS Wastewater Treatment Processes By T. Sriwiriyarat1 and C.W. Randall2
Abstract : The Integrated Fixed Film Activated Sludge Model (IFAS) is a computer-based mechanistic model package that allows steady-state simulation of IFAS wastewater treatment processes. IFAS wastewater treatment systems are activated sludge biological nutrient removal processes that have been enhanced by the addition of biofilm support media into the aerobic zone of the system. This process is used to obtain year round nitrification in activated sludge systems that otherwise could not support it. The IFAS model was developed based on the IAWQ general model for activated sludge and empirical equations for COD uptake and nitrification on biofilm developed at Virginia Tech. The current version of the IFAS Model supports only sponge media; however, the model could be modified for other media if the appropriate equations and parameters are known. Data obtained from an IFAS sponge pilot scale plant treating a weak municipal wastewater supplemented by sodium acetate and phosphates were used to calibrate the model. The calibrated model was then verified with data obtained from experiments using other influent wastewater concentrations and different operating conditions. The model generated ammonia and soluble COD profiles that were insignificantly difference statistically from the experimental data. Enhanced biological phosphorus removal also has been incorporated into the model, but has not yet been verified.
Verification studies are being planned and will be
performed in the future. The IFAS Model satisfactorily predicts carbonaceous removal and nitrification, and has the potential to be a useful tool for scientists and engineers seeking to design and optimize either IFAS or conventional BNR activated sludge systems. It also could be used to troubleshoot full-scale treatment plants. 1
Graduate Student, Civil and Environmental Engineering Department,
418 NEB, Virginia Tech, Blacksburg, VA 24061. 2
The C.P. Lunsford Professor, Civil and Environmental Engineering Department,
418 NEB, Virginia Tech, Blacksburg, VA 24061.
17
INTRODUCTION
The growth rate of nitrifiers in the winter, i.e., at low temperatures, is substantially lower than in the summer or fall, i.e., at higher temperatures. To obtain year round complete nitrification with conventional activated sludge systems in temperate zones, the amount of biomass maintained in the aerobic zones must be increased in the winter relative to what is required in the summer and fall. This is usually accomplished by increasing the solids retention time (SRT) of the mixed liquor suspended solids (MLSS) in the activated sludge reactors. This increases the MLSS concentration, which often overloads the secondary clarifiers. Then it is necessary to either increase the clarifier capacity so that more solids can be processed, or to increase the total reactor volume so that the MLSS concentration to the clarifiers is reduced. However, an alternative approached has been developed in recent years, the Integrated Fixed Film Activated Sludge (IFAS) process (Lessel, 1993, Sen and Randall, 1994, Randall and Sen, 1996). This technology integrates biofilm support media into activated sludge aerobic reactors to increase the biomass concentration and enhance nitrification. Experience has shown that it also enhances denitrification in the aerobic zone. The coexistence of suspended growth and attached growth enhances the amount of biomass in the reactor without contributing a substantially to the amount of sludge flowing forward to the secondary clarifier because the additional biomass remains attached to the support media, which is retained in the aerobic reactor.
Extensive pilot-scale studies of IFAS processes have been conducted by Virginia Tech researchers to evaluate different types of media, elucidate the fundamentals of the IFAS mechanisms, and determine the impacts of IFAS on biological nutrients removal systems (Mitta, 1994; Jensen, 1995, Sen, 1995, Liu, 1996). These studies evaluated both rope-like Ringlace media and Captorsponge media. Additionally, the Ringlace media was evaluated and utilized for the upgrade of the 37,850 m3/d Annapolis, Maryland Water Reclamation Facility, and the Captor media was evaluated at the 56,775 m3/d Cox Creek Facility near Baltimore, Maryland (Sen, et al., 1993; Randall, 1996). All of these investigations showed that IFAS could be used to enhance both nitrification and denitrification in activated sludge systems without significantly increasing the solids loading to the secondary clarifiers. 18
Modeling tools that assist engineers or scientist to optimize their designs or to operate wastewater treatment plants (WWTP) are needed to predict the fate of components in the activated sludge system, as well as treated effluent. The models allow exploration through a simulation of alternative wastewater treatment plant configurations, inputs, and operational strategies. Once the model is calibrated to a particular wastewater, the model can be applied to screen the potential process designs and to eliminate the inefficient and uneconomic designs. The objective of this project was to develop, a user-friendly computer-based model that could be used to evaluate IFAS systems and compare them with conventional BNR and fully aerobic actiavted sludge systems. The goals were to develop a computer-based mechanistic and empirical IFAS model that would forecast the simultaneous COD removal, nitrification, and denitrification processes occurring in a properly functioning IFAS system, and enable comparison with nonIFAS activated sludge system.
MODEL DEVELOPMENT
The model developed was designed to provide the same benefits as the mechanistic general model for biological nutrient removal activated sludge systems, initially developed at the University of Cape Town, adapted by the International Association on Water Quality (IAWQ) as Activated Sludge Model No. 1 (ASM1), and subsequently modified by Barker and Dold (1997). The rate expressions used were a combination of those employed by Barker and Dold (1997) for their adaptation of the general model, and empirical IFAS equations developed by Sen (1995) and co-workers. The ASM1 model is a mechanistic model for carbonaceous organic removal, nitrification, and denitrification (Henze, 1987), which was subsequently modified to ASM2 by incorporating the excess biological phosphorus removal model developed by Wentzel, et al. (1989) at the University of Cape Town. The details of the general model will not be discussed in this paper, but the reader is referred to the literature cited above.
The amount of substrate uptake by biofilm on integrated media was established by the empirical equations developed by Sen and co-workers. The mass balance equations were then established with the appropriate rate expressions. The IFAS program solves these mass balance 19
equations simultaneously as a system of nonlinear equations using the Modified Newton techniques. Various assumptions were made to simplify the complex activated sludge system model, which are listed as follows:
-
No diffusion of nitrate from the bulk solution into the biofilm. Therefore, the concentration of nitrate in the mixed liquor may be slightly higher than the true concentration in the aerobic zone because nitrate is not denitrified by the biofilm.
-
No excess biological phosphorus removal will be accomplished by the biomass growth on the supporting media. Only normal phosphorus uptake for biofilm growth is incorporated into the equations.
-
Sufficient alkalinity is assumed to be provided to the system in the simulation of the model. Therefore, the alkalinity component is not included in the mechanistic equations.
-
No nitrite accumulation occurs in the system. All nitrite nitrogen is assumed to be rapidly converted to nitrate by Nitrobactor spp., except when DO is limiting.
-
No biomass in the incoming influent wastewater. Therefore, no influent biomass effects on the performance of the system.
-
pH is constant and near neutrality to ensure optimum biological activity.
Nitrification Rates for Biofilm on Sponge Cuboids The maximum ammonium-nitrogen (NH4+-N) uptake rate of the sponge biofilm (qm,Nitr,sp) was determined at low soluble biodegradable COD (SCODbio) levels to minimize nitrogen uptake by the heterotrophs (Sen ,1995; Sen et al., 1995). AmmoniumN levels, greater than 10 mg N/L, and dissolved oxygen (DO) above 7 mg/L were provided to achieve zero order nitrification rates with respect to ammonium-N and DO. It was established by Sen (1995) that the relationship between SCODbio and NH4+-N was such that the NH4+-N uptake rate was inhibited if the concentration of SCODbio was above 10 mg/L, as shown in Equation 1. A possible explanation is space competition pressure as defined by the multi-species biofilm theory (Rittmann and Manem, 1992, and Wanner and Gujer, 1985). The higher specific growth rate heterotrophs utilize SCODbio 20
and grow at the surface layer of the biofilm. The slow-growing nitrifiers are forced deeper into the biofilm layer and experience greater mass transport resistance, particularly a inadequate supply of DO.
q m, Nitr, sp =
A NH 4 − N K SN K SN + SCOD bio − 10
(1)
where ANH4-N = 4.4 mg NH4+-N per sponge cuboid per day at 12 oC, and KSN = Half saturation coefficient = 9.4 mg/L SCODbio at 12 oC When the SCODbio is less than 10 mg/L, the nitrification rate is controlled by the NH4+-N concentration in the mixed liquor. It is represented by Equation 2. q m, Nitr, sp = 1.055 NH 4 + − N
(2)
COD Uptake Rate for Biofilm on Sponge Cuboids
Batch tests were carried out with sponge media and mixed liquor to determine a maximum COD uptake rate for sponge biofilm (qm, COD, sp). The determination by Sen (1995) from the experimental data showed that the rate was related to the SCODbio in the mixed liquor as follows:
q m, COD, sp =
A SCOD bio SCOD bio K SM + SCOD bio
+C
When C = 0 mg SCOD/sponge/day, which was the best fit, ASCODbio = 51.5 mg SCOD per sponge per day at 12 oC KSM = Half saturation coefficient = 19.3 mg/L SCODbio at 12 oC
21
(3)
The overall rate equation for nitrification was adapted from Barker and Dold, 1997, and the number relates back to their numbering system for rate equations. It combines nitrification in the mixed liquor and on the biofilm, and can be expressed as follows: � �� � NH4 − N DO r16 = µA � úZA + ú� �� K NH, SS + NH4 − N ú� �� KO, AUT, SS + DOú� �
YAq m, Nitr, sp � ��
� � � NH4 − N DO ú� úSponge K NH, BF + NH4 − Nú� �� KO, AUT, BF + DOú�
(4)
The overall aerobic growth rate of heterotrophs with acetate as a carbon source and ammonium nitrogen as a nitrogen source is: � � � � � � � � S BSA DO NH 4 − N PO 4 − P r1 = µ H � ú� ú� ú� úZH + �� K SH , SS + S BSA ú� �� K O, HET , SS + DO ú� �� K NA, SS + NH 4 − N ú� �� K GRO , SS + PO 4 − P ú� � � � � S BSA DO YH q m, COD , sp � ú� úSponge �� K SH , BF + S BSA �ú �� K O, HET , BF + DO �ú
(5)
The above growth rate is also applied for process rates using SBSC as the substrate and NO3- as the electron acceptor (Barker and Dold, 1997).
At steady state, the biofilm detachment rate must be equal to the biofilm growth rate. Therefore, excess microorganisms from biofilm growth are detached to the mixed liquor. The degree of detachment depends on the turbulence in the mixed liquor. First order decay rates are used for both the suspended growth and the attached biomass.
PROGRAM DEVELOPMENT AND OPERATION
IFAS was written for IBM-PC compatible microcomputers in Borland C++ Builder suite. Borland C++ Builder package was chosen because it provides the visual productivity of Delphi while it permits work in a C++ environment. The system was designed for utilization with a 32 22
bit Windows based program. IFAS program was written and compiled on Windows 98 and is compatible with Windows 95/98 or Windows NT. Many functions were added to the program to make it user-friendly and interactive to users. IFAS allows the user to enter the specific operating and design data, in addition to the wastewater characteristics. The system MCRT is used instead of the aerobic MCRT because the system MCRT is a more general design parameter than aerobic MCRT. The user is able to select either an IFAS or a Conventional Activated Sludge system.
The CAS system of this program is a general activated sludge plant configuration without media integrated in the aerobic zone, and may be either a BNR process or a conventional fully aerobic process. Default kinetic and stoichiometric parameters are provided as well as switching function coefficients to allow simulations for investigative or educational purposes. All parameters must be modified for the specific wastewater characteristics and the mode of operation selected. The functions related to the IFAS process will be disabled if a conventional activated sludge system is selected. The process configuration can be defined by recycle flows, the mixed liquor DO concentration, and the number of reactors. The program allows simulation of tanks in series up to 12 activated sludge reactors in the treatment train. The volume of each reactor must be entered when the process configuration is defined. IFAS then utilizes all information to set up mass balances equations and simulates the fate of all defined components in the wastewater treatment plant. The sludge wastage rate is computed automatically based on the system MCRT. All particulate biomass and inert organic matters entering the secondary clarifiers are assumed to be returned to the process in recycle streams. It is assumed that there is no accumulation of solids with time and that no reactions occur in the clarifier. It also is assumed that there are no particles discharged in the effluent. After the wastage rate is known, the steady state equations are solved simultaneously by the Modified Newton technique using the globally convergent method.
The global technique converges a solution from almost any initial guess or starting point. The system MCRT is employed to compute the initial conditions based on a single complete mixed reactor without sponge media installed. However, the IFAS program will request that the MCRT be reentered with a value different than the MCRT for wastage flow calculation, if the solution does not converge. The results can be presented in several ways after the solution has 23
converged, i.e., as line or bar charts indicating the substrate profile, as a complete printable detailed report, and as a table of all substrate concentrations in each reactor. All results can be exported to different formats such as Excel and HTML to make them easier to manipulate. In other words, the data can be manipulated by different programs even if the computer does not have the IFAS program installed.
MODEL CALIBRATION AND EVALUATION
A large number of kinetic and stoichiometric parameters taken from the literature and experimental data were used to calibrate the IFAS model. Pilot plant experiments treating a weak municipal wastewater supplemented by sodium acetate and phosphates were conducted using pilot-scale systems located on the Blacksburg campus of Virginia Tech (Sen, 1995). Wastewater was pumped from an adjacent sewer, and then stored for 24 hours inside the small building containing the pilot systems. The 24 hour storage period was used to bring the wastewater to temperature equilibrium, accomplish removal of any DO and nitrates contained in the sewage, and to allow some fermentation of the organic compounds. Because the wastewater was weak in biodegradable fermentable organics, acetate was added until it was approximately 66 percent of the influent COD. This percentage of acetate was used to describe the influent wastewater characteristics in the model predictions.
The two pilot plant systems simulated the UCT/VIP process configuration. Sponges were added to the aerobic zone of one of the systems for IFAS evaluation, and the other was used as a BNR control. Both treatment trains consisted of two anaerobic tanks, two anoxic tanks, and three aerobic tanks in series. Experiments were carried out at different aerobic MCRTs and operating conditions. Data from these experiments were utilized to establish the yield coefficient (YH), the decay rate (bH), the maximum substrate utilization rates by the MLSS and the biofilm (qmH), and the half saturation constant (KSH) for the heterotrophs. The maximum growth rate (µmax) and YH determined from these experiments were converted to COD units to consistency with COD mass balance determinations and in conformance with the IAWQ models.
24
The influent wastewater in these experiments was fully characterized into COD, TKN, and TP fractions, i.e., biodegradable, nonbiodegradable, ammonia, nitrate, etc., for input into the program. Other kinetic, stoichiometric and switching function parameters for the three types of bacteria in BNR systems were taken from the general model (Barker and Dold, 1997). Some parameters were adjusted to obtain the best fit of the model to the experimental data. A single set of kinetic and stoichiometric parameters produced accurate predictions for both systems and five different aerobic MCRTs per system. The calibrated values of the stoichiometric, kinetic, and switching function parameters are listed in Table 1 to 3. The parameters associated with excess phosphorus removal are not presented in this paper.
25
Table 1. Stoichiometric parameters for the IFAS model Symbol
Characterization
Value
Units
Non-polyP Heterotrophs
Yhaer
Aerobic yield
0.582 mg cell COD yield (mg COD utilized)-1
Yhanx
Anoxic yield
0.440 mg cell COD yield (mg COD utilized)-1
Yhana
Anaerobic yield
0.440 mg cell COD yield (mg COD utilized)-1
Yac
Fermentation Sbsa yield
0.700 mg Sbsa COD (mg Sbsc COD)-1
Eanox
Anoxic hydrolysis efficiency factor
0.700 mg Sbsc COD (mg Senm COD)-1
Eana
Anaerobic hydrolysis efficiency
0.500 mg Sbsc COD (mg Senm COD)-1
factor 0.085 mg N (mg COD active organisms)-1
Fnzh
Nitrogen content of active mass
Fnzeh
Nitrogen content of endogenous mass 0.085 mg N (mg COD endogenous residue)-1
Fpzh
Phosphorus content of active mass
0.021 mg P (mg COD active organisms)-1
Fpzeh
Phosphorus content of endogenous
0.021 mg P (mg COD endogenous residue)-1
mass Feph
Fraction of active mass remaining as endogenous residue
0.080 mg COD endogenous mass (mg COD active mass)-1
Fcvh
COD:VSS ratio
1.420 mg COD (mg VSS)-1
Autotrophs
Ya
Yield
0.142 mg cell COD yield (mg N utilized)-1
Fnza
Nitrogen content of active mass
0.085 mg N (mg COD active organisms)-1
Fnzea
Nitrogen content of endogenous mass 0.085 mg N (mg COD endogenous residue)-1
Fpza
Phosphorus content of active mass
0.021 mg P (mg COD active organisms)-1
Fpzea
Phosphorus content of endogenous
0.021 mg P (mg COD endogenous residue)-1
mass Fepa
Fraction of active mass remaining as endogenous residue
0.080 mg COD endogenous mass (mg COD active mass)-1
Fcva
26
COD:VSS ratio
1.420 mg COD (mg VSS)-1
Table 2 Kinetic parameters for the IFAS model at 20 oC Symbol
Characterization
Value
Units
θT
Non-polyP Heterotrophs
µH
Maximum specific growth rate
6.423
d-1
1.030
KSH,SS
Half saturation coefficient for suspended
60.805
mg COD L-1
1.030
60.085
mg COD L-1
1.030
d-1
1.055
solids growth KSH,BF
Half saturation coefficient for biofilm growth
BH
Decay rate
0.064
ηS,ANX
Anoxic solubilization factor
1.000
ηS,ANA
Anaerobic solubilization factor
0.500
ηGRO
Anoxic growth factor
0.496
KH
Maximum specific hydrolysis rate
4.450
d-1
1.050
KX
Half saturation coefficient for hydrolysis
0.150
mg COD (mg COD)-1
1.000
KC
Maximum specific fermentation growth
4.000
d
-1
1.029
rate KS,ANA
Fermentation half saturation growth rate
5.000
mg COD L-1
1.000
KR
Ammonification rate
0.080
L (mg COD.d)-1
1.029
ASCODbio Maximum utilization rate on sponge
65.239 mg SCODbio(sponge.d)-1 1.030
KSM
24.423
mg SCOD L-1
1.030
Half saturation coefficient for COD utilization
Autotrophs
µA
Maximum specific growth rate
0.545
d-1
1.030
KNH,SS
Half saturation coefficient for mixed
1.495
mg N L-1
1.060
1.495
mg N L-1
1.060
liquor growth KNH,BF
Half saturation coefficient for biofilm growth
BA
Decay rate
0.035
d-1
1.060
ANH4-N
Maximum nitrification rate on sponge
5.574
mg NH4N (sponge.d)-1
1.030
KSN
Half saturation coefficient on sponge
14.982
mg SCOD L-1
1.060
27
Table 3 Switching function parameters for the IFAS model Symbol
Characterization
Value
Units
Mixed Liquor Section
KO,HET,SS
DO limit for heterotrophs in mixed liquor
0.700 mg O2 L-1
KO,AUT,SS
DO limit for autotrophs in mixed liquor
0.500 mg O2 L-1
KNA,SS
Ammonia limit in mixed liquor
0.005 mg N L-1
KNO,SS
Nitrate limit in mixed liquor
0.100 mg N L-1
KGRO,SS
Phosphate limit in mixed liquor
0.005 mg P L-1
KO,HET,BF
DO limit for heterotrophs in biofilm
2.000 mg O2 L-1
KO,AUT,BF
DO limit for autotrophs in biofilm
3.000 mg O2 L-1
KNA,BF
Ammonia limit in biofilm
2.000 mg N L-1
Biofilm Section
RESULTS AND DISCUSSION
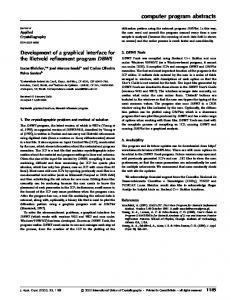
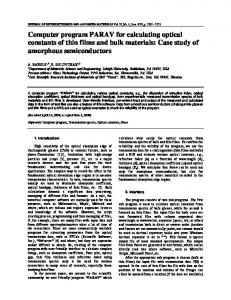
Comparison of the experimentally determined substrate profiles with predicted values from IFAS showed that the IFAS model predictions produced accurate profiles for all systems and different operating conditions. Most estimated soluble COD and ammonium-N profiles fell within the range of values of the experimental data as shown in Figure 1, 2, 5, 6, 7, and 8. That is, the IFAS predictions were statistically insignificantly different from the experimental data. However, as expected, the predicted nitrate profiles were higher in the aerobic zones of the IFAS sponge system because it was assumed that no nitrate in bulk solution diffused to the biofilm. In fact, it is know that nitrates do diffuse into the biofilm and this results in substantial denitrification.
Figure 1 presents the soluble COD profiles in the IFAS system at 3.1 and 1.0 day aerobic MCRTs as were determined by experiment, and compares them with predictions by Sen’s spreadsheet IFAS model, and the modified IFAS model of this research. A much better prediction of the soluble COD profile was obtained with the modified IFAS model compared to
28
Sen’s spreadsheet model by incorporating a hydrolysis term for the particulate COD. The SCOD profiles in the control system for the same operating conditions are shown in Figure 2.
Figures 3 and 4 show the MLVSS profiles for both systems. It was noted that the predictions by both models for the last anoxic and first two aerobic reactors (Figure 4) did not quite agree with the experimental data. It is likely that there were analytical errors during the experiments that resulted in the observed differences.
In Figures 5, 6, 7, and 8, the predicted ammonium-nitrogen from IFAS program compared well with the experimental data. This was an improvement over the spreadsheet version, which included the biodegradable organic nitrogen in the profiles. In the IFAS predictions, all slowly biodegradable substrate and biodegradable organic nitrogen were accounted for by including them in the SCODbio and NH4+-N profiles through hydrolysis processes. However, both versions can predict satisfactorily over the aerobic zones for both the SCOD and ammonium profiles because the fractions of particulate COD and organic nitrogen were quite low in the aerobic reactors. Further investigation of substrate profiles in the biofilm is needed to model the amount of nitrate denitrified in the biofilm.
29
Soluble COD(Exp, Excel, IFAS) (mg/L)
600 TCOD
Experimental Data Excel = SCOD + P-CODbio IFAS Model Prediction
500 400 300 200 100 UCT/VIP IFAS System at 3.1 day Aer MCRT 0 Influent
1 2 Anaerobic
3
4 Anoxic
5
6 Aerobic
7
Soluble COD(Exp, Excel, IFAS) (mg/L)
Reactor No. 600
Experimental Data Excel = SCOD+ P-CODbio IFAS Model Prediction
TCOD
500 400 300 200 100
UCT/VIP IFAS System at 1.0 day Aer MCRT 0 Influent
1
2
Anaerobic
3
4 Anoxic
5
6 Aerobic
Reactor No. Figure 1. Experimental Data and Model Predictions for SCOD, IFAS-Sponge System at 12 oC
30
7
Soluble COD(Exp, Excel, IFAS) (mg/L)
600 TCOD
Experimental Data Excel = SCOD+P-CODbio
500
IFAS Model Prediction
400 300 200 100 UCT/VIP Control System at 3.1 day Aer MCRT 0 Influent
1 2 Anaerobic
3
4
5
Anoxic
6 Aerobic
7
Soluble COD(Exp, Excel, IFAS) (mg/L)
Reactor No. 600 TCOD 500
Experimental Data Excel = SCOD+P-CODbio
400
IFAS Model Prediction
300 200 100 UCT/VIP Control System at 1.0 day Aer MCRT 0 Influent
1
2
Anaerobic
3
4 Anoxic
5
6 Aerobic
Reactor No. Figure 2. Experimental Data and Model Predictions for SCOD, Control System at 12 oC
31
7
2000 1800
MLVSS (mg/L)
1600 1400
3.1 days Aer MCRT
1200 1000 800 600 400
1.0 day Aer MCRT
200 0 Influent
1 2 Anaerobic
3
4 Anoxic
5
6 Aerobic
7
Reactor No. Experimental MLVSS at 3.1 day Aer MCRT IFAS MLVSS Prediction at 3.1 day Aer MCRT Experimental MLVSS at 1.0 day Aer MCRT IFAS MLVSS Prediction at 1.0 day Aer MCRT Figure 3. MLVSS Profiles of IFAS System with UCT/VIP Configuration at 12 oC
32
2000 1800
MLVSS (mg/L)
1600
3.1 days Aer MCRT
1400 1200 1000 800 600 400 200
1.0 day Aer MCRT
0 Influent
1
2 Anaerobic
3
4 Anoxic
5
6 Aerobic
7
Reactor No. Experimental MLVSS at 3.1 days Aer MCRT IFAS MLVSS Prediction at 3.1 days Aer MCRT Experimental MLVSS at 1.0 day at Aer MCRT IFAS MLVSS Prediction at 1.0 day Aer MCRT o
Figure 4. MLVSS Profiles of Control System with UCT/VIP Configuration at 12 C
33
12
80
10 TKN 8
50 40
6
30
4
20
2
-
60
NO3 -N (mg N/L)
+
NH4 -N, UnoxN (mg N/L)
70
10 0
0 UCT/VIP IFAS System at 3.1 day Aer MCRT Influent
1
2
3
Anaerobic
4
5
Anoxic
6
7
Aerobic
Reactor No. +
Experimental NH4 -N +
ExcelUnoxN = NH4 -N + NBS + NBP +
IFAS NH4 -N Prediction -
IFAS NO3 -N Prediction -
Experimental NO3 -N +
-
o
Figure 5. Experimental Data and Model Prediction for NH4 -N, NO3 -N, IFAS-Sponge System at 12 C
34
10
70
TKN
8
60 50
6
40 4
-
30
NO3 -N (mg N /L)
+
NH4 -N, UnoxN (mg N/L)
80
20
2
10 0
0 UCT/VIP IFAS System at 1.0 day Aer MCRT Influent
1
2
3
Anaerobic
4
5
Anoxic Reactor No.
6
7
Aerobic
+
Experimental NH4 -N +
ExcelUnoxN = NH4 -N + NBS + NBP +
IFAS NH4 -N Prediction -
Experimental NO3 -N -
IFAS NO3 -N Prediction +
-
o
Figure 6. Experimental Data and Model Prediction for NH4 -N and NO3 -N, IFAS-Sponge System at 12 C
35
10
70 8
TKN
60 50
6
40 4
-
30
NO3 -N (mg N/L)
+
NH4 -N, UnoxN (mg N/L)
80
20
2
10 0
0 UCT/VIP Control System at 3.1 day Aer MCRT Influent
1
2
3
Anaerobic
4
5
Anoxic
6
7
Aerobic
Reactor No. +
Experimental NH4 -N +
ExcelUnoxN = NH4 -N + NBS + NBP IFAS NH4+-N Prediction -
Experimental NO3 -N -
IFAS NO3 -N Prediction +
-
o
Figure 7. Experimental Data and Model Predictions for NH4 -N and NO3 -N, Control System at 12 C
36
60
0.6
55
0.4
50
0.2
45
0.0
-
0.8
+
NH4 -N, UnoxN (mg N/L)
TKN
65
NO3 -N (mg N/L)
1.0
70
UCT/VIP Control System at 1.0 Aer MCRT 40 Influent
1 2 Anaerobic
3
4 Anoxic
5
6
7
Aerobic
Reactor No. +
Experimental NH4 -N ExcelUnoxN = NH4+N + NBS + NBP +
IFAS NH4 -N Prediction -
Experimental NO3 -N -
IFAS NO3 -N Prediction Figure 8. Experimental Data and Model Predictions for NH4+-N and NO3--N, Control System at 12 oC
37
CONCLUSION
An IFAS computer model package that predicts carbonaceous removal, nitrification, and denitrification at steady state conditions in activated sludge systems with either integrate sponge media (IFAS) in the aerobic zone or without integrated media was developed. The model is based on the general model of Barker and Dold (1997) integrated with empirical equations developed by Randall, Sen and co-workers at Virginia Tech from IFAS pilot-scale and full-scale studies. The model was calibrated using kinetic and stoichiometric coefficients from the literature and the experimental pilot plant studies. The model predictions agreed very well with the experimental data from the pilot studies. The soluble COD and NH4+-N concentrations obtained using the IFAS program closely agreed with the observed results, which was a substantial improvement over the spreadsheet IFAS version developed by Sen (1995). The nitrate profiles could be further improved by incorporating the nitrate flux into the biofilm into the program, but further experimental work is required before this will be possible
The developed model has the potential to be a useful tool for engineers or scientists who desire to design or operate IFAS systems to obtain year round nitrification. The IFAS program also can be used to predict the location and amount of sponge media needed to optimize the design and operation of IFAS systems.
APPENDIX I. REFERENCES
Barker, P.S., and Dold, P.L. (1997). “General model for biological nutrient removal activated sludge systems: model presentation”. Water Environment Research., 69(5), 969-984. Henze, M., Grady, C.P.L., Gujer, W., Marais, G.v.R., and Matsuo, T. (1987). “ Activated sludge model No.1”. Sci. Tech. Report No.1, Int. Assoc. Water Pollut. Res. Control, London, U.K. Jensen, K.R. (1995). “Effects of integrated fixed film activated sludge on nitrogen removal in biological nutrient removal systems”. MS Thesis, Virginia Tech, Blacksburg, VA 24061. Liu, H. (1996). “Utilization of captor sponges to maintain nitrification and denitrification in
38
BNR activated sludge at low aerobic MCRTs”. MS Thesis, Virginia Tech, Blacksburg, VA 24061 Mitta, P.R. (1994). “Utilization of fixed film media in BNR activated sludge systems”. MS Thesis, Virginia Tech, Blacksburg, VA 24061. Randall, C.W., and Sen, D. (1996). “Full-scale evaluation of an integrated fixed-film activated sludge (IFAS) process for enhanced nitrogen removal.” Wat. Sci. Tech. 33(12), 155-162. Sen, D., Farren, G.D., Copithorn, R.R., and Randall, C.W. (1993). “Full scale evaluation of nitrification and denitrification on fixed film media (Ringlace) for design of single sludge system”. Proc: Water Environment Federal, 66th Annual Conference, Volume 3-Liquid Treatment Symposium, 137-148, Anaheim, CA. Sen, D. (1995). “ COD removal, nitrification, and denitrification kinetics and mathematical modeling of an integrated fixed film activated sludge (IFAS) system.” Ph.D. Thesis, Dept. of Civil and Environmental Engineering, Virginia Tech, Blacksburg, Virginia. Sen, D., Randall, C.W., and Liu, H. (1995). “Effect of suspended solids MCRT on COD and nitrogen removal kinetics of biofilm support media integrated in activated sludge systems”. Proc: Water Environment Federal, 68th Annual Conference & Exposition, Session No. 34, Miami, FL. Wentzel, M.C., Dold, P.L., Ekama, G.A., and Marais, G.v.R. (1989) “Enhanced polyphosphate organism cultures in activated sludge systems. III, Kinetic Model.” Water SA, 15, 89
APPENDIX II. NOTATION
Aer MCRT
= Aerobic MCRT (day)
DO
= Dissolved oxygen (mg O2/L)
NBP
= Particulate biodegradable organic nitrogen (mg N/L)
NBS
= Soluble biodegradable organic nitrogen (mg N/L) +
NH4 -N
= Ammonium nitrogen (mg N/L)
NO3--N
= Nitrate nitrogen (mg N/L)
MLVSS
= Mixed Liquor Volatile Suspended Solids (mgCOD/L)
VSS
= Volatile Suspended Solids (mg MLVSS/L).
P-CODbio
= Particulate biodegradable COD (mg COD/L)
39
PO4-P
= Soluble orthophosphate (mg P/L)
SCFA
= Short Chain Fatty Acid (mg COD/L)
SBSA
= Soluble readily biodegradable SCFA COD (mg COD/L)
SBSC
= Soluble readily biodegradable complex COD, non-SCFA (mg COD/L)
SCOD
= Total Soluble COD = SBSA + SBSC + SUS (mg COD/L)
SCODbio
= Soluble biodegradable COD = SBSA + SBSC (mg COD/L)
Sponge
= Number of sponge cuboid (Sponge/L)
SUS
= Soluble unbiodegradable COD (mg COD/L)
TCOD
= Total COD (mg COD/L)
TKN
= Total Kjeldahl nitrogen (mg N/L)
UCT/VIP
= University of Cape Town/Virginia Initiative Project
UnoxN
= Unoxidized Nitrogen = NH3-N/NH4+-N + NBP + NBS (mg N/L)
ZA
= Autotrophic organism mass (mg COD/L)
ZH
= Non-polyP heterotrophic organism mass (mg COD /L)
40