PNNL-16145
Concepts Associated with Transferring Temporal and Spatial Boundary Conditions Between Modules in the Framework for Risk Analysis in Multimedia Environmental Systems (FRAMES)
G. Whelan K. J. Castleton M. A. Pelton
October 2006
Prepared for Office of Nuclear Regulatory Research U.S. Nuclear Regulatory Commission Rockville, Maryland under Contract DE-AC05-76RL01830
DISCLAIM ER This report was prepared as an account of work sponsored by an agency of the United States Government. Neither the United States Government nor any agency thereof, nor Battelle M emorial Institute, nor any of their employees, makes any warranty, express or implied, or assumes any legal liability or responsibility for the accuracy, completeness, or usefulness of any information, apparatus, product, or process disclosed, or represents that its use would not infringe privately ow ned rights. Reference herein to any specific commercial product, process, or service by trade name, trademark, manufacturer, or otherwise does not necessarily constitute or imply its endorsement, recommendation, or favoring by the United States Government or any agency thereof, or Battelle Memorial Institute. The views and opinions of authors expressed herein do not necessarily state or reflect those of the United States Government or any agency thereof.
PACIFIC NORTHW EST NATIONAL LABORATORY operated by BATTELLE for the UNITED STATES DEPARTM ENT OF ENERGY under Contract DE-AC05-76RL01830
Printed in the United States of America Available to DOE and DOE contractors from the Office of Scientific and Technical Information P.O. Box 62, Oak Ridge, TN 37831-0062; ph: (865) 576-8401 fax: (865) 576-5728 email:
[email protected]
Available to the public from the National Technical Information Service, U.S. Department of Commerce, 5285 Port Royal Rd., Springfield, VA 22161 ph: (800) 553-6847 fax: (703) 605-6900 email:
[email protected] online ordering: http//www.ntis.gov/ordering.htm
PNNL-16145
Concepts Associated with Transferring Temporal and Spatial Boundary Conditions Between Modules in the Framework for Risk Analysis in Multimedia Environmental Systems (FRAMES)
G. Whelan K. J. Castleton M. A. Pelton
October 2006
Prepared for Office of Nuclear Regulatory Research U.S. Nuclear Regulatory Commission Rockville, Maryland under Contract DE-AC05-76RL01830
Pacific Northwest National Laboratory Richland, Washington 99352
Summary The concept of a framework (i.e., confederation of models) is critical in the design philosophy of developing more holistic technology software systems, which allows for more systematic analyses of complex problems. Models are designed to perform a specific set of calculations and tend to describe a given real-world phenomenon (e.g., fate and transport in an aquifer, exposure to contaminated sediments). Their general design tends to be specific and does not lend itself as a medium to link other disparate components together, which in fact may more accurately describe a solution to the problem. The framework takes on the responsibility for connectivity, while the model takes on the responsibility of consuming and producing information as part of the system. The Framework for Risk Analysis in Multimedia Environmental Systems (FRAMES) provides the capability of integrating a variety of DOS and Windows-based environmental codes. FRAMES is a software platform that allows for the seamless linkage of disparate models, databases, and frameworks to contain and provide the following major attributes: 1) PC Windows-based, 2) Plug&Play to allow users to import their own models into the system without the aid of a system developer, 3) Drag&Drop real-world icon objects to allow analysts to graphically describe the Conceptual Site Model and tailor solutions, 4) system viewers (graphical & tabular), 5) Monte Carlo sensitivity/uncertainty wrapper, 6) capability to expand to be web accessible, thus allowing a user the possibility of linking to a model or database at a remote location, and 7) the capability to link databases of choice. To confirm smooth lines of communication between models, every framework must address issues with time, space, and feedback between models. These issues become pronounced when the frameworks attempt to link legacy numerical models, passing critical information between each other through boundary conditions. The current version of FRAMES places the responsibility on the models themselves to interpret any spatial and temporal differences that exist between the models. Although FRAMES was founded on the principle that all models and the framework have shared responsibilities, the framework should also try to facilitate the seamless linkage between models by providing software tools for those procedures that seem to repeat themselves when software developers link their models into the system. Three critical areas that tend to create issues with linking disparate models on the fly include time, space, and dynamic feedback. Every model handles time and space in its own way, so the trick is to capture the essence of these needs such that unacceptable errors are not propagated between models when they communicate. Dynamic feedback is linked to both time and space, and it creates the added problem of where to define the start location of the simulation if there is a closed loop. This document describes concepts associated with transferring temporal and spatial boundary conditions between modules in FRAMES and how FRAMES might consider dynamic feedback.
iii
Acronyms and Abbreviations API
Application Programming Interface
CORBA
Common Object Request Broker Architecture
CPU
Central Processing Unit
CSM
Conceptual Site Model, simplified description of the environmental problem to be modeled
DAG
Directed Acyclic Graph
DG
Directed Graph
DIC
DICtionary, metadata associated with datasets
DLL
Dynamic Link Library
DOS
Disk Operation System, basic operation system on the computer
FRAMES
Framework for Risk Analysis in Multimedia Environmental Systems
FUI
Framework User Interface
I/O
Input/Output
MUI
Module User Interface
OS
Operating System
pid
Process IDentifier
RMI
Remote Method Invocation
RPC
Remote Procedure
v
Acknowledgments The authors would like to extend their appreciation to the Pacific Northwest National Laboratory’s Dr. James G. Droppo, Jr. for reviewing the material and Mr. Wayne Cosby for the final edit of the document. This work was funded by the U.S. Nuclear Regulatory Commission under Contract DE-AC05-76RL01830.
vii
Contents
Summary . . . . . . . . . . . . . . . . . . . . . . . . . . . . . . . . . . . . . . . . . . . . . . . . . . . . . . . . . . . . . . . . . . . . . . . . . . iii Acronyms and Abbreviations . . . . . . . . . . . . . . . . . . . . . . . . . . . . . . . . . . . . . . . . . . . . . . . . . . . . . . . . . . v Acknowledgments . . . . . . . . . . . . . . . . . . . . . . . . . . . . . . . . . . . . . . . . . . . . . . . . . . . . . . . . . . . . . . . . . . vii 1.0 Introduction . . . . . . . . . . . . . . . . . . . . . . . . . . . . . . . . . . . . . . . . . . . . . . . . . . . . . . . . . . . . . . . . . . . . 1.1 2.0 Model Connectivity . . . . . . . . . . . . . . . . . . . . . . . . . . . . . . . . . . . . . . . . . . . . . . . . . . . . . . . . . . . . . 2.1 Model Versus Module . . . . . . . . . . . . . . . . . . . . . . . . . . . . . . . . . . . . . . . . . . . . . . . . . . . . . . . . 2.3 Producing and Consuming Model Responsibilities . . . . . . . . . . . . . . . . . . . . . . . . . . . . . . . . . . 2.4 Overlay of Producing and Consuming Model Boundary Conditions . . . . . . . . . . . . . . . . . . . .
2.1 2.1 2.6 2.7
3.0 Spatial Boundary Conditions . . . . . . . . . . . . . . . . . . . . . . . . . . . . . . . . . . . . . . . . . . . . . . . . . . . . . . 3.1 3.1 Georeferencing Considerations . . . . . . . . . . . . . . . . . . . . . . . . . . . . . . . . . . . . . . . . . . . . . . . . . 3.1 3.2 Mapping Upstream and Downstream Spatial Attributes . . . . . . . . . . . . . . . . . . . . . . . . . . . . . . 3.1 4.0 Temporal Boundary Conditions . . . . . . . . . . . . . . . . . . . . . . . . . . . . . . . . . . . . . . . . . . . . . . . . . . . . 4.1 5.0 Dynamic Simulation . . . . . . . . . . . . . . . . . . . . . . . . . . . . . . . . . . . . . . . . . . . . . . . . . . . . . . . . . . . . . 5.1 Directed Acyclic Graph (Dag) Capability . . . . . . . . . . . . . . . . . . . . . . . . . . . . . . . . . . . . . . . . . 5.2 Directed Graph (Dynamic Feedback) Capability . . . . . . . . . . . . . . . . . . . . . . . . . . . . . . . . . . . . 5.3 Software Solution to Dynamic Feedback . . . . . . . . . . . . . . . . . . . . . . . . . . . . . . . . . . . . . . . . . . 5.3.1 Multiple Memory Map Files and Semaphores . . . . . . . . . . . . . . . . . . . . . . . . . . . . . 5.3.2 Named Pipes (Queues) . . . . . . . . . . . . . . . . . . . . . . . . . . . . . . . . . . . . . . . . . . . . . . . . 5.3.3 Remote Procedure Call or Remote Method Invocation . . . . . . . . . . . . . . . . . . . . . . . 5.4 Dynamic Feedback Summary . . . . . . . . . . . . . . . . . . . . . . . . . . . . . . . . . . . . . . . . . . . . . . . . . . .
5.1 5.1 5.2 5.4 5.5 5.5 5.5 5.6
6.0 References . . . . . . . . . . . . . . . . . . . . . . . . . . . . . . . . . . . . . . . . . . . . . . . . . . . . . . . . . . . . . . . . . . . . . 6.1
ix
Figures 2.1. Design of a Module . . . . . . . . . . . . . . . . . . . . . . . . . . . . . . . . . . . . . . . . . . . . . . . . . . . . . . . . . . . . . 2.2. Traditional and Nontraditional Approaches for Linking Models and Transferring Data . . . . . . . . 2.3. Schematic Illustrating the Linkage of Models in FRAMES, Using Its Drag & Drop System User Interface . . . . . . . . . . . . . . . . . . . . . . . . . . . . . . . . . . . . . . . . . . . . . . . . . . . . . . . . . . . . . . . . . . 3.1. Illustrative Example of Producing- and Consuming- Model Boundary Condition Nodes and Associated Polygon Areas . . . . . . . . . . . . . . . . . . . . . . . . . . . . . . . . . . . . . . . . . . . . . . . . . . . . . . . . . 3.2. Illustrative Example of API Procedure for Overlapping Producing and Consuming Model Grid System Boundary Interface Polygons . . . . . . . . . . . . . . . . . . . . . . . . . . . . . . . . . . . . . . . . . . . . . . . . 4.1. Illustrative Example Procedure for Calculating the Mass Flux Rate Curve for a Consuming Polygon from two Overlapping Producing Polygons . . . . . . . . . . . . . . . . . . . . . . . . . . . . . . . . . . . . 5.1. Current Possible Connections in FRAMES-2.0 . . . . . . . . . . . . . . . . . . . . . . . . . . . . . . . . . . . . . . . 5.2. Future Possible Connections in FRAMES-2.0 . . . . . . . . . . . . . . . . . . . . . . . . . . . . . . . . . . . . . . . . 5.3. A More Complex Connection Diagram . . . . . . . . . . . . . . . . . . . . . . . . . . . . . . . . . . . . . . . . . . . . . .
2.2 2.3 2.4 3.1 3.3 4.2 5.2 5.3 5.3
Tables 2.1. Example Module DIC for Boundary-Condition Polygon Locations . . . . . . . . . . . . . . . . . . . . . . . . 2.5 2.2. Example Module DIC for Time-Varying Chemical Groundwater Concentrations by Boundary Condition Polygon . . . . . . . . . . . . . . . . . . . . . . . . . . . . . . . . . . . . . . . . . . . . . . . . . . . . . . . . . . . . . . . 2.5
x
1.0 Introduction The Framework for Risk Assessments in Multimedia Environmental Systems (FRAMES) is a Windows-based software platform that provides an interactive user interface and, more importantly, specifications to allow a variety of Disk Operating System (DOS) and Windows-based codes to be integrated within a single framework. The major components of FRAMES include modules (module user interface, analysis code, and potentially pre- and/or post-processors), the Framework User Interface (FUI), a sensitivity/uncertainty module, and data visualization tools. Modules can accept data from the user or other modules and can calculate some portion of the risk assessment. The FUI allows the user to interact with the system. The sensitivity/uncertainty module allows the user to conduct a Monte Carlo analysis, and the visualization tools allow the user to review results from a particular stage in the process. FRAMES represents middleware for linking models so information can seamlessly pass between these components. A seamless linkage is best confirmed when the design is not parochial or inflexible but sets a standard through which communication can occur. Developing a standard is complicated when different models operate under different time and space constraints, or when dynamic feedback is desired. • Spatial Constraints—Many models with spatial boundary conditions perform their boundary-condition calculations at nodes, as opposed to the areas surrounding the nodes. Each node, though, represents a polygon that surrounds it. It is the polygon, and specifically the vertices of each polygon, that represents the basis for passing information between producing and consuming models. The polygons are described by their vertices portrayed within the model- and scenario-georeferencing system (x, y, z coordinates). • Temporal Constraints—Each model, especially numerical models, calculates time-stepping and has a nodal-spacing mesh that is consistent with its own model while confirming numerical convergence and stability. Temporal considerations for linking models with disparate time-stepping requirements need to be independent of any model. To remove model-specific time stepping from dictating the manner in which models communicate, each of the model’s time-stepping requirements need to be accounted for when passing information between models. • Dynamic Feedback—Most multimedia modeling systems implement a series of models in sequence, not allowing for the assessment to return to a previously executed model. Many times a downsteam model’s simulation should impact an upstream model’s simulation. Dynamic feedback allows a downstream model to provide input to a model that has already partially or fully executed. This document describes concepts associated with transferring temporal and spatial boundary conditions between modules in FRAMES. It also discusses aspects associated with dynamic simulation, that is, the capability of the system to allow for temporal dynamic feedback between models.
1.1
2.0 Model Connectivity Model connectivity addresses the issues associated with confirming the transparent linkage (i.e., how models communicate with each other) between models with different scale and resolution. Scale refers to the physical size and requirements of the problem (e.g., medium-specific, watershed, regional, and global). Resolution refers to the temporal- and spatial-mesh resolution associated with the assessment (i.e., requirements associated with the transfer of data at medium interfaces [i.e., boundary conditions]), designated as low (e.g., structured-value), medium (e.g., analytical), and high (e.g., numerical). For example, an analytical model many times produces output associated with an infinite plane, but a numerical model may use a grid or mess system to describe its boundary condition. Any design should be general enough and structured to confirm that mass is conserved and that the linkage between two models handles most types of traditional models. This section discusses attributes associated with transferring data between two disparate models with potentially differing boundary conditions (spatially and temporally) when linked to FRAMES.
2.1 Model Versus Module A model or code represents the mathematical representation of a process, device, or concept (Sippl and Sippl 1980) coded into a computer language for execution on a computer, which is consistent with current preconceived notions of what a model is. A module consists of a mode description, Module User Interface (MUI) (i.e., input), and the execution code (i.e., run model) that contains pre- and post-processors for converting the model’s input/output for recognition by the model/system. Figure 2.1 illustrates these three basic components of a module, which can be thought of as three separate components of a module. The code description describes what the model is, who you should contact for questions, what information it consumes and produces, the connection schemes with other models that it allows, how the model fits into the system, and how it should be perceived by the system. Figure 2.1 shows that the MUI, input files, and executable are separate from each other. By separating these, any MUI associated with a legacy code can remain unchanged, so users will see no change from expectations developed when they used the original code outside of the framework. The input may come from the user, which is traditionally associated with the MUI, database(s) and upstream models supplying boundary conditions. By distinctly separating the input from the executable, sensitivity/uncertainty analyses on the input data become extremely easy. As such, batch files can be established for multiple runs. Finally, the execution code is represented by the legacy code and its pre- and post-processors. The pre-processor converts the input data that the system recognizes into a format that the model recognizes while the post-processor converts the model output into the standardized system format.
2.2 Dictionaries as Metadata in Frames In the past, the traditional approach for linking models was to directly connect (i.e., “hard-wire”) module types (e.g., aquifer models to river models). Each connection specifically reflected the data needs of the consuming model, resulting in an efficient transfer of data but also resulting in a confusing model structure that is difficult to manage and update. Under the traditional approach, if a user wanted to capability to link several models of a certain type (e.g., 1-D, 2-D, and 3D aquifer models) to several models of a different type (i.e., 1-D, 2-D, and 3-D river models), each model was directly linked (i.e., hard-wired”) to each of the others through a processor.
2.1
Figure 2.1. Design of a Module With this approach, a user chooses which models to hard-wire. Figure 2.2 illustrates the traditional approach for linking models (i.e., module types in Figure 2.2) and transferring data. This hard-wired linkage scheme is very efficient and exact, allowing for direct communication between models and providing an environment for dynamic feedback between models. Unfortunately, as illustrated by Figure 2.2, this scheme can become extremely complicated and unmanageable and does not allow the user the add new models, parameters, data requirements, databases, etc. to the system without having to modify the entire system and revamp legacy models. With the advent of “object-oriented” modeling concepts, each of the models that enters into the system agrees on a data-transfer protocol. The non-traditional approach identifies system data specifications to which models adhere when passing information between model types and databases, as illustrated in Figure 2.2. Pre- and post-data processors allow legacy models to remain unaffected and facilitate the capability to “plug” legacy models directly into the system, enhance quality control, and simplify the management of and modifications to multiple models. This “Plug & Play” attribute is an extremely powerful and desirable feature because it allows users and model developers to insert the most appropriate models to meet specific needs. Data specifications between communicating models represent the “contract” between what the upstream model produces (e.g., aquifer model) and what the downstream model consumes (e.g., river model), also 2.2
Figure 2.2. Traditional and Nontraditional Approaches for Linking Models and Transferring Data referred to as producing and consuming models, respectively. The data specification is similar to the telephone numbers in a telephone book. Both parties agree to the telephone number, and when each wants to communicate, they do so using the appropriate telephone number. Each year the telephone books are updated; as such, the design of the FRAMES must accommodate new models, data requirements, parameters, and linkages but still maintain backward compatibility with existing models in the system. The fundamental responsibility of the framework (i.e., FRAMES) is associated with the arrows that connect the models and databases, as illustrated in Figure 2.3. Those arrows represent the transfer of information from one component to another. The system is charged with managing model and database linkages, the firing sequence of the models, and data transfer between components. The system is not responsible for what happens within the models. The key to a successful transfer is to confirm that the producing component provides information that meets the needs of the consuming component and that the information is in a form that is recognizable by both components. This shared responsibility for managing data transfer is based on datasets, whose metadata information is described by DICtionary (DIC) files. The data DIC file consists of three types of information: 1) parameter declarations, 2) table declarations, and 3) parameter relationships. A data DIC file is a comma-delimited text file that contains the metadata about the data that are contained in a particular dataset. DIC files provide the metadata describing attributes of the
2.3
actual data in datasets. The datasets contain the actual numbers that are consumed and produced by each model and database, using the DIC metadata formats, as illustrated by Tables 2.1 and 2.2.
Figure 2.3. Schematic Illustrating the Linkage of Models in FRAMES, Using Its Drag & Drop System User Interface
2.4
Table 2.1. Example Module DIC for Boundary-Condition Polygon Locations Variable Count 3 Parameter RunInfo
Dictionary Description Location Description The set of strings that describe the run The set of vertices in (x,y,z), where z is vertical
Vertice
Dictionary Name Location Dimension 1
Privilege
Version
Updated
3 DataType String
0 Primary Key FALSE
1 Scalar TRUE
Min 0
2
Float
FALSE
FALSE
0
0
Integer
TRUE
FALSE
0
The set of polygons and their associated vertex indices that make up the polygonal mesh
Poly
Max 80
Measure Units Distance
Stochastic FALSE
Preposition
FALSE
for
m
Indexing Parameter(s) Poly
Vertice
FALSE
Table 2.2. Example Module DIC for Time-Varying Chemical Groundwater Concentrations by Boundary Condition Polygon
3
Dictionary Description ChemGWConc
Dictionary Name ChemGWConc
Parameter
Description
Dimension
Variable Count
Privilege
Version
Updated
3
0
1
DataType Primary Key
Scalar
Min
Max
Measure
Units
Indexing Parameter(s) Stochastic Proposition
RunInfo
The set of strings that describe the run
1
String
FALSE
TRUE
0
TimePts
The set of time points for each location and chemical
4
Integer
FALSE
FALSE
0
4
Float
FALSE
TRUE
0
The dissolved chemical Concentration in the ChemGWConc aquifer at a location, chemical and time point
80
FALSE
Time
yr
Concentration mg/L
2.5
FALSE
TRUE
for
Location. Poly
ChemList.Chem CAS
ChemList.ChemCA SDK
Time Pts
Location. Poly
ChemList.Chem CAS
ChemList.Chem CASDK
Time Pts
2.3 Producing and Consuming Model Responsibilities When two models wish to communicate within FRAMES, they are seeking to successfully transfer data from the upstream, producing model to the downstream, consuming model. FRAMES uses DICs as the standard format to transfer information from one module to another. DICs are metadata and data specifications between communicating models and represent the “contract” between what an upstream model produces and a downstream model consumes. Example DICs are presented in Tables 2.1 and 2.2. The consuming module is charged with • • •
recognizing and understanding the dataset corresponding to the model DIC mapping all spatially indexed parameters to the consuming model’s input requirements confirming that the georeference system associated with the producing model and the assessment scenario is consistent with the consuming model’s georeference system.
The responsibilities of the producing module include processing, mapping, and transforming its output to a standard format described by a model DIC. The producing model is charged with • • • •
populating the dataset corresponding to the model DIC mapping all spatially indexed parameters to meet system requirements mapping all temporally indexed parameters to meet system requirements confirming that the georeference system associated with the producing model is consistent with the assessment scenario.
The boundary-condition data passing from one module to another will be handled through the Application Programming Interface (API) Input/Output (I/O) Dynamic Link Library (DLL). The linkage protocols and design address the mapping of information between modules, specifically passing or calculating geo-spatial data, georeference coordinates, area-based polygons, and fractions of areas that overlap between producing and consuming model coordinate systems. At the linkage or communication boundary, boundary information provided by the producing module includes the following: • •
Spacially dependent, georeferenced coordinates (i.e., vertices), describing points, lines, or polygons Spatially dependent, and constant or time-varying data, associated with each set of vertices (e.g., polygon)
The responsibilities of the consuming module include processing, mapping, and transforming the producing model’s output, as described by the producing module’s coordinate system, to the consuming model’s coordinate system. This involves mapping the producing model’s spatially dependent, georeferenced coordinates onto the consuming model’s spatially dependent, georeferenced coordinates and determining the fractions of areas that overlap. The mapping process will use the producing model’s areas at the boundary that are projected onto the consuming model’s boundary surface. It is recognized that the consuming model may not have programs developed to perform the processing and mapping of and transformation associated with the producing model’s output. Although it is not a responsibility of the system, the API I/O DLL should provide a routine that 1. 2.
calculates area-based polygons associated with producing and consuming model boundary surfaces, as defined by its spatially dependent, georeferenced coordinates maps the producing-model polygons onto the consuming-model polygons 2.6
3. 4.
calculates the fractions of the producing-model polygon areas that overlap with each consumingmodel polygon transforms the boundary conditions from the producing model’s output to the consuming model’s input by combining the producing model’s output in an appropriate manner, so as to define the boundary conditions associated with each consuming model’s boundary-condition polygon.
In other words, if a consuming model needs assistance in transforming a producing model’s output for consumption, a system program will be made available that maps and assigns a producing model’s output to all consuming model’s boundary-condition polygons. Based on this mapping, the consuming model is charged with completing the mapping of the information associated with its polygons to their nodes, if required.
2.4 Overlay of Producing and Consuming Model Boundary Conditions When passing information between modules, the spatial location of the nodes and/or corresponding polygons may not exactly line up (i.e., one-to-one correspondence). Three different spatial conditions describing the overlay of one model’s boundary conditions on another are discussed as follows: 1.
2.
3.
Producing and Consuming Module Boundary Conditions are the Same and Producing and Consuming Nodes may or may not Exactly Align—Each module’s boundary conditions (e.g., timevarying contaminant mass fluxes associated with every boundary-condition polygon) are exactly the same, including units. In this situation, producing and consuming nodes along the boundary interface do not have to line up. Producing and Consuming Modules Boundary Conditions are Different, and Producing and Consuming Nodes Exactly Align—Each module’s boundary interface contains multiple boundary conditions (e.g., time-varying contaminant mass fluxes associated with one polygon and time-varying contaminant concentration associated with an adjacent polygon). Under this situation, producing and consuming nodes exactly align along the boundary interface. Producing and Consuming Modules Boundary Conditions are Different, and Producing and Consuming Nodes do NOT Exactly Align—Each module’s boundary interface contains multiple boundary conditions (e.g., time-varying contaminant mass fluxes associated with one polygon, and time-varying contaminant concentration associated with an adjacent polygon). Under this situation, producing and consuming nodes do NOT exactly align along the boundary interface. This condition will currently NOT be addressed. If the system programs are used to help in transferring information between modules, an error message should be produced when the system senses this situation.
The user needs to produce a dataset meeting the DIC metadata (i.e., expectations from the producing model at the interface) describing the following: 1. 2.
vertices of each cell Information associated with each cell (boundary-condition type), for example a. b. c. d.
Time-varying concentrations Time-varying water flux rates Time-varying mass flux rates Time-varying heads
2.7
Most numerical models produce output at nodes. These data need to be associated with cells (i.e., polygons associated with each node). If the user has no mechanism to compute cells and assign information, then the system provides the following tools: 1. 2. 3. 4.
Calculates projections onto the horizontal or vertical, recognizing that software protocol needs to differentiate different relevant projection types (i.e., vertical or horizontal). Computes an area (i.e., polygon) for each corresponding node (Varonoi technique, or Thiessen method, where the latter name is commonly used in hydrology). Defines vertices. Converts nodal information to cell information (simple assigning) (i.e., time-varying output perpendicular to the cell assigned as the boundary condition).
When these tools are implemented and successfully run, the producing module has met the constraints of meeting the system boundary conditions. If multiple types of boundary conditions (e.g., mass-flux and concentration) exist at the producing-model’s boundary-condition plane, then all producing- and consuming-model nodes are required to exactly align. If only one boundary-condition type (e.g., contaminant concentration) exists across the producing module’s boundary-condition plane, then producing and consuming nodes along the boundary interface do not have to align exactly because fractions can be computed, and superposition can occur. If the consuming model does not have a mechanism to consume the producing-model’s output because it does not match the producing-model’s grid/mesh system, etc., the the system provides a mechanism to convert the producing-cell information to consuming-cell information and possibly tie the converted information back to each consuming-module’s nodes. The system allows the user to choose this option for help to consume information. System software tools that are required to fulfill these capabilities include the following: 1. 2. 3. 4.
5. 6.
Calculate projections onto the horizontal or vertical, recognizing that software protocol needs to differentiate different relevant projection types (i.e., vertical or horizontal). Compute an area (i.e., polygon) for each corresponding node (Varonoi technique or Thiessen method, where the latter name is commonly used in hydrology). Define the vertices. Calculate the fraction of each producing cell that overlaps onto each consuming cell. The producing-cell’s outputs are weighted by the fraction, and the results are superimposed, providing the transformed boundary condition to the consuming cell. Convert the consuming-model’s cell information to nodal information (simple assigning) (i.e., timevarying output perpendicular to the cell assigned as the boundary condition). Warn the user when the time spacing of the consuming model is “significantly” larger than that of the producing model when there is a significant amount of mass lost in the transformation from the producing model to the consuming model. This needs to be done cell-by-cell.
When these tools are implemented and successfully run, the consuming module has met the constraints of meeting the system boundary conditions.
2.8
3.0 Spatial Boundary Conditions As noted in Section 2.0, many models with spatial boundary conditions perform their boundary-condition calculations at nodes, as opposed to the areas surrounding the nodes. Each node, though, represents a polygon that surrounds it. It is the polygon, and specifically the vertices of each polygon, that represents the basis for passing information between producing and consuming models. The nodes are represented by polygons, which, in turn, are described by their vertices portrayed within the model- and scenariogeoreferencing system (x, y, z coordinates).
3.1 Georeferencing Considerations The model DIC files contain information that allows for all spatially dependent boundary-condition data to be referenced to a georeference system (i.e., x, y, z coordinates). The location aspect of the data is associated with georeferenced points, lines, or polygons, as defined by their vertices. Tables 2.1 and 2.2 illustrate the georeferencing scheme using model DICs. Table 2.1 presents an example model DIC for boundary-condition polygon locations, and Table 2.2 presents an example model DIC for time-varying chemical groundwater concentrations by boundary-condition polygons. These georeferenced vertices allow for the mapping of the spatially distributed and dependent boundary-condition data from the producing-model boundary-condition polygons to consuming-model boundary-condition polygons This conversion is facilitated by an API through a DLL.
3.2 Mapping Upstream and Downstream Spatial Attributes Figure 3.1 presents an illustrative example of producing and consuming model boundary-condition nodes and associated polygon areas, whose corners represent polygon vertices. For an analytical model, a rectangular plane traditionally defines the interface area with the vertices being defined at the four corners of the rectangle. For a numerical model containing a gridding system, multiple nodes and/or areas will be defined at the boundary interface. The producing model will be responsible for transforming its output to meet the boundary-condition metadata requirements of the model DICs, as illustrated in Tables 2.1 and 2.2. If the producing model provides its output by node, it will have to convert its node-based output to correspond to an area (i.e., polygon) representing each node. Either the model can do the conversion, or the model can request help from the system, and the system provides software to help in this conversion. The system assumes that the boundary-condition information is 1) associated with each polygon area, representing each boundary-condition node, and 2) is uniformly distributed across each polygon. Figure 3.2 illustrates two areas associated with the boundary of a producing model (i.e., Polygons #1 and #2), overlapping with one area associated with the boundary of a consuming model (i.e., Polygon #1). When the producing model defines the output at a node, the producing model is responsible for transforming that nodal output into a form representing the area-based polygon. The consuming model has the responsibility to map the output results of each producing model’s polygons to the area-based polygons and corresponding nodal locations associated with the consuming model’s grid system. All interface mapping will be assumed to occur across a flat plane. If the gridding system boundary for one of the models is curvilinear, the producing model’s area, projected on to the consuming model’s surface, will be used in the mapping exercise. If a consuming model does not have a mapping routine that transfers the producing model’s polygon-based output (e.g., time-varying mass flux and polygon vertices, which describe the area) to the appropriate and 3.1
Figure 3.1. Illustrative Example of Producing- and Consuming-Model Boundary Condition Nodes and Associated Polygon Areas corresponding consuming model’s polygons, then the system provides software to assist the consuming model in the mapping exercise. The consuming model can use this mapping software through the API, or it can use its own mapping software. If system software is used, the API will compute polygons around each node, defining the polygons by their georeferenced vertices. The system assumes that the output at each node is associated with the area surrounding the node and that the output is uniformly distributed across the node’s assigned area. This assumption is applicable for both producing and consuming models. By using the system API, a consistent procedure exists to develop the areas (i.e., polygons) associated with each producing or consuming model’s nodes. There are a number of methods for generating polygons (i.e., multiple-connected planar domains) to describe irregular computational grids (e.g., Thiessen Polygon Method, Voronoi Diagrams). The polygon-mapping approach that is being considered for FRAMES would use Voronoi Diagrams (Inside Voronoi Applications; Geometry in Action; Voronoi Diagram, Voronoi Diagrams). Either module can invoke the API to help it develop polygons. The extent of the areal planes associated with the producing and consuming models do not have to be identical. In other words, the sizes of the overlapping consuming and producing model planes could be different, as illustrated in Figures 3.1
3.2
and 3.2. The system then calculates the fraction of each producing polygon that overlaps with a consuming polygon. When the producing and consuming model areas do not exactly overlap, the output, being transferred from the producing module to the consuming module, will be defined by the weighted-average associated with the overlapping areas (i.e., fraction of the producing model polygon overlapping with the consuming models polygon). In other words, the output assigned to the consuming module’s nodal area will be defined by the output of the producing module’s nodal areas, whose nodal areas overlap, weighted by areal extent. The polygons for both the producing and consuming models are assumed to be convex, that is, the angles between vertices will not contain any interior angles that are greater than 180 degrees.
Figure 3.2. Illustrative Example of API Procedure for Overlapping Producing and Consuming Model Grid System Boundary Interface Polygons
The transformation (i.e., mapping) of a producing model’s grid system onto a consuming model’s grid system area is illustrated in Figure 3.2. In this illustrative example, the producing model has two polygons associated with it while the consuming model (shaded area) has one. Approximately 20% of the producing 3.3
model’s Polygon #1 overlaps with the consuming model Polygon #1, and the 35% of the producing model’s Polygon #1 overlaps with the consuming model Polygon #2. In effect, the information passing from the producing model’s nodal areas to the consuming model’s nodal area will represent 20% and 35% of the output supplied by producing model’s Polygons #1 and #2, respectively.
3.4
4.0 Temporal Boundary Conditions Each model, especially numerical models, calculates time stepping and has a nodal-spacing mesh that is consistent with its own model while confirming numerical convergence and stability. Temporal considerations for linking models with disparate time-stepping requirements need to be independent of any model. To remove model-specific time stepping from dictating the manner in which models communicate, each of the model’s time-stepping requirements needs to be accounted for when passing information between models. Each producing model will provide time-varying output corresponding with each producing model’s areabased polygons that describe the boundary interface between models. The time-varying output from the producing model is a function of the time steps used in generating the time-varying curve. The system does not know if the time information between data-points on the mass flux rate curve is linear, constant, or nonlinear, etc.; as such, each producing model’s time-varying curves will have their own time-stepping protocol for each parameter for each polygon. When the consuming model maps the producing model’s polygon outputs and transfers the information from the producing model’s gridding system it its own, the consuming model is responsible to account for the time-stepping system that the producing models provides. For example, if the producing model provides uneven time intervals with its output, but the consuming model requires even-incremented time steps, then the consuming model is responsible for confirming the proper conversion. For those consuming models that do not have a protocol for mapping producing-model results into a form that they can recognize, the system API provides software that can help in this mapping process. If the consuming model uses the system mapping protocol, then it is assumed that the consuming model’s timevarying input, which corresponds to a nodal polygon, is defined by the producing model’s area-weighted output, whose polygons overlap with the consuming model’s polygon. By passing area-weighted information, the system can transform the data from the producing model’s gridding system into a format that is consistent with the consuming model’s gridding system. The mapping procedure, using the system API, is as follows: 1.
The system API determines the fraction of the projection of the producing model’s polygon areas onto each consuming model’s polygons. For example, Figure 3.2 illustrates the spatial mapping of two producing-model polygons onto a consuming-model polygon.
2.
The system API multiplies each time-varying curve by its respective fractions. Figure 4.1, correlated with Figure 3.2, provides an example that which maps time-varying output from the two producing model’s polygons onto a corresponding consuming model’s polygon.
3.
The system API confirms that the time-stepping protocol associated with each producing model’s time-varying curves are consistently mapped, confirming that each time step is accounted for, assuming linear interpolation, when necessary. If the system API needs to combine the output from two producing model polygons, and the time-step intervals associated with each output is different, the API will linearly interpolate to confirm that the time steps for both time-varying curves have values corresponding to, not only their own polygon time-steps, but also to the other polygon time steps.
4.1
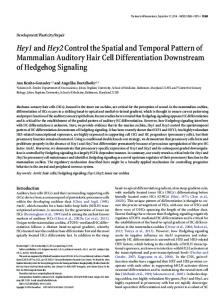
Figure 4.1. Illustrative Example Procedure for Calculating the Mass Flux Rate Curve for a Consuming Polygon from two Overlapping Producing Polygons
4.2
For example, if Polygon #1 provides output every 10 years, and Polygon #2 provides output every 5 years, then values will be assigned to Polygon #2, corresponding to every five years, using linearly interpolation. 4.
The system API summarizes the producing model’s area-weighed output to produce time-varying input for manipulation and consumption by the consuming model. For each point in time,
(Consuming Model’s Input)j = G [(fi) (Producing Model’s Output)i] from i = 1,n
(1)
fi = Ai/ATi
(2)
where
where
Fi Ai ATi i
= = = =
n
=
j
=
fraction of the producing model’s area that overlaps with the consuming model’s area i-th producing model’s area that overlaps with the consuming model’s area area in the i-th producing model’s polygon index on the i-th polygon in the producing model’s gridding system that overlaps with the area associated with the consuming model’s polygon total number of producing-model polygons whose areas overlap the area associated with each corresponding consuming-model polygon index on the j-th polygon in the consuming model’s gridding system.
Figures 3.2 and 4.1 illustrate how a producing model’s output for two polygons can be transformed to produce input to the consuming model’s polygon. Figure 4.1 illustrates the mechanics of implementing Equations (1) and (2), as they relate to Figure 3.2. Five curves are presented in Figure 4.1: 1) two timevarying mass flux rate curves for the producing model’s Polygons #1 and #2 (represented by solid squares and triangles, respectively), 2) two time-varying producing-model curves, adjusted for the fraction of overlap between the producing and consuming model polygons (e.g., 20% and 35%) (represented by open squares and triangles, respectively), and 3) the consuming model’s curve associated with its polygon (represented by open circles). Multiplying the areal fractions times the corresponding polygon output and summing the results produces the input curve (i.e., open-circle curve in Figure 4.1) for the consuming model. The consuming model can then manipulate and transform this input curve to meet its model-specific input requirements.
4.3
5.0 Dynamic Simulation (a) Dynamic simulation refers to the capability of the system to allow for temporal dynamic feedback between models. FRAMES-2.0 is a system that facilitates the connection of disparate models, databases, and other frameworks. In the past, FRAMES-2.0 has honored the legacy of existing models, which are typically delivered as executables. When linked to the system, these models execute fully and in the sequence specified by the user. In other words, the models will execute when started and will continue to run until completion. Data are read from input files, writing results to output files. But when a model is fully integrated with FRAMES-2.0, all reading and writing of data for the purpose of simulation go through an API that could be modified to allow models to work in a more tightly coupled regime. Currently, the user has a choice between Plug & Play with no dynamic feedback, or dynamic feedback where all of the models hare “hard-wired” together with Plug & Play features. Under the design of the system, the Plug & Play feature is combined with the temporal feedback feature. This could be done by allowing the upstream model to proceed with calculations until the temporal results are available and encompass a time step associated with the downstream model. The downstream model then begins calculations until its temporal results are available, and it encompasses the next time step of the downstream model. The procedure is repeated until all time steps for both models have been addressed. This approach is consistent with the design structure of the API and DIC (i.e., metadata) files. Implementing dynamic feedback within a framework setting, which allows for Plug & Play on the fly, inherently creates problems that require solutions. This section describes how the current FRAMES-2.0 works and outlines its limitations. It also discusses how a directed graph (i.e., dynamic feedback) capability could occur between models using FRAMES-2.0 and how different technical approaches could be used to solve the software issues.
5.1 Directed Acyclic Graph (Dag) Capability Currently, FRAMES-2.0 does not allow cycles in computation dependency, restricting the Conceptual Site Model (CSM) diagram in FRAMES-2.0 to a Directed Acyclic Graph (DAG) (i.e., diagram with no cycles). Figure 5.1 illustrates two possible relationships between “Model A” and “Model B,” which are acceptable in the current FRAMES-2.0 implementation. Although this “sequential modeling” adequately addresses most situations, there are a number of existing models (WASP, ISCLT, etc.) that are expected to provide data to and consume data from another model. There are two mechanisms used in FRAMES-2.0 that allow multiple executables to manipulate a single data structure. The first is the memory map file and semaphore; the second is the Java Remote Method Invocation (RMI). The single data structure is the information associated with Conversions, Dictionaries, Modules, Domains, and Simulations. All applications use a memory map file that allows any application to pass in arguments into the API functions and get return values. So, if a call is made, like pid=ModeDevOpen(“c:\program files\framesv2,” “MySim.sim,” “Mod1”), the three arguments of path,
(a) This particular section was supported by the U.S. Environmental Protection Agency, Office of Research and Development, National Exposure Research Laboratory, Ecosystems Research Division, Athens, Georgia, under contract No. EP-C-04-027, Work Assignment 2-2, through Battelle. 5.1
Figure 5.1. Current Possible Connections in FRAMES-2.0 simulation name, and module are passed into the API function via a memory map file. That is to say, the values are copied into the memory map file, and the core system is asked to execute an appropriate function in the core. This is a requirement of the operating system (i.e., Windows, Linux) to confirm that one application does not access data from another application. In Windows, this is known as a General Protection Fault; when one application attempts to read or write data, it does not have permission. The memory map file is the mechanism used to allow two applications to read and write shared data. During FRAMES-2.0 development, it was believed that the most stable use of the memory map file was to transfer arguments into and out of the API. To confirm that only one application is changing values in the API, a semaphore (an operating system flag) is used to allow only one executable at a time to read and write the memory map file. Even though a Java application uses RMI, it connects through the single memory map mechanism of the core system. So, while RMI could allow multiple readers and writers to a server, the connection through the memory map file in FRAMES-2.0 would need to be modified. Java’s RMI is a possible solution to the connection issues, but it would need to be implemented at a lower level than where it is currently. It would need to replace the memory map file currently in place.
5.2 Directed Graph (Dynamic Feedback) Capability Because a simulation is a DAG, the FRAMES-2.0 system knows that there is a start to computation, that is to say, there is some model that needs to be computed first. But with dynamic feedback, this situation is not as clear. A Directed Graph (DG) capability, also more loosely referred to as Dynamic Feedback, refers to the capability of two or more models to exchange information before an upstream model runs to completion. In effect, it allows for a closed loop when constructing the CSM. Mechanistically, it allows two applications to simultaneously read and write data to the API. Unlike Figure 2.1, where data flow is only in one direction, Figure 5.2 illustrates the more general case of allowing data flow to occur in both directions. Clearly, both “Model A” and “Model B” would depend on information from each other. This means that FRAMES-2.0 would now be capable of having a simulation that is a DG. To implement the simulation depicted in Figure 2.2, a different FRAMES-2.0 mechanism than the current memory map and semaphore is required.
5.2
Figure 5.2. Future Possible Connections in FRAMES-2.0 There is also a possibility of deadlock that needs to be addressed with the diagram (Dining Philosophers Problem). Deadlock lock refers to the simultaneous reading of data from each other. For example, if “Model A” and “Model B” both initially try to read data from the other, the system will deadlock no matter what the API will allow. This is a classic example of the “Dining Philosopher” problem, where few resources are grabbed in a sequence such that no individual task is allowed to progress. A reasonable solution to break the deadlock is to have the requirement that the models always write initial values before they read other’s input values. Assume for a moment that “Model A” writes variable X, and “Model B” writes variable Y. And X and Y will change over time so Xn represents the value at time n. Below is a sequence of interactions that will not deadlock and technically align with the behavior of existing models. Model A writes X0 Model B writes Y0 Model A reads Y0 and then computes and writes X1 Model B reads X0 and then computes and writes Y1 Model A reads Y1 and then computes and writes X2. Until both A and B terminate This example assumes that time steps are identical between these two models, but a similar type of procedure could be used to address the slightly more complex process where the time steps are uneven between models. Key to the solution is that the models need to write what they know before they calculate new results. In the example above, they write at time 0 before they compute at time 1. FRAMES-2.0 cannot currently support the simple sequence illustrated in Figure 2.2, but this is more because it has not been constructed to provide this capability rather than some fundamental weakness in the design. In either case (DAG or DG), the consuming model needs to wait for the data to exist before proceeding forward with its calculations. The change to allow the invocation of DG could be made at the API level, and the Simulation Editor would need to execute models in a different manner. Figure 5.3 illustrates a more complex simulation that contains multiple models that are then input to a system model (e.g., FRAMES Stochatic Iterator [StochIter]). As noted earlier, the current Execution Management
5.3
Figure 5.3. A More Complex Connection Diagram
runs the first model; then when the first model completes its execution, the system runs the next model in the DAG, and so on. Under the DG paradigm, there is no clear beginning or end. In Figure 5.3 for example, if you consider only models A, B, C, and D, there is no clear first or second model. To solve this dilemma, the Simulation editor would have to rely on the API to actually let models progress when data are available. In other words, the system reviews each component and decides which component can safely be run, as all data are available to progress forward. So, Models A through D could start “simultaneously,” and their data requirements would allow them to progress through time as long as their data needs are met. The models are not really running simultaneously, but, instead, the operating system would give each some slice of time to control the Central Processing Unit (CPU). To the user, it would appear that all the models run simultaneously. “System E,” however, would need to wait for A through D to complete their simulations before it can run. To execute the models in the DG, connections to system processors, like System E, would have to be handled differently. The feedback modification would require the additional behavior that system connections are not started simultaneously.
5.3 Software Solution to Dynamic Feedback This discussion is intended to convey the approaches that can be used to update FRAMES-2.0 to support dynamic feedback. Remember that this capability will be implemented behind the FRAMES-2.0 API. The module and system developers will not have to change development approaches to use the new capability. To test this statement, we implemented some small test applications to understand the operating system (OS) (i.e., MS-Windows, Linux) capabilities that the API could use to move data between two executables running simultaneously. Our investigation focused on the existing OS capabilities for supporting such a mechanism. Three primary approaches are discussed below: 1) multiple memory map files and semaphores, 2) named pipes, and 3) Remote Procedure Call (RPC). The criteria for deciding the most appropriate approach are that
5.4
the approach should 1) be lightweight (i.e., not hard to configure and maintain), 2) be as fast as possible, and 3) work with multiple languages.
5.3.1 Multiple Memory Map Files and Semaphores The current approach uses a single semaphore and memory map to communicate function arguments between the core and calling program. This approach could be extended to use multiple semaphores and memory maps to allow multiple applications to simultaneously manipulate the API. The drawback is that the core itself needs to know which memory maps are available and which executables they are associated with. While this will work, there is a belief that this approach will not be robust enough when an application terminates unexpectedly. The memory maps would be allocated when the calling executable starts up. The memory map would be released when the application stops, but if the application stops unexpectedly, the memory map might not be removed from the list of memory maps being used by the core, and the core itself would fail. Currently, the core allocates the single memory map, so no errors in the applications can cause issues with the memory map used by the core. Another technical issue is that the multiple-memory-maps approach would be much slower than the current application. This is known because during optimization of the core system, the primary approach was to reduce the number of times that values where copied into and out of the memory map. Reducing this number increased the speed of the API.
5.3.2 Named Pipes (Queues) A named pipe is a series of values that can be broadcast from one application to another through the OS. This can be thought of as a queue of values that are then read by the consumers. For example, imagine that the call pid=ModeDevOpen(“c:\program files\framesv2,” “MySim.sim,” “Mod1”) is made from a calling program to the core through a pipe to the core. This would be a read-only pipe from the core’s perspective and a write-only pipe from the calling application. The values of ModDevOpen “c:\program files\framesv2,” “MySim.Sim,” and “Mod1” would be sent to the core with an OS process identifier (pid) for the application. Assuming, for example, that the OS process identifier is 2403, when the core completes its operation, it sends 2403 and the FRAMES-2.0 pid through a pipe from the core to all applications. Each application monitors the pipe from the core to see if there is a result for that process. If there is a result, they read the data; otherwise, they move to the next message from the core. In Linux, the named pipes have to be a certain way, so it makes sense to confirm that the design addresses this constraint so less work is required if a Linux implementation of FRAMES-2.0 is needed. The downside of the named pipes is that significantly more processor time is used when simply having all programs reading from the single pipe from the core. Multiple pipes from the core are possible, but the sample stability issues associated with multiple memory maps would occur as with the current approach. If an application terminates in an abnormal way, the pipe may or may not be closed, and the core could become unstable.
5.3.3 Remote Procedure Call or Remote Method Invocation The RPC or RMI, as it is known in Java, is really a new name for what used to be called Common Object Request Broker Architecture (CORBA). This approach lets multiple applications on multiple computers access a function that is implemented on one machine in the system. While this approach was originally conceived to support multiple machines, it can also be used on a single machine. One of the many difficulties associated with CORBA and RPC is supporting different programming languages like VB, Java, 5.5
C++/C, and FORTRAN. This is where the existing FRAMES-2.0 API approach would be beneficial. Each individual programming language goes through a common programming language (i.e., C). The RPC concepts and associated code would be contained in the core, and each individual programming language is adapted to that architecture through the FRAMES API as it is now. Only one programming language needs to be capable of working with the RPC directly, but all will benefit. The RPC design tends to use something similar to named pipes. Strictly speaking, they are called sockets, but they are a first-in/first-out storage mechanism that can have multiple readers and writers. These sockets can actually use the network interface card on the computer to work with other machines, or they can be OS sockets between two processes. The important difference between the sockets and the named pipes is that the capability to deal with errors, when the connection is lost, is far more stable for sockets than named pipes. So an unexpected termination of a consumer or producer of data on a socket is more correctly handled by sockets than named pipes. RPC’s performance should be on the same level as multiple memory maps because the values passed from one application to another have to be copied multiple times. In addition, a good RPC implementation that uses OS sockets should perform on par with multiple memory maps.
5.4 Dynamic Feedback Summary The MS-Window’s RPC is the most straightforward to implement. This conclusion is based on the fact that RPC supports the functionally required in a robust manner. Another motivating factor in the decision is that the core is currently implemented in C/C++. Translating function calls from C/C++ to Java, back again to C/C++, and then to the programming language of choice seems more difficult than simply translating function calls from C/C++ to the programming language of choice.
5.6
6.0 References Dining Philosophers Problem (an illustrative example of a common computing problem in concurrency). Available at: http://en.wikipedia.org/wiki/Dining_philosophers_problem. Accessed 09-23-06. Geometry in Action. Available at: http://www.ics.uci.edu/~eppstein/gina/voronoi.html. Accessed 09-23-06. Inside Voronoi Applications. Available at: http://www.voronoi.com/applications.htm. Accessed 09-23-06. Javatm Remote Method Invocation (RMI). Available at: http://java.sun.com/j2se/1.4.2/docs/guide/rmi/index.html. Accessed 09-23-06. Remote Procedure Calls. Available at: http://www2.cs.uregina.ca/~hamilton/courses/430/notes/rpc.html. Accessed 09-23-06. Sippl CJ and RJ Sippl. 1980. Computer Dictionary and Handbook. Howard W. Sams & Co., Indianapolis, IN. Voronoi Diagrams. Available at: http://www.cs.sunysb.edu/~algorith/files/voronoi-diagrams.shtml. 09-23-06. Voronoi Diagram. Available at: http://mathworld.wolfram.com/VoronoiDiagram.html. Accessed 09-23-06.
6.1