(IJACSA)International Journal of Advanced Computer Science and Applications Vol. 9, No. 11, November 2018
Conceptual Modeling of Inventory Management Processes as a Thinging Machine Sabah Al-Fedaghi
Nourah Al-Huwais
Computer Engineering Department Kuwait University Kuwait
[email protected]
Information Technology Department Kuwait National Petroleum Company Kuwait
[email protected]
Abstract—A control model is typically classified into three forms: conceptual, mathematical and simulation (computer). This paper analyzes a conceptual modeling application with respect to an inventory management system. Today, most organizations utilize computer systems for inventory control that provide protection when interruptions or breakdowns occur within work processes. Modeling the inventory processes is an active area of research that utilizes many diagrammatic techniques, including data flow diagrams, Universal Modeling Language (UML) diagrams and Integration DEFinition (IDEF). We claim that current conceptual modeling frameworks lack uniform notions and have inability to appeal to designers and analysts. We propose modeling an inventory system as an abstract machine, called a Thinging Machine (TM), with five operations: creation, processing, receiving, releasing and transferring. The paper provides side-by-side contrasts of some existing examples of conceptual modeling methodologies that apply to TM. Additionally, TM is applied in a case study of an actual inventory system that uses IBM Maximo. The resulting conceptual depictions point to the viability of FM as a valuable tool for developing a high-level representation of inventory processes. Keywords— conceptual model, diagrammatic representation, inventory control, inventory management, workflow, thinging
I.
INTRODUCTION
In general, inventory is defined as items stocked in a store to meet anticipated requests. Inventory management or control is a system to balance product needs with demand to minimize costs that arise from obtaining and holding inventory [1]. There are several schools of thought that view inventory and its functions differently. This paper presents a foundation for inventory processes modeling that views an inventory as an abstract machine, called a Thinging Machine (TM), with five operations that may include infrastructure of submachines. We claim that such modeling, which is based on TM, facilitates understanding and serves as a base for consequent phases of an inventory system’s design and development. A model is understood as an abstract view of a portion of reality that enables developers to concentrate on relevant aspects of the system and discount needless complications [2].
Inventory management models are typically classified into three forms [3]: A conceptual model that contains text, pictures and diagrams to explain the terms and principles of a particular system’s functioning. An analytical (purely mathematical) model that uses mathematical concepts and language and contains formulas for analysis and calculations. A simulation (computer) model that attempts to simulate an abstract model of a particular system. The last two modeling techniques are concerned with minimizing the total cost of inventory based on a decisionmaking process considering the cost of holding the stock, placing an order or encountering a shortage (e.g., insufficient stock to meet demand). This paper is focused on conceptual modeling of inventory management systems. Conceptual modeling pertains to identifying, analyzing and describing the essential concepts and constraints of a domain with the help of (diagrammatic) modeling language that is based on a small set of basic meta-concepts [4]. It helps in understanding and communicating among the stakeholders and serves as a base for consequent phases of a system’s development [5]. It should reflect the reality of the organization and its operations; conceptual models are most valued in terms of completeness, faithfulness to the realization of the underlying real system, understandability and susceptibility analysis. A. Inventory management In an inventory management system, several basic notions are recognized, including minimum and maximum stock level, safety and reorder points and timing. The basic function of a management system requires preserving items’ quantities and maintains them in such a manner that they do not remain in stock for a long time, which would result in efforts waste (e.g., delays in production, work and maintenance). Inventory cost remains low when the correct quantities of products are ordered at the right price and time. Control is established by fixing the minimum and maximum levels of stock. These levels are calculated based on historical data, the expected requirements and in view of the inventory’s condition. Reaching the minimum level may result in stock running out; reordering occurs in such a way that items are received before the stock volume reaches the minimum level.
1|P age www.thesai.org
(IJACSA)International Journal of Advanced Computer Science and Applications Vol. 9, No. 11, November 2018
Minimum stock occurs when the stock falls below an established critical level at which the enterprise processes may be harmed. In such an event, a warning is sent to management to exert further efforts or extra resources to ensure that the situation is rectified. The maximum point is utilized to avoid any superfluous stocks that may result in halting the flow of items. Designated stock is maintained for safety considerations, especially for events such as a serious stoppage of operations or to maintain the reliability of supply. In most cases, it is equal to minimum stock. The reordering process ensures that items are not out of stock by taking into consideration current stock, lead time and receiving time before reaching a minimum level. Whatever the adopted inventory system, an organization needs a conceptual description that describes its real-world domain and does not include any information technology aspects. It would be able to serve various levels of granularity and complexity, such as by serving as a guide for the subsequent information systems specification, analysis, design and validation. B. Problem and Solution This paper claims that current conceptual models of inventory management systems lack comprehensiveness and completeness. Additionally, a lack of conceptual representation of processes makes it more difficult for end users to understand an existing process or simulate a new one. Accordingly, a highlevel conceptual language can contribute by filling some needs and acting as a foundation in this area of research. As a step in this direction, the paper applies the recently developed TM that is based on the thinging machine notion and presents a different conceptualization of such. This paper advances the inventory management processes in a holistic way by developing a framework that is sufficiently inclusive. Generally, TM provides a diagrammatic representation of the static, dynamic and control specifications at play in the inventory management processes. To show the viability of the proposed methodology, we use TM in an actual case study of an inventory management system that is currently being implemented using IBM software without an explicitly documented conceptual description. C. Appraoch Apparently, it is very difficult to contrast the involved diagrammatic models because they are based, to a large extent, on factors such as understandability (that pertains to visualization and graph completeness). A straightforward way to accomplish that is to put different diagrammatic depictions side-by-side and judge them accordingly. Therefore, we will give a few examples of current techniques so that, at the end, we are able to observe and contrast different samples.
In this section, several samples of inventory-related diagrams are presented. The purpose is not intended to give a fair discussion of these examples; rather, the aim is to provide an awareness of the type and nature of conception and depiction upon which this method is built. The samples will also provide the opportunity to contrast the diagramming techniques after presenting TM diagrams of our case study. Saraste [7] used the flowchart technique, which is “very flexible and easy to use” [7], as shown in Fig. 1. In the inventory control environment, the modeling used by Saraste [7] may not be suitable to model the system in a holistic way through developing a framework that is sufficiently inclusive. In certain situations, the entire enterprise processes may be harmed by local event (e.g., stock goes below an established critical level). Having knowledge of the entire view of the system—something that is missing in flowcharting—can help management employ efforts and/or resources to prevent an adverse effect on a production situation. Another flowchartbased representation is a sample of the Maximo diagram in an IBM Knowledge Center [8], as partially shown in Fig. 2. Flowcharts were the target of many criticisms regarding their value in design and education [9-10] that have nearly led to their elimination. Lately, they have also been revived in the form of a UML activity diagram. According to Storrle and Hausmann [11], “activity diagrams have always been poorly integrated, lacked expressiveness, and did not have an adequate semantics in UML.” According to Patel [12], Entity Relationship (ER) modeling allows for the formation of high-level conceptual data models that can be used to form a graphical representation for design, as seen in the initial ER diagram in Fig. 3. Check storage (deficiency recorded manually)
Order register onto system
Order?
Order process and acceptance
No
…
Picking into cart (ordered items)
Supplies received in storage
Fig. 1 Order modeling using a flowchart (partially redrawn from [7])
Supervisor approval
Start
Stop Manager approval
Min)
Receive
Receive Process: Insert request
Process: 8 If Current Stock = Min (full response to the request)
23 Process 1
22 Pending Quantity = Requested Quantity – Available Quantity 1
17 Release
19 If New Stock < Min (partial response to the request) 20 Available Quantity = Current Stock – Minimum
Transfer
Release
New Stock
Available
Pending
21 1 Inventory
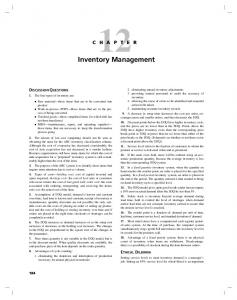
Fig. 12 General TM representation of the inventory control case study
5|P age www.thesai.org
(IJACSA)International Journal of Advanced Computer Science and Applications Vol. 9, No. 11, November 2018
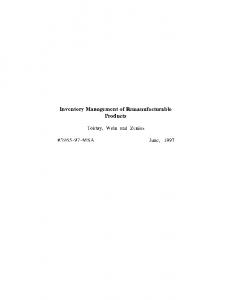
If the current stock of the request is above the minimum level: The request is processed (11) to extract (12) the requested quantity that flows to a decision machine (13), which also receives the current stock value (14). In the decision machine, the new stock is calculated as the current stock minus the requested quantity (15). The new stock is considered a global variable and is initially set to zero. Accordingly, (i) If the new stock is equal or above minimum (16), meaning that there are enough items to be delivered, then the decision machine triggers the release of the requested items (17) to be directly delivered to the requesting department and the replacement of the current stock by the new stock (18). (ii) If the new stock is less than the minimum (19), then a partial response to the request is possible: - The available quantity of items is calculated (20) as (the current stock minus the minimum) and released (21) to the requesting department (assuming it accepts that). - The pending quantity is calculated as the requested quantity minus the available quantity (22). The request is processed (23) to make it an inquiry for pending quantity and is sent to the queue system (24). If the current stock of the request is equal to, or less than, the minimum level: The request is sent to the queue system (26), where it is processed to increment the number of queued requests (27) and to add the request to the queue (28). B. Modeling events Fig. 11 in the previous sub-section reflects a static structure of distributing orders among the three cases. To model the dynamic behavior of the case when a request arrives and the current inventory is processed, we need the notion of a machine being-in-time. In being-in-time, the machine not only creates, processes, receives, releases and/or transfers, but it also machines (habitually does these operations again and again). Time in TM is a thing that can be created, processed, released, transferred and received. Consider the request has arrived and received in the commercial department, which can be represented as shown in Fig. 13. An event is a machine in a TM that contains at least three submachines: the time, the region and the event itself. The region is where the event takes place. The event in Fig. 13 includes the three machines: the region of the event (circle 1), which is a subdiagram of Fig. 12; the (real) time submachine (2); and the event submachine itself (3/green). It was previously stated in section two that the machine is constructed from the submachines of flows, including the machine itself. The machine itself is distinct from all of the submachines within. For simplicity’s sake, an event will be represented only by its region. Accordingly, we can identify the events in Fig. 14 as follows. Event 1 (E1): A request is received. Event 2 (E2): The inventory status is checked. Event 3 (E3): The current stock exceeds the minimum. Event 4 (E4): The request is sent to the decision procedure.
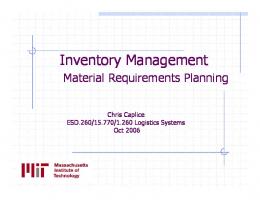
Event 5 (E5): The new stock is calculated. Event 6 (E6): The new stock is = or > than the minimum. Event 7 (E7): Items are sent to the requester. Event 8 (E8): The new stock is less than the minimum. Event 9 (E9): The available and pending quantities are calculated, and the request is modified and sent to the queue system. Event 10 (E10): The quantity (circle 25 in Fig. 12) is equal to or less than the minimum. Event 11 (E11): The request is added to the queue system. Fig. 15 shows the chronology of these events. It can be used in the execution and control (event operations) of events as exemplified in the figure. While a machine machines, control is an awareness of this machining that creates secondlevel machining. C. If new stock for the request is below minimum Fig. 16 models the machine in which the new calculated stock is less than the minimum (circle 19 in Fig. 12). In this case, as shown in Fig. 16, the quantity of items available is insufficient to be delivered to the requestor. Therefore, the request is partially satisfied by sending the available stock (the current stock minus the minimum) to the requestor (circles 1 and 2). Moreover, the updated current stock (3), which is now equal to the minimum, and the number of pending items (the requested quantity minus available quantity (4) are sent to the supervisor to decide upon making new supply order (5). The supervisor applies the company’s inventory policy (6), which is based on statistics that pertain to the ordering level, the minimum level and the maximum level. The maximum level is set according to the average of historical data to maintain the number of items typically on hand in recent years. These levels are determined by the commercial manager. The supervisor (7) decides whether to issue a request for quotation (RFQ) (8). Moreover, the supervisor assigns (8) an employee from the commercial department as the declared buyer (9 –bottom right of the figure) who is tasked with the responsibility of the transaction for this RFQ. The RFQ flows to the team leader (10) to be further processed. If the requesting supervisor does not have the authority for such a type of RFQ (11), then it is canceled (12) by the team leader and a cancellation note is created and sent to the supervisor. If the specification of the RFQ is incorrect (13), then it is rejected and a rejection note is sent (14) to the supervisor in order to modify the RFQ specifications. Once the RFQ is modified (15), it is sent back (16) to the team leader. 2 Transfer
Receive
Time Process
Release
Transfer Create
Transfer
1
Receive
Commercial Department Region
3
Process
Event
Fig. 13 The event: The request has arrived and received in the commercial department
6|P age www.thesai.org
(IJACSA)International Journal of Advanced Computer Science and Applications Vol. 9, No. 11, November 2018
Transfer
Approved Request
Receive
Requesting Department
Transfer
E1 Receive
Transfer Receive
E2
Process:
If Current Stock Min)
E11 E3
Inventory Status
Receive
Current Stock
Process
Transfer Number of Pending Requests
Queue
E12
Receive Process: Insert request Queue of Pending Requests
Decision
Transfer
Requested Quantity
Receive Process Release
Min
Transfer
E4
Transfer Receive Process:
E5 E6 E8 E10
Process
Transfer
New Stock = Current Stock – Requested Quantity
Transfer
Release
New Stock
If New Stock >= Min (full response to the request)
Release
If New Stock < Min (partial response to the request) Available
Available Quantity = Current Stock – Minimum Pending Quantity = Requested Quantity – Available Quantity
Inventory
Pending
E9
Fig. 14 Events of the FM representation of the inventory control case study
E1
If the specifications are still incorrect (17), then another rejection process is repeated (18). Otherwise, it is approved (19). If the RFQ is neither cancelled nor rejected (20), then it is approved (21) by the team leader. Approvals flow to the supervisor (22 - copy) and to the manager (23) for further processing. The same cycle of the team leader’s actions is repeated for the manager (24) and its description is omitted here. Assuming that the manager approves the RFQ, the approval is sent to the supervisor (25 – copy) and to the declared buyer (26) who was specified by the supervisor.
Receiving time (T1)
E3
E2 E10
E4 E5 E8 E6 E7
E9
E11
Delivery time (T2), If (T2 – T1) > week then report.
Fig. 15 The chronology of events of TM representation of the inventory control case
7|P age www.thesai.org
(IJACSA)International Journal of Advanced Computer Science and Applications Vol. 9, No. 11, November 2018
Requesting Department Commercial Department 1
Supervisor Decision
6 Policy
3
Pending
7 RFQ
10
Transfer
Transfer
Cancel Release
Process: 13 If specs incorrect
If emp. not auth.
18
Team Leader
21
17
Transfer
Modified RFQ
16
Transfer
Process:
Receive
15
If specs. incorrect Else
19 22
Transfer
Approval 1
23 Receive
Transfer
Receive
Transfer
Transfer
Cancel Release
Transfer
Release
Create
Create Release Transfer
Else
Reject Create Release Transfer
Create
24 Manager
Process
Transfer
Process:
Receive
If specs. incorrect Else
Modified RFQ
25
Transfer
Approval 2
Transfer
Transfer
Approval Create Release Transfer
26
Receive
Approval
Process: If specs incorrect
If emp. not auth.
Reject Transfer Receive
Receive
20 Else
Reject Create Release Transfer
Create
14
Process Release
11
Receive
Transfer
12
Reject Transfer Receive
Create
Case: New Stock < Minimum
Current Stock
4
Create Release Transfer
Receive
Inventory Section
Available
Create
Receive
2
Transfer
Release
5
Process: If ordering level or min level is reached or if pending items exist
8
Inventory
Receive
27 Process: Assign details to RFQ
LTSA ready version Transfer Release
29
Create
30
9
Create 28
Declared Buyer
Vendor Fig. 16 TM representation of the case if the new stock for the request is below the minimum
.
8|P age www.thesai.org
(IJACSA)International Journal of Advanced Computer Science and Applications Vol. 9, No. 11, November 2018
The declared buyer is responsible for assigning more details in the RFQ (27), which triggers the creation (28) of a long-term supply agreement (LTSA) (28). The LTSA does not need a bidding process because it is agreed upon with a specific vendor as a single source. It is called long-term because the contract with the vendor states that the price of the requested items shall be fixed for a specific number of years. The LTSA is sent to the supervisor (29 - copy), then the specified vendor (30). The vendor creates his own cycle of preparing and shipping the ordered items according to a specified time limit.
Note that the loop of events for every request in the queue is represented as a second order control over the events required for each request. The thick horizontal bar at the bottom of Fig. 17 indicates the possible parallelism of E5, E6 and E7. All of these events should end before starting another round of the loop. E1 For every pending request while current quantity =< minimum
E2
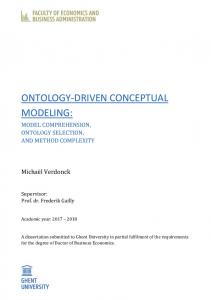
D. TM representation of receiving the ordered items from the vendor Fig. 17 shows the TM representation after receiving the ordered items from the vendor. Once the vendor (1) delivers the items (2), the current stock is updated (3). The pending requests (4) in the queue are released (5), one by one, to be processed to extract the requested quantity (6). Each request is processed to determine its quantity. Furthermore, the quantity is processed (7) to release the corresponding number of items in the queue (8). Additionally, the quantity flows to update the current stock (9) and the total pending items (10). Fig. 18 shows the events after receiving the requested items from the vendor. Fig. 19 displays the control over this sequence.
Total Pending Quantity
Number of Waiting Requests Process
E3 E1
E4 E5
. 1
Process
Process
Receive
Receive
Current Stock
Transfer
Transfer
3
Individual Pending Requests 6
5 Release
Process
Create
Vendor
Requesting Department
Transfer
2 Receive
9 Transfer
DB of pending requests
E7
Fig. 19 The events and their control after receiving the requested items from the vendor
10
4
E6
Inventory
Requested Quantity
Release
Transfer
8
Process
Process
Release
7
Create
Fig. 17 TM representation of receiving the requested items from the vendor
.
E6 Total Pending Quantity
Number of Waiting Requests Process
DB of pending requests
Release
Process
E1
E7 Process
Process
Receive
Receive
Transfer
Transfer
E3
E2
Vendor
Transfer
Individual Pending Requests
Release
Create
Create
Current Stock
E5
Inventory Transfer Release
Process
Process
Transfer
Receive
Requested Quantity
Requesting Department
E4
Fig. 18 The events after receiving the requested items from the vendor
. 9|P age www.thesai.org
(IJACSA)International Journal of Advanced Computer Science and Applications Vol. 9, No. 11, November 2018
V. CONCLUSION This paper demonstrates the viability of TM modeling for inventory management processes. The resultant conceptual model covers the static, dynamic and control of these processes. This feature of notions’ uniformity, based on the simplicity of the TM with its five stages, sets the modeling methodology apart from the heterogeneous diagrammatic representations (e.g., UML) that were displayed in section two of the paper. Further research will establish different potential benefits of the TM approach. REFERENCES Encyclopedia of Management, INVENTORY MANAGEMENT, Advameg, Inc., 2018. http://www.referenceforbusiness.com/management/Int-Loc/InventoryManagement.html [2] J. Mukerji and J. Miller, “MDA guide version 1.0.1.,” OMG, 2003. http://www.omg.org/docs/omg/03-06-01.pdf. [3] A. Muravjovs, “Inventory control system analysis using different simulation modelling paradigms,” Doctoral thesis, Transport and Telecommunication Institute, 2015. https://www.tsi.lv/sites/default/files/editor/science/PhD/Muravjovs/mura vjovs_promotion_full.pdf [4] G. Guizzardi, H. Herre, amd G. Wagner, “Towards ontological foundations for UML conceptual models,” in R. Meersman and Z. Tari (eds) On the Move to Meaningful Internet Systems 2002: CoopIS, DOA, and ODBASE. OTM 2002. Lecture Notes in Computer Science, vol 2519. Berlin, Heidelberg: Springer, 2002. [5] I. Hadar and P. Soffer, “Variations in conceptual modeling: Classification and ontological analysis,” in Journal of the Association for Information Systems, vol. 7, no. 8, August 2006, pp. 569-593. [6] “Knowledge based systems, Inc.,” http://www.idef.com/IDEF0.htm. IDEF Integrated DEFinition Methods. http://www.idef.com/pdf/idef0.pdf, 2010. [7] S. Saraste, “A framework for evaluating inventory management in healthcare case: HUS Logistics,” Master’s thesis, Department of Information and Service Economy, Aalto University, School of Business, 2013. [8] IBM Knowledge Center, “Example of a purchase requisition business process,” Maximo Asset Management 7.6.0. https://www.ibm.com/support/knowledgecenter/en/SSLKT6_7.6.0/com.i bm.mt.doc/gp_wkflow/c_sample_purchase.html [9] T. Brooks, “The mythical man-month: Essays of software engineering,” Reading, MA: Addison Wesley, 1975. [10] B. Shneiderman, R. Mayer, D. McKay, and P. Heller, “Experimental investigations of the utility of detailed flowcharts in programming.” Commun. ACM, vol. 20, no. 6, pp. 373-381, 1977. [11] H. Storrle and J. H. Hausmann, “Towards a formal semantics of UML 2.0 activities.” German software engineering conference, 2005. http://wwwcs.uni-paderborn.de/cs/ag-engels/Papers/2005/SE2005Stoerrle-Hausmann-ActivityDiagrams.pdf. [12] D. R. Patel, “Inventory control system for a small business proprietor, project, University of Leeds (School of Computing), 2006. https://www.google.com/url?sa=t&rct=j&q=&esrc=s&source=web&cd= 5&ved=0ahUKEwiV34-LyTZAhXOJSwKHY3nDfQQFgg8MAQ&url=https%3A%2F%2Fminerva .leeds.ac.uk%2Fbbcswebdav%2Forgs%2FSCH_Computing%2FFYProj %2Freports%2F0506%2FPatelDR.pdf&usg=AOvVaw07Q6nL2rvFvy2t c7ilLRmL [1]
[13] H. Quang and T. Pham, “Expressing a temporal entity-relationship model as a traditional entity-relationship model,” in M. Núñez, N. Nguyen, D. Camacho, and B. Trawiński (eds), “Computational collective intelligence. Lecture notes in computer science,” vol. 9330. Springer, Cham, 2015. [14] Y. Rinardwiatma and S. Kocharanchitt, “How IBM Maximo helped this Indonesian mining company save over $70 million on inventory in two years,” IBM InterConnect 2017 Conference, March 19 – 23, Las Vegas. [15] A. Kusiak, E. Szczerbicki, and R. Vujosevic, “Intelligent design synthesis: An object-oriented approach,” Int. J. Production Res., vol. 29, pp. 1291–1308, 1991. [16] Y. P. Khanal, “Object-oriented design methods for human centered engineering,” Ph.D. thesis, Ontario, Canada: University of Western Ontario, 2010. [17] A. Tchantchane, “Case study: Design and implementation of an ordering system using UML, formal specification and Java builder,” SETIT 2005, 3rd International Conference: Sciences of Electronic,Technologies of Information and Telecommunications, March 27 – 31, 2005, Tunisia. [18] Y. Mordecai, “Cyber-physical disruption modeling, analysis, and management: An evolutionary object-process model-based robust systems engineering approach,” Ph.D. thesis, Israel Institute of Technology, February 2016. [19] P. Shoval and J. Kabeli, “FOOM: Functional- and object-oriented analysis & design of information systems: An integrated methodology,” Journal of Database Management, vol. 12, no. 1, pp.15 – 25, 2001. [20] D. Dori, “Why significant UML change is unlikely. Communications of the ACM,” vol. 45, no. 11, pp.82 – 85, 2002. [21] S. Al-Fedaghi and M. BehBehani, “Thinging machine applied to information leakage,” Int. J. Adv. Comp. Sci. and Applics. (IJACSA), vol. 9, no. 9, pp. 101–110, 2018. [22] S. Al-Fedaghi and H. Almutairi, “Diagramming language for process documentation,” 15th Int. Conf. on Appl. Comp. (AC 2018), Budapest, Hungary, 21–23 October, 2018. [23] S. Al-Fedaghi and H. Aljenfawi, “A small company as a thinging machine,” 10th Int. Conf. on Info. Mgmt. and Eng. (ICIME), University of Salford, Manchester, England, September 22 – 24, 2018. [24] S. Al-Fedaghi and M. Alsharah, “Security processes as machines: a case study,” Eighth Int. Conf. on Innov. Comp. Technol. (INTECH), London, England, August 15–17, 2018. [25] S. Al-Fedaghi and R. Al-Azmi, “Control of waste water treatment as a flow machine: a case study,” The 24th IEEE Int. Conf. Autom. Comp. (ICAC), pp. 6-7, September 2018, Newcastle University, Newcastle upon Tyne, England. [26] S. Al-Fedaghi and N. Al-Huwais, “Toward modeling information in asset management: case study using Maximo,” 4th Int. Conf. on Info. Mgmt. (ICIM), Oxford, England, May 25–27, 2018. [27] M. Heidegger, “The thing,” in Poetry, language, thought, A. Hofstadter, Trans. New York: Harper & Row, 1975, pp. 161–184. [28] T. Ingold, “Bringing things to life: Creative entanglements in a world of materials,” Realities working papers #15: Bringing things to life, Department of Anthropology, University of Aberdeen, UK, July 2010. [29] IBM Maximo, Maximo Core Concepts [Online]. Available: https://www.slideshare.net/sunk818/ibm-maximo-keyconceptsv43 IBM, IBM Maximo Asset Management, Version 7 Release 6, Workflow Implementation Guide, IBM Corp., 2008, 2014. [30] IBM Maximo, “User’s guide,” Release 6.2.1, January 2007. [31] R. Potts, “Leveraging the ArcGIS platform to support Maximo spatial, SSP innovations, empowered solutions blog,” March 10, 2018. https://sspinnovations.com/blog/leveraging-arcgis-platform-supportmaximo-spatial/
10 | P a g e www.thesai.org