the transition region between the focus and context areas, as shown in Figure 1. .... map of each magnifier model (parameterization of each vertex of mesh model). ... arbitrary shape: (a) Point cloud generation with respect to the user defined ...
IEEE TRANSACTIONS ON VISUALIZATION AND COMPUTER GRAPHICS, VOL. 6, NO. 1, JANUARY 2007
1
Conformal Magnifier: A Focus+Context Technique with Local Shape Preservation Xin Zhao, Wei Zeng, Xianfeng Gu, Member, IEEE, Arie Kaufman Fellow, IEEE, Wei Xu and Klaus Mueller, Senior Member, IEEE Abstract—We present the conformal magnifier, a novel interactive focus+context visualization technique that magnifies a region of interest (ROI) using conformal mapping. Our framework supports the arbitrary shape design of magnifiers for the user to enlarge the ROI while globally deforming the context region without any cropping. By using the mathematically well-defined conformal mapping theory and algorithm, the ROI is magnified with local shape preservation (angle distortion minimization), while the transition area between the focus and context regions is deformed smoothly and continuously. After the selection of a specified magnifier shape, our system can automatically magnify the ROI in real time with full resolution even for large volumetric datasets. These properties are important for many visualization applications, especially for the computer aided detection and diagnosis (CAD). Our framework is suitable for diverse applications, including the map visualization, and volumetric visualization. Experimental results demonstrate the effectiveness, robustness and efficiency of our framework. Index Terms—Conformal mapping, focus+contex visualization, magnifier shape, smooth deformation, local shape preservation.
F
1
I NTRODUCTION
W
the tremendous increases in computing power, data storage, and internet bandwidth, we can now easily store, process, and deliver over the internet very large datasets, but an inherent limitation is the real estate available to display these data. While display devices may have grown in size and resolution, a natural limit is and remains to be the human’s visual field of view. At the same time, with the emergence of portable devices, such as netbooks and smart phones, there has also been a reverse trend in screen size for mobile applications. Therefore, no matter what display size is being used, a careful management of the display real estate is directly required. A natural solution to these requirements is focus+context (F+C) visualization. It allows the users to grasp the overall theme of the data to guide the sense-making process, while allowing them to access and address the appropriate detail of interest. Many F+C techniques have become available in recent years. As a general rule, a good F+C method must support continuity when transitioning from the magnified to the minified areas. Only then can the user perform effective visual searches at these multiple levels of scales. Such transitions are natural to humans because they match their biological visual system where peripheral vision has less detail than the retinal areas closer to the fovea centralis. Optical lenses have been available for centuries and humans have become very familiar with them. Computers can easily simulate lenses’ effects, while at the same time providing great opportunity to overcome limitations of lenses. Our paper addresses a specific limitation that optical lenses as well as their many digital counterparts have: their local ITH
• All authors are with the Computer Science Department, Stony Brook University, Stony Brook, NY, 11794, USA. E-mail: {xinzhao, zengwei, gu, ari, wxu, mueller}@cs.sunysb.edu.
distortion. Since humans have become accustomed to lens distortions over centuries, they have accepted them and even mentally compensated for their limitations. For example, the surgeon performing minimally invasive endoscopic procedures is aided by lens devices every day. He mentally unwarps the presented imagery without problems. However, when features become sufficiently intricate, and when motion parallax is missing as in static presentational views then lens distortions are intolerable. Therefore, a new lens with local shape preservation is required even for experienced doctors to support accurate detection and diagnosis. Although current lenses are “magic” in the sense what they can reveal, they are less so when it comes to overcoming serious distortion effects or artifacts. We address here the specific need to control local distortion, to preserve local detail undistorted and thus enable the user to reliably read and decode accurate information. Our lens uses the concept of conformal mapping as a novel F+C technique to capture the region of interest (ROI) into a single view while providing a smooth transition between the focus and context regions. Instead of only using lenses with regular circle or square shape, arbitrary shape models are embedded in our system to magnify ROIs with different shapes. Our system has a suite of 1D and 2D transfer functions allowing the enhancement and selection of areas and features of interest, and further interacts with 2D or 3D visual presentations of the dataset directly and displays the magnification results in real time. Consequently, our technique has a wide range of application areas, even on smart phones as well as web browsers. Distortion is also a key factor to improve the visual ability. The improper magnification distortion may cause cognition confusion. Any gain from integrating the detail with the surrounding context may easily be lost if the transition between the focus and context regions is difficult to understand. Our conformal magnifier minimizes global angle distortions and
IEEE TRANSACTIONS ON VISUALIZATION AND COMPUTER GRAPHICS, VOL. 6, NO. 1, JANUARY 2007
(a)
(b)
(c)
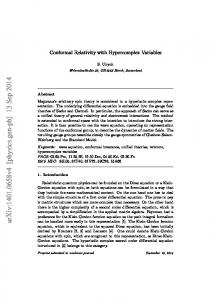
Fig. 1. Basic merits of our conformal mapping compared with the traditional lens for symbols located in the transition region between the focus and context regions. (a) A checker board image with a red X-like symbol. Magnification results using (b) the fisheye lens and (c) our conformal magnifier. preserves local angular relationships which, in turn, preserve important shapes and features of objects during the deformation. According to the research result presented by Hong et al. [18], the local angle of objects is an important structurebased factor/descriptor for the visual cognition. This property plays a crucial role during the magnification, especially in the transition region between the focus and context areas, as shown in Figure 1. After the magnification, the test symbol is hard to be identified and recognized visually by the traditional fisheye lens because of its local angle and area distortion in the transition area, while our conformal magnifier well-preserves the local orthogonal features of the symbol. Although the area of the symbol of interest is distorted during the magnification, with the local angle/shape preservation, the recognition of the focus object and its context is relatively straightforward to the user. We are specifically interested in this angle preserving method, especially for the computer aided detection (CAD), because the 3D geometric features are carried by the mapping with high fidelity. For example, Figure 7 illustrates a premarked polyp on a colon surface both in original 3D view and in display view of our system. It is obvious that the shape of the polyp is well-preserved after the magnification. During the diagnosis, radiologists identify colon polyps mainly based on shape information. Our method is advantageous over previous approaches, as the application of the conformal magnifier well-preserves the local shape feature, keeps the global structure, and builds a smooth transition field, leading to reliable zooming results. The main contributions of our paper are: • • •
Arbitrary shape models, used as magnifiers to satisfy different application needs; A conformal magnifier with local shape preservation and smooth transition; The general applicability of our framework for diverse graphics and visualization areas.
To the best of our knowledge, no previous work has used conformal mapping theory as an F+C technique for visualization. In this respect, our conformal magnifier, representing an ideal continuous multi-focus F+C technique that we have augmented with several unique features, is a novel non-linear magnification method. The well-defined conformal function is numerically well behaved: in theory, conformal mapping does
2
not have any local angle distortion. Namely, everywhere, there is neither angle nor shape distortion. In the discrete setting of triangular meshing structure, the approximation of conformal mapping globally minimizes the angle distortion. Therefore, conformal mapping is able to well preserve both local and global shapes with minimal distortion, robustly supporting the solution of several challenging cases. Our paper is structured as follows. First, in Section 2, we present the overview of related work. Then, in Section 3, we propose our framework and its theory, method and design in detail. Next, in Section 4, we describe the implementation details. Finally, we show the results for various cases, and demonstrate the merits of our framework in Section 5. Section 6 ends with conclusions and discusses the limitation and future work.
2
R ELATED W ORK
F+C visualization has been addressed in a great number of papers, including trees [27], [34], treemaps [12], [22], graphs [14], [26], tables [39], city and maps [7], nested networks [41], and 3D models [44], especially for medical data [10]. The commonly used F+C techniques are lenses and magnifiers, such as fisheye [13], nonlinear magnification transformation [23], detail-in-context [21], distortion [25], multi-scale [7] and others. Fisheye lenses offer an effective navigation and browsing device for various applications [33]. InterRing [46] and Sunburst [37] have applied multi-focus fisheye techniques as an important feature for radial space-filling hierarchical visualizations. The fisheye lens displays the data in a continuous manner, having an advantage in the spatial relation preservation. However, it creates noticeable distortions towards its edges and has no method to formally control the focus region as well as to preserve local features in the context region. Our method, taking the merit of the fisheye lens, continuously preserves the spatial relation, and does a better job in minimizing the distortion and formally controlling the focus region. Many sophisticated lenses and new distortion techniques have been proposed to enhance the F+C visualization. Spence et al. [35] have first simulated the display of the bifocal lens and applied it for various applications. Bier et al. [2] have presented a user interface that enhances the focal features of interest and compresses the less interesting regions using a Toolglass and Magic Lenses. Carpendale et al. [4] have proposed several view-dependent distortion patterns to visualize the internal ROI, and a framework for unifying presentation space to make effective use of the available display space [6]. LaMar et al. [24] have presented a magnification lens with a tessellated border region according to the radius of lenses and the texture information. Pietriga et al. [28] have provided a novel sigma lens using time and translucency to achieve more efficient transitions, and have also proposed an in-place magnification and representation-independent system that can be implemented with minimal effort in different graphics frameworks [29]. However, all the above methods either remove part of the context areas or seriously distort the transition region: each of them limits the spatial readability,
IEEE TRANSACTIONS ON VISUALIZATION AND COMPUTER GRAPHICS, VOL. 6, NO. 1, JANUARY 2007
visibility and continuity for most applications. The smooth transition design between the focus and context regions can preserve the visual continuity and stability, and then effectively increase the visual perception. Our magnifier, based on the strict mathematical solution of conformal mapping, generates a smooth and continuous transition area without losing any context information for the visual consistency. City and route F+C visualization is another popular application. For the virtual city, Qu et al. [30] have described an F+C route zoom and information overlay method for 3D urban environments. Trapp et al. [42] have proposed a 3D generalization lens for the interactive F+C visualization and applied it to virtual city models with different levels of structural abstraction. For the viewing of routes, Ziegler et al. [48] have presented an automated system for generating context-preserving route maps. It depicts navigation and orientation routes as a path between nodes and edges of a topographic network. Recently, Karnick et al. [20] have presented a novel multifocus technique to generate a printable version of a route map that shows the overview and detail views of the route within a single, consistent visual frame. These methods, however, may fail to preserve either the local features or the overall context of the surrounding map constituents, such as nearby cities, forests, and other useful information. Our method magnifies the target routes with local shape preservation while keeping all context information. For the F+C visualization of 3D data, deformation methods have been widely used. For volumetric data, Wang et al. [43] have proposed a free-form volumetric lens function to highlight, expose and non-linearly magnify the target. However, the serious context distortion and the deformed transition are major problems neglected by their method, which significantly lower the accurate understanding because of the loss of continuous viewing. For large surface models, Wang et al. [44] have presented an energy optimization model for magnifying ROIs while deforming the context area. Later, they further applied their model to the volumetric datasets to preserve features of interest in F+C visualizations [45]. However, the distortion mechanism of Wang’s system is highly arbitrary and determined by the location/distribution of features. By comparison, our conformal mapping, with a clear data-independent distortion, will always behave the same way, no matter what the density or structure of the data is. Moreover, as mentioned in both papers [44], [45], their mechanism fails to preserve the global scale. However, our conformal magnifier, applied for both volumetric datasets and surface mesh models, is specially designed to eliminate the local angle distortion and to preserve the visual continuity in a consistent and global way (e.g., a foot dataset in Figure 8). From the perspective of quality of magnification results, instead of using uniform grid cubes with the number of 203 or less proposed by Wang et al. [44], our method is voxel-oriented with full resolution (at least 643 ), performed in real time. In practice, partitioning the model with a finer grid space (especially for complex models) will lead to better results but significantly increase the computation cost [44]. Therefore, in terms of computing speed, our system is at least 10 times faster in rendering the F+C display of various large volumetric datasets (details in Section 4.2), thanks to the
3
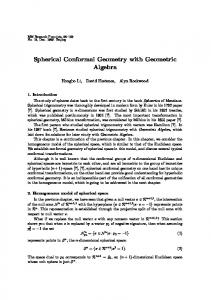
Fig. 2. A schematic diagram of our conformal magnifier pipeline using a simple 2D checker board image as input.
pre-computed intrinsic conformal parameters and the efficient mapping algorithm. In mathematical theory, different from various lenses that are based on the optical projection and reflection system [3], [47], the core idea of our method is the well-known conformal mapping theory, which is a mathematically rigorous method and one of the best solutions to obtain an optimal angle preservation. Our conformal magnifier well-preserves the local features and builds a smooth transition between the focus and context regions by solving the self-contained conformal mapping equations, leading to reliable magnification results. The conformal mapping theory also enables the user to design arbitrary shape magnifier models to effectively cover the entire ROI without panning the magnifier around or enlarging noninterest regions (e.g., a route view in Figure 12). Meanwhile, our system can be easily and directly extended for various applications, ranging from 2D multi-scale images to 3D timeseries datasets.
3
C ONFORMAL M AGNIFIER
Our conformal magnifier is built upon the conformal mapping theory. Figure 2 shows the pipeline of our framework. There are two pre-computation steps: magnifier mesh model design and conformal mapping. An arbitrary mesh model as the magnifier can either be automatically generated based on mathematical definitions or be manually drawn through the user interface. Then, our system pre-calculates the conformal map of each magnifier model (parameterization of each vertex of mesh model). For any input, including both 2D map and 3D volumetric datasets, with the user defined ROI and magnifier models, our system can automatically display magnification results in real time using texture mapping or volume rendering. In this section, we first introduce the magnifier mesh model
IEEE TRANSACTIONS ON VISUALIZATION AND COMPUTER GRAPHICS, VOL. 6, NO. 1, JANUARY 2007
design, and then briefly describe the theory and algorithm of conformal mapping. 3.1 Magnifier Model Design Basic interactive operations, such as setting and adjusting, can be used to generate an arbitrary model. However, the implementation of these operations is complicated and time consuming for complex models. Therefore, we propose an alternative method for the arbitrary magnifier model design with two steps: point cloud construction and mesh generation from point cloud, as shown in Figure 3.
(a)
4
the accuracy of the surface approximation, as shown in Figure 3b. The manifold extraction is also implemented to have a regular smooth surface using the ball pivoting method [1]. In practice, more points in high curvature features produce a better fitting surface. The computation speed of the mesh generation is mainly affected by the number of points, and the shape and topology of the point cloud (e.g., 24.77 sec for the same test point cloud with 20,152 points). With this design method, the user can interactively define various regular or specified magnifier models (Figure 4) to magnify the ROI. Different from traditional lens design methods, where each lens must have a specified optical model or an explicit function definition for the ROI magnification, our framework supports any shape or topology magnifier model without a simple explicit/implicit function definition or even without any mathematical description. Supported by conformal mapping theory, the truly arbitrary magnifier model design is the first major advantage of our framework.
(b)
Fig. 3. Two steps in designing a magnifier model with an arbitrary shape: (a) Point cloud generation with respect to the user defined (red) boundary and (purple) centerline. The cyan line is a quadratic curve for generating 3D interpolation points between a boundary sample point and its nearest centerline sample point. (b) Mesh model generation using the point cloud generated in (a). The black dashed boxes show the magnified details. Point Cloud Construction. The specified plane point cloud is constructed by the boundary curve and centerline drawn by the user to highlight the ROI, as shown in Figure 3a. The user can adjust the magnification ratio by adjusting the height of the centerline along z-direction position (in R3 with Pxy as a 2D plane). Then, the system automatically discretizes both boundary curve and centerline based on the sampling rate. For each boundary sample point, the L2-nearest centerline sample point is found to form a pair. For each pair, a pre-defined quadratic function (e.g., Gaussian function) is set with the current pair as start and end points, and then the interpolated positions of new cloud points are calculated and generated based on it, which results in a model (for the entire plane) with a continuous and smooth transition. The sampling rate can be interactively set by the user. In general, a high sampling rate generates a large number of points and fits the transition area smoothly, but takes long to compute (e.g., 14.36 sec for a test point cloud with 20,152 points). Mesh Generation from Point Cloud. We generate smooth surface meshes from the point cloud based on Delaunay refinement [31]. First, we find the constrained Delaunay triangulation of the input vertices. Next, we remove triangles from concavity and hole structures. We can further refine the mesh by inserting additional vertices if necessary. This algorithm generates a smooth mesh surface and guarantees
(a)
(b)
(c)
(d)
Fig. 4. Various specified mesh models. Regular shapes using (a) a hemisphere and (b) a Gaussian function. Arbitrary shapes using (c) a square plane with a smooth Gaussian transition, and (d) a random shape. The height of each model is non-linearly proportional to its magnification ratio. 3.2
Conformal Mapping Theory
After the model generation, the next step is the conformal parameterization for each magnifier model. In this section, we present the merits of conformal mapping and briefly introduce the basic theory background of conformal geometry, necessary for the discussion in this work. For more details, we refer readers to [11] for Riemann surface theory and [16] for differential geometry. 3.2.1
Merits of Conformal Mapping
In general, conformal mapping has its special properties, which are extremely valuable for real applications:
IEEE TRANSACTIONS ON VISUALIZATION AND COMPUTER GRAPHICS, VOL. 6, NO. 1, JANUARY 2007
Angle Preserving - Conformal mappings are anglepreserving. The most common examples of conformal mappings are univalent analytical functions in complex analysis. A more general definition is given in differential geometry [16]. Intuitively, suppose f : S1 → S2 is a mapping between two surfaces S1 , S2 , and γ1 , γ2 ⊂ S1 are two arbitrary intersecting curves on S1 , with the intersection point as p = γ1 ∩ γ2 . Then they are mapping to intersecting curves on S2 , f (p) = f (γ1 ) ∩ f (γ2 ). Suppose at the intersection point p, the intersection angle between two tangent vectors d γ1 , d γ2 is θ . f is conformal, if and only if the intersection angle between the tangent vectors d f (γ1 ) and d f (γ2 ) is also θ . A formal definition is as follows: f : (S1 , g1 ) → (S2 , g2 ) is conformal, where gk is the Riemannian metric on Sk , k = 1, 2, if and only if f ∗ g2 = e2λ g1 . where λ : S1 → R is a function, f ∗ g2 is the pull back metric induced by f on S1 . Namely, locally a conformal mapping is a scaling transformation, e2λ is the scaling factor, therefore it is shape preserving. Intrinsic - Conformal parameterization of a surface is solely determined by its Riemannian metric and does not require its embedding in R3 . For example, one can change a magnifier model by rotation, translation, folding and bending without stretching, the conformal parameterization is invariant. Stable and Practical - Computing conformal parameterization is equivalent to solving an elliptic geometric PDE [32], which is stable and insensitive to the noise and the resolution of the data. Therefore, a low-resolution magnifier (around 3K vertices) is good enough for most cases. It also effectively accelerates the computation of conformal mapping. 3.2.2 Conformal Structure Conformal structure and its properties are important mathematical foundations used to support our solid conformal mapping theory. Thus, in this section, we briefly introduce the necessary background knowledge of conformal geometry. Suppose S is a surface embedded in R3 , therefore S has the induced Euclidean metric g. Let Uα ⊂ S be an open set on S, with local parameterization ϕα : Uα → C, such that the metric has local representation g = e2λ (p) dzd z¯, p ∈ Uα where λ : Uα → R is called a conformal factor function, z ∈ C is parameter coordinates, d denotes the exterior derivative. Then (Uα , ϕα ) is called an isothermal coordinate chart. The whole surface can be covered by a collection of isothermal coordinate charts. All the isothermal coordinate charts form a conformal structure of the surface. The surface with a conformal structure is a Riemann surface [11]. Suppose S1 and S2 are two Riemannian surfaces. Suppose (Uα , ϕα ) is a local chart of S1 , (Vβ , ψβ ) is a local chart of S2 . ϕ : S1 → S2 is a conformal map if and only if f = ψβ ◦ ϕ ◦ ϕα−1 : ϕα (Uα ) → ψβ (Vβ ) is bi-holomorphic, i.e., it satisfies the Cauchy-Riemann equation ∂∂ zf¯ = 0. For simplicity, we still use ϕ to denote its local representation. Then a conformal map ϕ satisfies ∂∂ϕz¯ = 0.
5
3.2.3 Conformal Mapping by Surface Ricci Flow Let S be a surface embedded in R3 with the induced Euclidean metric g. We say that another Riemannian metric g¯ is conformal to g, if there is a scalar function u : S → R, such that g¯ = e2u g. The Gaussian curvature induced by g¯ is K¯ = e−2u (−∆g u + K), where ∆g = e−2λ ( ∂∂x2 + ∂∂y2 ) is the Laplacian-Beltrami operator under the original metric g, K the original Gaussian curvature under g, K¯ the induced Gaussian curvature under g¯ . The above equation is called the Yamabe equation. By solving the Yamabe equation, one can design a conformal metric e2u g by ¯ a prescribed target curvature K. Ricci flow can be used to solve Yamabe equation. It is a powerful tool which has been used for proving the Poincar´e conjecture. Ricci flow behaves like a heat diffusion process in the following form: 2
2
dgi j (t) = 2(K¯ − K(t))gi j (t) dt where t is the time parameter. If K¯ ≡ 0, Ricci flow deforms the Riemannian metric g to the uniformization metric g¯ by evolving the Gaussian curvature K, such that the Gaussian curvature becomes constant everywhere, according to the surface uniformization theorem in [11]. The convergency of Ricci flow to the uniformization metric has been proved in [8] and [17]. In this paper, we deal with quadrilateral surfaces with Euclidean background geometry, and map them to a planar rectangle parametric domain. Thus, we choose K¯ = 0 at interior points and K¯ = π /2 at four boundary corners in such cases. 3.2.4 Discrete Surface Ricci Flow Here we describe several major concepts for computing Ricci flow on discrete surfaces. In practice, most surfaces are approximated by simplicial complexes, namely triangular meshes. Suppose M is a triangle mesh, V, E, F are vertex, edge and face set, respectively. We use vi to denote the i-th vertex; [vi , v j ] the edge from vi to v j ; [vi , v j , vk ] the face, where the vertices are sorted counter-clock-wisely. Discrete Metric and Curvature. A discrete metric on a mesh M is a function l : E → R+ , such that on each face [vi , v j , vk ], the triangle inequality holds, l jk + lki > li j . If all faces of M are Euclidean, then the mesh is with Euclidean background geometry, denoted as E2 . The discrete metric represents a configuration of edge lengths and determines the corner angles on each face by cosine law,
θijk = cos−1
lki2 + li2j − l 2jk 2lki li j
,
where θijk is the angle at vi opposite to edge [v j , vk ] in the face. The discrete Gaussian curvature of vi is defined as an angle deficit at vi , considering all the corner angles surrounding a vertex vi , { 2π − ∑ jk θijk vi ̸∈ ∂ M Ki = . π − ∑ jk θijk vi ∈ ∂ M
IEEE TRANSACTIONS ON VISUALIZATION AND COMPUTER GRAPHICS, VOL. 6, NO. 1, JANUARY 2007
6
to each vertex circle. For all configurations with Euclidean metric, suppose the distance from the radial circle center to d ∂θ edge [vi , v j ] is di j , then ∂∂ uθij = liijj , furthermore, ∂ uij = ∂∂ uθij , ∂ θi ∂ ui
= − ∂∂ uθij − ∂∂ uθi . We define the edge weight wi j for edge k [vi , v j ] which is adjacent to triangles [vi , v j , vk ] and [v j , vi , vl ] as dikj + dil j wi j = . li j (a)
(b)
Fig. 5. Geometric interpretation of discrete conformal metric deformation. (a) Conformal circle packing metric deformation and (b) the radial circle (in red) of a triangle. Circle Packing Metric. The discrete Ricci flow can be carried out through the circle packing metric, which is a discretization of conformality and was introduced by Thurston [40]. Each vertex vi is associated with a circle with radius ri . Two circles at the end vertices of an edge [vi , v j ] intersect at an angle θi j , then the edge length li j is given by li2j = ri2 + r2j + 2ri r j cos θi j . A conformal deformation maps infinitesimal circles to infinitesimal circles and preserves the intersection angles among the infinitesimal circles. As shown in Figure 5a, the circle radius centered at each vertex deforms while not changing the intersection angles among circles θi′j = θi j , θik′ = θik . The circle packing metric can be defined as u = {ui }, where ui = log ri , ri is the circle radius of vi . The variation of the circle packing metric under Ricci flow generates the desired metric. Discrete Conformal Metric Deformation. We apply the discrete Ricci flow method to conformally map the surfaces onto planar domains ϕ : M → D. In all configurations, the discrete Ricci flow is defined as follows: dui (t) = K¯ i − Ki , (1) dt where K¯ i is the user prescribed target curvature and Ki is the curvature induced by the current metric. The discrete Ricci flow has exactly the same form as the smooth Ricci flow, which conformally deforms the discrete metric according to the Gaussian curvature. The discrete Ricci flow can be formulated in the variational setting, namely, it is a negative gradient flow of a special energy form, called Ricci energy, which is given by ∫ u n
f (u) =
∑ (K¯i − Ki )dui ,
(2)
u0 i=1
where u0 is an arbitrary initial metric. Computing the desired metric with user-defined curvature {K¯ i } is equivalent to minimizing the discrete Ricci energy. The Hessian matrix for discrete Ricci energy is positive definite for the Euclidean case (with normalization constraint ∑i ui = 0). Therefore, the energy is convex and can be optimized using Newton’s method. The Hessian matrix is computed on the circle packing metric [40]. As shown in Figure 5b, the radial circle of a triangle is unique and perpendicular
The Hessian matrix H = (hi j ) is given by the discrete Laplace form, [vi , v j ] ̸∈ E 0 −wi j i ̸= j hi j = . w i = j ∑k ik According to the Gauss-Bonnet theory [16], the total curvature must be 2π χ (M), where χ is the Euler characteristic number of M. In our application, M is a topological quadrilateral, so χ (M) = 1. We set the target curvature of the four boundary corners to be π /2, other boundary vertices and interior vertices to be 0. Then the toplogical quadralteral is mapped to a rectangle. The convergency of discrete Ricci flow has been proved by [9]. Detaials about discrete analogue for general Ricci flow can be found in [15] and [19]. 3.3 Conformal Mapping Algorithm The discrete Ricci energy can be optimized using Newton’s method to achieve the unique global optimal metric with the prescribed curvature. The implementation detail is listed in Algorithm 1. We design the magnifier model as a 2.5-dimensional mesh with coordinates (x, y, z) where the model can be projected to the 2D plane with coordinates (x, y), z describes the height from the plane. According to the conformal mapping theory, the local magnification ratio of the conformal magnifier is nonlinearly proportional to the height z at the corresponding vertex v = (x, y, z). Therefore, the global/local magnification ratio is controllable by adjusting the heights of all/some of vertices. The entire computational process for a magnifier model which is a topological quadrilateral is illustrated in Figure 6. The original magnifier mesh model is shown in Figure 6a, with four corner vertices noted as p1 , p2 , p3 , p4 . For solving Eqn. 3.2.3, we set the target curvature for each vertex in the triangle mesh (Figure 6b). The four corner vertices are assigned π /2, while other vertices are 0. In Figure 6c, the Ricci flow conformally maps the mesh model onto a planar rectangle, with the corner vertices mapped to the rectangle corners. Thus, we have the conformal map, with the corresponding 2D parameterization position of each vertex in the selected mesh model, used as coordinates for texture mapping or volume rendering. Giving rise to the conformally bijective mapping from checker-board texture to this model based conformal map in the parameter domain, the ROI is magnified with a smooth transition, as shown in Figure 6d. Computing conformal mapping by Ricci flow equals to solving a non-linear geometric PDE, which is stable and robust to the resolution of models. With an accelerated CPU/GPU solution, the conformal mapping of magnifier models is on
IEEE TRANSACTIONS ON VISUALIZATION AND COMPUTER GRAPHICS, VOL. 6, NO. 1, JANUARY 2007
Algorithm 1 Newton’s Method of Discrete Ricci Flow ¯ = {K¯ i }, Input: a 3D mesh M = (V, E, F), target curvature K curvature error threshold ε Output: corresponding 2D parameterization positions u of mesh vertices, used as coordinates for texture mapping or volume rendering 𝑝2 Initial the parameterization position u0 and curvature K = {Ki } 𝑝1 while max|Ki − K i | > ε do for all edges √ e = [vi , v j ] ∈ E do li j ← γi2 + γ 2j + 2γi γ j cos θi j {Compute the edge length by radii γi , γ j centered at vi , v j } end for for all corner angles θi ∈ [vi , v j , vk ] do
𝑝1
7
𝑝4
𝑝3
(a)
(b) 𝑝4
l 2 +l 2 −l 2
θi ← cos−1 i j 2likij lik jk {Compute the corner angle} end for for all edges e = [vi , v j ] ∈ E do d k +d l
wi j ← i jli j i j {Compute the edge weight} end for for all vertices vi ∈ V do hi j ← −wi j , [vi , v j ] ̸∈ E; hii ← ∑k wik {Compute the Hessian matrix H} end for ¯ {Minimize the discrete Ricci energy} du ← H−1 (K − K) for all vertices vi ∈ V do ui ← ui + dui {Update the circle packing metric for the calculation of each corresponding parameter position} end for for all vertices vi ∈ V do Ki ← 2π − ∑ jk θijk , vi ̸∈ ∂ V ; or Ki ← π − ∑ jk θijk , vi ∈ ∂ V {Update the Gaussian curvature} end for end while
second level for most cases (note that the conformal mapping for the designed modelscan is computed offline, separated from the F+C magnifying procedure in practice). The realtime performance of F+C conformal magnifiers depends on the efficiency of rendering or ray-tracing technique design, which could be easily satisfied on either desktops, netbooks or smart phones (details in Section 4.2). Case Studies. Based on conformal mapping theory and its algorithmic framework, our conformal magnifier offers mathematical guarantees to achieve a smooth and continuous F+C visualization with local shape preservation. We further demonstrate this merit using comparisons of different lenses with the volumetric colon dataset. As shown in Figure 7b, a major disadvantage of Carpendale’s method [4] is the seriously distorted boundary, which significantly decreases the accuracy of the object shape and affects the visual ability of the user. Figure 7c shows that, with the radial Gaussian function (fixed boundary), the surroundings of the focal region are seriously stretched due to the distortion being uniformly distributed on the dataset. In contrast, our method minimizes the angle
𝑝3
𝑝2
(c)
(d)
Fig. 6. Conformal mapping for a topological quadrilateral surface: (a) The original surface. (b) The corresponding triangular mesh magnifier model. (c) The image of the conformal map, which is a rectangle. (d) A checker board texture mapping through the rectangular conformal map, demonstrating that the local angles are correctly preserved.
distortion and preserves the shape of local features, as shown in Figure 7d: the fold and polyp of the colon remain similar to their original shape after the magnification. As an alternative F+C method, although our method is not distortion-free in the focus area, it has a solid mathematical foundation to preserve both local shape and global structure simultaneously and to produce a smooth transition area without any serious distortion. Both properties are important merits for the accurately visual cognition. Figure 8 shows another magnification comparison results using two prominent methods with the volumetric foot dataset. From the perspective of local shape preservation, as shown in Figure 8b, Carpendale’s method [4] seriously deforms the surrounding transition area (two toe bones near the ROI) without preserving the original shape features. By comparison with the original input dataset as shown in Figure 8a, the magnification results generated by Carpendale’s [4] method (Figure 8b) and our technique (Figure 8d), respect the global shape/structure of foot dataset without any obvious shape confusion for the accurate object recognition. However, as shown in Figure 8c, after setting the ROI (two foot toes), the magnification result generated by Wang’s method [44] well-preserves the local structure/shape in the focus area, but seriously affects the context region and introduces visual artifacts for the global structure, such as the extra extension of the left three toes and the overall foot width (the surrounding regions are enforced to expand because the cubes are connected [44]). Wang et al. [44] have also mentioned this problem as one of their major limitations.
IEEE TRANSACTIONS ON VISUALIZATION AND COMPUTER GRAPHICS, VOL. 6, NO. 1, JANUARY 2007
4
(a)
(b)
I MPLEMENTATION
We have implemented a general framework for the conformal mapping based F+C visualization. Our system is built using a two-tier architecture. The front-end user interface and interactive operations are based on a small number of menu bars, check boxes and pointer interactions using OpenGL and Glut libraries. There are two modes of the interface: (1) design mode for generating magnifier models, and (2) selection mode for setting ROIs and magnifier models. With the objective to optimize the computing speed, we use the combination of CPU and GPU. 4.1
(c)
(d)
Fig. 7. Magnification results using different lenses for the volumetric colon dataset. (a) Original colon dataset. Magnification results using the polyfocus lens (b) without and (c) with fixed boundary, following the Carpendale’s paper [4]. (d) The magnification result using our conformal magnifier with a Gaussian model: the local shape/features of the interior surface and the polyp are well-preserved with the smoothest transition region.
(a)
(b)
8
Pre-computation
For efficiency purposes, the core algorithms of our two precomputation steps: mesh generation and conformal mapping, are implemented on the CPU. The computation time of conformal parameterization is proportional to the number of vertices and is slightly affected by the topology shape of each magnifier model. Table 1 shows the model shape, vertex and face count, and pre-computation time of conformal parameterization for various magnifier models used in this paper on a Dell desktop precision PWS670 with Intel Xeon CPU 3.60GHz, 3GB Memory and Nvidia GeForce GTX 285 graphic card. Once a magnifier model is parameterized, there is no need to do any parameterization modification for different input datasets. This is the key to the real-time performance of our system. TABLE 1 Statistics of all magnifier models used in this paper. Model Sphere Square Elongated Model Low Gaussian High Gaussian Curved Model
4.2
No. of Vertices 3446 3125 3691 2192 4246 2639
No. of Faces 6826 6018 7063 4830 8926 5328
Time (s) 3.24 3.08 3.76 2.19 3.97 2.65
Real-time Performance
We implement the transfer function specification, texture mapping, and volume rendering using GPU acceleration.
(c)
(d)
Fig. 8. Magnification results using different lenses for the volumetric foot dataset. (a) Original foot surface mesh dataset with a predefined focal area (red circle). Magnification results using (b) the polyfocus lens following the Carpendale’s paper [4], and (c) the energy based distortion minimization method [44] (courtesy to Wang et al. [44]). (d) The magnification result using our conformal magnifier with a Gaussian model: both local and global shape/features are well preserved.
4.2.1 Texture Mapping For the 2D texture image, we directly call the texture mapping functions provided by the OpenGL library. Each input image is processed as an 8bit per-channel texture and directly mapped to the selected magnifier model according to the pre-calculated conformal parameters. Two interpolation strategies are provided for different input datasets: bilinear interpolation for single image and blending interpolation for multi-scale images. The bilinear interpolation is fast and easy-to-implement but without any new detail shown. For the multi-scale images, unlike traditional piecewise blending methods in the image domain, supported by the conformal mapping theory, our system directly provides a continuous blending function in the parameter space. Figures 9b and 9c show the continuous
IEEE TRANSACTIONS ON VISUALIZATION AND COMPUTER GRAPHICS, VOL. 6, NO. 1, JANUARY 2007
(a)
(b)
(c)
Fig. 9. Implementation of multi-scale magnification using our conformal magnifier with a hemisphere model. (a) Multi-scale satellite images of the United States. The ROI contains more details/pixels as the scale decreases (the magnification ratio increases). (b) The top view and (c) the side view of the continuous magnification ratios of our conformal magnifier calculated by conformal mapping. The colorbar shows the scale of the magnification ratio: from large (red) to small (purple).
9
shown in Figure 10. Fixing a view point, the surface of the 3D hemisphere magnifier model forms a continuous view with the following fact: the closer to the view point, the smaller the view distance will be and the larger the object of interest will be. We adapt the fragment program for volume rendering proposed by Stegmaier et al. [38], considering the model shape and several factors including depth, view angle, and camera position. The steps include, cast the ray into the volume and composite the color based on transfer functions, and render the result to the framebuffer as output. The pixel color and alpha are adjustable by transfer functions. This new rendering method results in a nonlinear magnification of 3D views in real-time with less performance degradation. Notice that our method directly works in 3D, which is more realistic and interactive than the direct deformation on the 2D rendered image. In addition, our method is a different approach from some optical 3D lenses (e.g., [43]), as their lenses affect everything in front of the user, but our method could control the shape of distortion region by using different magnifier models.
(a) magnification ratios (the continuous parameter distribution) of the hemisphere magnifier model using a color map. They also reveal two properties of conformal mapping: the model height is non-linearly proportional to the magnification ratio; and the smooth transition of the magnification ratios results from the numerical continuity in the parameter space, which theoretically supports the texture mapping of continuous-scale images. Therefore, the conformally bijective texture mapping between the parameterization value and the image pixel (for both single image and multi-scale images) is syntactically and semantically trivial with respect to the user’s pre-defined mapping criteria (e.g., fix the four corner points in Figure 6). In order to accelerate the search efficiency, we build tree structures for multi-scale images with the help of pre-marked feature points. Take Figure 9a as an example, the root of a tree structure is a pixel at the largest scale (100km×100km). Its direct children are right from the next small scale (10km×10km), and leaves are at the smallest scale (1km×1km). The smaller scales and leaves contain more details to reveal the local information. We use breadth-first search (BFS) method as a query. In addition, for the optimal speed and space, we can only search and store tree structures in the ROI. 4.2.2 Volume Rendering In order to extend the conformal magnifier as a 3D exploration tool, different from the camera texture [36], which locally changes the 2D perspective plane of camera space, we directly replace the 2D camera plane with our 3D magnifier model, as
(b)
Fig. 10. The new raycasting scheme: each ray is calculated based on (b) the designed magnifier plane (green curve marked as P’) instead of (a) the traditional 2D plane. The texture mapping or volume rendering needs to be recomputed whenever the focus or the magnifier model changes, but with real-time performance. Table 2 shows the texture mapping or volume rendering time for all experimental cases used in this paper on the same desktop mentioned above. The implementation time listed in Table 2 demonstrates that our design strategy is good enough for our purposes: interactive operation of the ROI selection, magnifier model design, and the real-time display. TABLE 2 Time statistics of texture mapping or volume rendering for all the datasets used in this paper. (f/s: frames/second) Catalog Information Route+city Route+city Route+city Surface Medical Medical Volume
Name Symbol SF city Expressway NYC Foot Colon polyps Skull Smoke
Size 5122 800 × 750 1080 × 680 10242 vertex:21.3K 5122 × 96 2563 643
Model Hemisphere Gaussian Elongated Gaussian Gaussian Gaussian Gaussian Hemisphere
Time (ms) 2.6 3.0 3.8 4.8 8.2 16.3 14.7 55 f/s
IEEE TRANSACTIONS ON VISUALIZATION AND COMPUTER GRAPHICS, VOL. 6, NO. 1, JANUARY 2007
5
E XPERIMENTAL R ESULTS
In this section, we apply our conformal magnifier to various applications and demonstrate the merits of our framework. Because of page limitation, only part of the results are illustrated here, more results are available in the additional electronic materials. 5.1 Route and Map Visualization Recently, smartphones and notebooks attract increasing attentions, however, the limited input modalities make it difficult to support both clear focus and context regions of large datasets without any extra operation. Our framework improves the magnification function for routes and maps. Our conformal magnifier, as an effective route/map deformation method, overcomes two major shortcomings of Google map: (1) after magnification, the visual consistency is seriously disturbed due to loss of the transition or the context region; and (2) a long trip always requires multiple panning and zooming operations. Figure 11 shows a magnification result of multiscale maps using our conformal magnifier. With continuous magnification ratios, the result shows multi-level details with a smooth transition between the focus and context regions.
(a)
(b)
Fig. 11. Multi-scale map magnification results using our conformal magnifier. (a) Original map shows the surrounding region of the city of San Francisco. (b) 2 times magnification result shows additional details of the city. The blue line is used to align the multi-scale maps. The result also nicely shows that the shape of the blue area is well preserved in the smooth magnification transition area. Another advantage of our method is to enable the user to directly design arbitrary magnifier models based on the shape of ROI on the route map. This design has effective merits for the route view: cover the entire ROI without the need of moving the magnifier around, and only cover the ROI without any non-interest region. For example, an elongated magnifier model in Figure 12b covers the entire route of interest (highlighted by a blue dashed circle), while a regular hemisphere magnifier model in Figure 12a only covers a small part of it. We define a parameter Λ to describe the ROI AreaROI , where ROM is the magnification efficiency as: Λ = Area ROM region of magnification. As shown in Figures 12a (ROM is highlighted by a blue dashed circle) and 12b, although both magnification results have the high magnification efficiency
10
(Λ ≈ 1.0), Figure 12a fails to reveal the entire ROI. If we increase the radius of the hemisphere magnifier model in Figure 12a (a new ROM is highlighted by a green dashed circle) to cover the entire ROI, many non-interest regions will be magnified as well, sharply decreasing the magnification efficiency factor Λ down to 0.63. Our system successfully provides a good magnification scheme for the route view as it presents general route trends and specific spots simultaneously.
(a)
(b)
Fig. 12. Efficient route view using our conformal magnifier. Instead of using (a) hemisphere models with a small (blue dashed circle) and a large radius (green dashed circle), (b) an elongated model can magnify the entire route of interest without taking any extra movement or magnifying any non-interest area. It also has no widening artifacts of the routes of interest. In order to further demonstrate the merit of our conformal magnifier for the route and city visualization, popular lenses, including bifocal [35] and fisheye lenses [43], have been implemented as comparison. Figure 13 shows the route/map magnification results using different lenses. By comparison, our conformal magnifier enlarges the small landmark/roads along the route of interest for a detail view with the best local shape preservation, and keeps the entire context region through a smoothest transition. 5.2
Volumetric Data Visualization
Our conformal magnifier can be easily applied to various volumetric datasets for real-time navigation. Medical Datasets. We test our framework using several volumetric medical datasets to demonstrate the advantages of our conformal magnifier: the local shape preservation and smooth transition between the focus and context regions, providing important meanings in clinic education, diagnosis and virtual surgery. The conformal mapping can be successfully used for the CAD of colon polyps. With its property of shape preservation (angle distortion minimization), doctors can achieve accurate diagnosis since the spherical shape of polyps is a critical feature to distinguish cancer from artifacts. By comparison with traditional lenses, as shown in Figure 7, both global and local shapes of colon with polyps are wellpreserved and easily perceived using our conformal magnifier. Figure 14 shows another medical example. Using our conformal magnifier, although part of the skull area is compressed,
IEEE TRANSACTIONS ON VISUALIZATION AND COMPUTER GRAPHICS, VOL. 6, NO. 1, JANUARY 2007
11
(a)
(b)
(a)
(b)
(c)
(d)
(c)
(d)
Fig. 13. Magnification results using different lenses for the NYC street map. (a) Original NYC map. Magnification results using (b) the bifocal lens, (c) the fisheye lens, and (d) our conformal magnifier. The red circles highlight the seriously distorted areas. each specified local feature of the skull and spine is wellpreserved in both transition and context regions after the magnification. By comparison, our conformal magnifier has the best magnification result in terms of both shape preservation and smooth transition. These properties are crucial for doctors to learn, detect and diagnose disease symptoms. High-level Magnification. Our framework can be easily extended to the high-level magnification. The user can interactively re-select ROI and keep on zooming in on the latest magnified result or directly reset the magnification ratio of the magnifier model. Unlike the discrete zooming factors [5], in theory, our magnifier has continuous magnification ratios to obtain a smooth transition between the focus and context regions during the magnification. In practice, there are no theory or implementation limitations for the design of high-level conformal magnifier. Figure 15 shows that our conformal magnifier still preserves the local shape details in the ROI (the interior sphere of the smoke dataset) and enables a smooth transition after the high-level magnification. However, because of the limitation of the screen real estate, our method may fail to preserve the area of object, which leads to inaccurate measurement. Fortunately, the distorted area and volume information can be reconstructed by referring back to the original volumetric data using the pre-computed bijective conformal parameters. 5.3 Distortion Measurement In order to quantitatively measure the angle distortions of various lenses, we use the distortion of conformality, which is
Fig. 14. Magnification results using different lenses for the volumetric skull dataset. (a) Original human skull dataset. The spine is the ROI. Magnification results using (b) the perspective-wall lens, (c) the Carpendale’s polyfocus lens with fixed boundary [4], and (d) our conformal magnifier. The background mesh shows the distortion, and the red circles highlight the transition area between the focus and context regions for each method.
(a)
(b)
(c)
Fig. 15. High-level conformal magnification results for the volumetric smoke dataset. (a) Original smoke dataset. (b) 9 times and (c) 16 times magnification results. computed as: the ratio of the larger to the smaller eigenvalue of the Jacobian matrix generated using the parameterization value with respect to lens definition functions or magnifier models (details in [11], [16]). The ideal conformality is 1.0, which is the most conformal. But due to the numerical problem, it cannot be exactly 1.0. The region with a lower distortion value means that it is more similar to its original shape, while the region with a higher distortion value is naturally stretched. We use histograms to show the distribution of the distortion of conformality for different lenses. As shown in
IEEE TRANSACTIONS ON VISUALIZATION AND COMPUTER GRAPHICS, VOL. 6, NO. 1, JANUARY 2007
Figures 16c and 16d, the mapping of our conformal magnifier is close to conformal everywhere: the maximal errors of our two pre-defined magnifier models are less than 4% and 2%, respectively. By comparison with the fisheye lens (Figure 16a) and the Carpendale’s polyfocus lens [4] (Figure 16b), our method is statistically significant for the angle preservation (local shape preservation).
(a)
(b)
(c)
(d)
Fig. 16. Histograms show the distribution of the quasiconformal distortion using (a) the fisheye lens, (b) the polyfocus lens following [4], and our conformal magnifiers with (c) a hemisphere model and (d) a Gaussian model.
6
C ONCLUSIONS
In this paper, we have presented a simple but powerful conformal magnifier, a conformal mapping based non-linear spatial distortion magnifier, as an F+C visualization technique to overcome the limitation of the screen real estate. Our framework focuses on the angle distortion minimization and visual continuity, producing optimally visual results: magnify the ROI with minimal local angle distortion and contain a continuous transition region where the user can get a smooth view from the highly magnified inside to the nonmagnified outside. The properties of local shape preservation and smooth transition have significant applications in many areas, for example, the computer aided detection and diagnosis of diseases, which is always based on the local shape/features and the context information around the focal region. Our system also supports the magnifier model design of arbitrary shapes, enabling an extremely flexible and natural style of direct manipulations for data analysis. In addition, different from traditional lenses designed in the spatial domain, our conformal magnifier is defined in the parameter domain: the conformal parameterization is first calculated and stored, and then apply texture mapping or volume rendering based on the pre-computed parameters. Therefore, our system can be easily
12
embedded into various graphics or visualization frameworks, including the route, map, surface model and 3D volumetric data. With the support of experimental results and comparisons within various task scenarios, we have demonstrated that our conformal magnifier, as a novel F+C technique, has great potentials for the volume graphics and visualization applications. Limitations and Future Work. Our method can wellpreserve local angles and achieve a smooth transition with minimal visual distortions. However, visual distortions are not only due to the deviation of angles. The size variation of neighboring regions may also introduce distortions. Fortunately, according to the theory of human central vision, we are sensitive to sharp transitions of intensity or color, which are usually detected as local features and are wellpreserved by our framework. Meanwhile, using a smooth mesh model as the conformal magnifier, the magnification ratio varies continuously. Therefore, the size variation of neighboring regions is smoothly changing without any obvious difference. With the fact that only a small area in the center of the retina contains a rich collection of cone cells, the user usually concentrates on the well-preserved local shape/feature of interest and disregards the area distortion of surrounding contexts. This means that the distortion caused by the size variation of neighboring regions is not disturbing to the user using our conformal magnifier. In addition, because our system achieves real time performance, the user can quickly move the conformal magnifier in the neighboring areas of interest to reach the accurate perception of features. Another limitation of our framework is how to generate smooth and grid-unified mesh models, which is a key factor to produce F+C visualizations with minimal distortion and smooth transition. Therefore, some specified filters or blending algorithms are required to further smooth the transition region of magnifier models to obtain high quality results. Also, the computational speed of conformal mapping, although not slow, still needs to be improved for interactive magnification operations. We plan to further accelerate the calculation of conformal mapping and to incorporate new rendering methods for the high performance and resolution using GPU.
ACKNOWLEDGMENTS This work has been partially supported by NSF grants EAGER-1050477, CCF-0702699 and IIS-0916235. The authors would also like to thank the Stony Brook Hospital for the medical datasets and professional evaluation.
R EFERENCES [1] [2] [3] [4]
F. Bernardini, J. Mittleman, H. Rushmeier, C. Silva, and G. Taubin. The ball-pivoting algorithm for surface reconstruction. IEEE Transactions on Visualization and Computer Graphics, 5:349–359, 1999. E. A. Bier, M. C. Stone, K. Pier, W. Buxton, and T. D. Derose. Toolglass and magic lenses: The see-through interface. Computer Graphics, pages 73–80, 1993. J. Brosz, F. F. Samavati, M. T. C. Sheelagh, and M. C. Sousa. Single camera flexible projection. International Symp on Non-photorealistic Animation and Rendering. ACM, pages 33–42, 2007. M. S. T. Carpendale, D. J. Cowperthwaite, and F. D. Fracchia. Extending distortion viewing from 2D to 3D. IEEE Comput. Graph. Appl., 17(4):42–51, 1997.
IEEE TRANSACTIONS ON VISUALIZATION AND COMPUTER GRAPHICS, VOL. 6, NO. 1, JANUARY 2007
[5]
[6]
[7]
[8] [9] [10]
[11] [12]
[13]
[14]
[15]
[16] [17] [18]
[19]
[20]
[21] [22] [23] [24]
[25]
[26] [27]
[28]
[29]
[30]
[31]
[32] [33]
M. S. T. Carpendale, J. Ligh, and E. Pattison. Achieving higher magnification in context. ACM Symp. on User Interface Software and Technology, pages 71–80, 2004. M. S. T. Carpendale and C. Montagnese. A framework for unifying presentation space. ACM Symp. on User Interface Software and Technology, pages 61–70, 2001. M. S. T. Carpendale, M. Sheelagh, T. Carpendale, D. J. Cowperthwaite, and F. D. Fracchia. Multi-scale viewing. SIGGRAPH, pages 149–152, 1996. B. Chow. The Ricci flow on the 2-sphere. Journal of Differential Geometry, 33(2):325–334, 1991. B. Chow and F. Luo. Combinatorial ricci flows on surfaces. Journal Differential Geometry, 63(1):97–129, 2003. M. Cohen, K. Brodlie, and N. Phillips. The volume in focus: Hardware assisted focus and context effects for volume visualization. ACM Symposium on Applied Computing, pages 1235–1239, 2008. H. M. Farkas and I. Kra. Riemann Surfaces. Springer, 2004. J. D. Fekete and C. Plaisant. Interactive information visualization of a million items. IEEE Symposium on Information Visualization, pages 117–124, 2002. A. Formella and J. Keller. Generalized fisheye views of graphs. Proceedings Graph Drawing, Lecture Notes in Computer Science, LNCS 1027, pages 242–253, 1995. E. Gansner, Y. Koren, and S. North. Topological fisheye views for visualizing large graphs. IEEE Symposium on Information Visualization, pages 175–182, 2004. D. X. Gu, W. Zeng, F. Luo, and S.-T. Yau. Numerical computation of surface conformal mappings. Computational Methods and Functional Theory (CMFT), 11(2):747–787, 2011. H. W. Guggenheimer. Differential Geometry. Dover Publications, 1977. R. S. Hamilton. Three manifolds with positive Ricci curvature. Journal of Differential Geometry, 17:255–306, 1982. W. Hong, F. Qiu, and A. Kaufman. A pipeline for computer aided polyp detection. IEEE Transactions on Visualization and Computer Graphics, 12(5):861–868, 2006. M. Jin, J. Kim, F. Luo, and X. Gu. Discrete surface ricci flow. IEEE Transactions on Visualization and Computer Graphics, 14(5):1030– 1043, 2008. P. Karnick, D. Cline, S. Jeschke, A. Razdan, and P. Wonka. Route visualization using detail lenses. IEEE Transactions on Visualization and Computer Graphics, 16(2):235–247, 2010. T. A. Keahey. The generalized detail-in-context problem. IEEE Symposium on Information Visualization, pages 44–51, 1998. T. A. Keahey. Getting along: Composition of visualization paradigms. IEEE Symposium on Information Visualization, pages 37–40, 2001. T. A. Keahey and E. L. Robertson. Nonlinear magnification fields. IEEE Symposium on Information Visualization, pages 51–58, 1997. E. LaMar, B. Hamann, and K. I. Joy. A magnification lens for interactive volume visualization. Pacific Conference on Computer Graphics and Applications, pages 223–232, 2001. Y. K. Leung and M. D. Apperley. A review and taxonomy of distortionoriented presentation techniques. ACM Transactions on ComputerHuman Interaction, 1(2):126–160, 1994. T. Munzner. H3: laying out large directed graphs in 3D hyperbolic space. IEEE Symposium on Information Visualization, pages 2–8, 1997. T. Munzner, F. Guimbreti`ere, S. Tasiran, L. Zhang, and Y. Zhou. Treejuxtaposer: Scalable tree comparison using focus+context with guaranteed visibility. ACM Transactions on Graphics, 22:453–462, 2003. E. Pietriga and C. Appert. Sigma lenses: focus-context transitions combining space, time and translucence. Conference on Human Factors in Computing Systems, pages 1343–1352, 2008. E. Pietriga, O. Bau, and C. Appert. Representation-independent in-place magnification with sigma lenses. IEEE Transactions on Visualization and Computer Graphics, 16:455–467, 2010. H. Qu, H. Wang, W. Cui, Y. Wu, and M.-Y. Chan. Focus+context route zooming and information overlay in 3D urban environments. IEEE Transactions on Visualization and Computer Graphics, 15:1547–1554, 2009. J. Ruppert. A delaunay refinement algorithm for quality 2-dimensional mesh generation. IEEE Transactions on Visualization and Computer Graphics, 18(3):548–585, 1995. R. Schoen and S.-T. Yau. Lectures on harmonic maps. International Press, pages 187–241, 1997. K. Shi, P. Irani, and B. Li. An evaluation of content browsing techniques for hierarchical space-filling visualizations. IEEE Symposium on Information Visualization, pages 11–18, 2005.
13
[34] J. Slack and T. Munzner. Composite rectilinear deformation for stretch and squish navigation. IEEE Transactions on Visualization and Computer Graphics, 12:901–908, 2006. [35] R. Spence and M. Apperley. Bifocal display. http://www.interactiondesign.org/encyclopedia/bifocal-display.html. [36] M. Spindler, M. Bubke, T. Germer, and T. Strothotte. Camera textures. Conf. on Computer Graphics and Interactive Techniques, pages 295– 302, 2006. [37] J. Stasko and E. Zhang. Focus+context display and navigation techniques for enhancing radial, space-filling hierarchy visualizations. IEEE Symposium on Information Visualization, pages 57–64, 2000. [38] S. Stegmaier, M. Strengert, T. Klein, and T. Ertl. A simple and flexible volume rendering framework for graphics-hardware-based raycasting. Fourth International Workshop on Volume Graphics, pages 187–241, 2006. [39] T. Tenev and R. Rao. Managing multiple focal levels in table lens. IEEE Symposium on Information Visualization, pages 59–66, 1997. [40] W. P. Thurston. Geometry and Topology of Three-Manifolds. Lecture notes at Princeton university, 1980. [41] M. Toyoda and E. Shibayama. Hyper mochi sheet: a predictive focusing interface for navigating and editing nested networks through a multi-focus distortion-oriented view. Conference on Human Factors in Computing Systems, pages 504–511, 1999. [42] M. Trapp, T. Glander, H. Buchholz, and J. Dollner. 3D generalization lenses for interactive focus+context visualization of virtual city models. International Conference on Information Visualisation, pages 356–361, 2008. [43] L. Wang, Y. Zhao, K. Mueller, and A. Kaufman. The magic volume lens: An interactive focus+context technique for volume rendering. IEEE Visualization, pages 367–374, 2005. [44] Y.-S. Wang, T.-Y. Lee, and C.-L. Tai. Focus+context visualization with distortion minimization. IEEE Transactions on Visualization and Computer Graphics, 14:1731–1738, 2008. [45] Y.-S. Wang, C. Wang, T.-Y. Lee, and K.-L. Ma. Feature-preserving volume data reduction and focus+context visualization. IEEE Transactions on Visualization and Computer Graphics, 17(2):171 –181, 2011. [46] J. Yang, M. O. Ward, E. A. Rundensteiner, and A. Patro. Interring: a visual interface for navigating and manipulating hierarchies. IEEE Symposium on Information Visualization, 2(1):16–30, 2003. [47] Y. Yang, J. X. Chen, and M. Beheshti. Nonlinear perspective projections and magic lenses: 3D view deformation. IEEE Computer Graphics and Applications, 25(1):76–84, 2005. [48] H. Ziegler and D. A. Keim. Copernicus: Context-preserving engine for route navigation with interactive user-modifiable scaling. Comput. Graph. Forum, 27(3):927–934, 2008.
Xin Zhao is a PhD candidate and Research Assistant in the Department of Computer Science, Stony Brook University, Stony Brook, New York. Her research interests are F+C visualization and lens design, feature-guided deformation and animation. She received her BS in Computer Science from Zhongshan University, Guangzhou, China (2007).
Wei Zeng received her BS and MS degrees in Computer Science from Shandong University of China in 2002 and 2005, respectively, and her PhD degree from the Institute of Computing Technology, Chinese Academy of Sciences in 2008. She is a Postdoctoral Research Associate in the Department of Computer Science, Stony Brook University, Stony Brook, New York. Her research interests are computational conformal and quasi-conformal geometry, and shape analysis, including surface matching, registration, tracking and recognition.
IEEE TRANSACTIONS ON VISUALIZATION AND COMPUTER GRAPHICS, VOL. 6, NO. 1, JANUARY 2007
Xianfeng David Gu received his PhD degree in computer science from Harvard University in 2003. He is an associate professor of computer science and the director of the 3D Scanning Laboratory in the Department of Computer Science in the State University of New York at Stony Brook University. His research interests include computer graphics, vision, geometric modeling, and medical imaging. His major works include global conformal surface parameterization in graphics, tracking and analysis of facial expression in vision, manifold splines in modeling, brain mapping and virtual colonoscopy in medical imaging, and computational conformal geometry. He won the US National Science Foundation CAREER Award in 2004. He is a member of the IEEE.
Arie E. Kaufman is a Distinguished Professor and Chair of the Computer Science Department, Chief Scientist of the Center of Excellence in Wireless and Information Technology (CEWIT), and the Director of the Center for Visual Computing (CVC) at Stony Brook University (aka State University of New York at Stony Brook). He is an IEEE Fellow, an ACM Fellow, and the recipient of IEEE Visualization Career Award (2005). He further received the IEEE Outstanding Contribution Award (1995), ACM Service Award (1998), IEEE CS Meritorious Service Award (1999), member of the European Academy of Sciences (since 2002), State of New York Entrepreneur Award (2002), IEEE Harold Wheeler Award (2004), and State of New York Innovative Research Award (2005). Kaufman was the founding Editor-in-Chief of IEEE Transactions on Visualization and Computer Graphics (TVCG), 1995-1998. He has been the co-founder, papers/program co-chair, and member of the steering committee of IEEE Visualization Conferences; co-founder/chair of Volume Graphics Workshops; co-chair for Eurographics/SIGGRAPH Graphics Hardware Workshops, and the Papers/Program co-chair for ACM Volume Visualization Symposia. He previously chaired and is currently a director of IEEE CS Technical Committee on Visualization and Graphics. Kaufman has conducted research and consulted for over 40 years specializing in volume visualization, graphics architectures, algorithms, and languages, virtual reality, user interfaces, medical imaging and their applications. He received a BS (1969) in Mathematics and Physics from the Hebrew University of Jerusalem, Israel, an MS (1973) in Computer Science from the Weizmann Institute of Science, Rehovot, Israel, and a PhD (1977) in Computer Science from the Ben-Gurion University, Israel. For more information, see http://www.cs.sunysb.edu/∼ari.
Wei Xu received her BS and MS degrees in Computer Science from Zhejiang University in 2004 and 2006. She is a PhD candidate and Research Assistant in the Department of Computer Science, Stony Brook University, Stony Brook, New York. Her research interests include regularization and parameter learning for lowdose CT reconstruction with GPU acceleration, low-level image processing for artifact reduction, visualization and visual analytics.
14
Klaus Mueller received an MS degree in biomedical engineering and a PhD degree in computer science, both from The Ohio State University. He is currently an associate professor in the Computer Science Department at Stony Brook University, where he also holds coappointments in the Biomedical Engineering and Radiology Departments. His current research interests are computer and volume graphics, visualization, visual analytics, medical imaging and computer vision. He won the US National Science Foundation CAREER award in 2001 and the SUNY Chancellor Award for Excellence in Scholarship and Creative Activity in 2011. He served as a co-chair at various conferences, such IEEE Visualization, Volume Graphics Symposium, and the Fully 3D Workshop on HighPerformance Image Reconstruction. He has authored and co-authored more than peer-reviewed 140 journal and conference papers, and he has participated in 15 tutorials at international conferences on various topics in visualization and medical imaging. He is a senior member of the IEEE and the IEEE Computer Society. For more information, see http://www.cs.sunysb.edu/∼mueller.