energy management for virtual servers should be designed at two layers, ... give the guest OSes an illusion of using a dedicated physical machine that is fully ... Most computer components, including processors, memory chips, disk drives, and ...
Computing. Vol.91, No.1, 2011, pp.3-21.
Conserving Disk Energy in Virtual Machine Based Environments by Amplifying Bursts
Yuhui Deng Department of Computer Science, Jinan University, Guangzhou 510632, People’s Republic of China Brandon Pung The Massachusetts Institute of Technology, Cambridge, MA, USA
Abstract: Computer systems are now powerful enough to run multiple virtual machines, each one running a separate operating system instance. In such an environment, direct and centralized energy management employed by a single operating system is unfeasible. Accurately predicting the idle intervals is one of the major approaches to save energy of disk drives. However, for the intensive workloads, it is difficult to find long idle intervals. Even if long idle intervals exist, it is very difficult for a predictor to catch the idle spikes in the workloads. This paper proposes to divide the workloads into buckets which are equal in time length, and predict the number of the forthcoming requests in each bucket instead of the length of the idle periods. By doing so, the bucket method makes the converted workload more predictable. The method also squeezes the executing time of each request to the end of its respective bucket, thus extending the idle length. By deliberately reshaping the workloads such that the crests and troughs of each workload become aligned, we can aggregate the peaks and the idle periods of the workloads. Due to the extended idle length caused by this aggregation, energy can be conserved. Furthermore, as a result of aligning the peaks, resource utilization is improved when the system is active. A trace driven simulator is designed to evaluate the idea. Three traces are employed to represent the workloads issued by three web servers residing in three virtual machines. The experimental results show that our method can save significant amounts of energy by sacrificing a small amount of quality of service. Keywords: Energy Conservation; Virtualization; Disk Drive; Prediction; Time Series 1.
Introduction In recent years, the performance and capabilities of computer components including processors, RAM, disk
drives, etc have increased exponentially. Due to the unprecedented growth, the resource utilization of IT systems in large enterprises is around 35%. In some enterprises, this is only at 15% [15]. Google reported that servers are rarely completely idle and seldom operate near their maximum utilization, instead operating most of the time at between 10 and 50 percent of their maximum utilization levels [1]. Modern computer systems are now sufficiently powerful to run multiple Virtual Machines (VMs) concurrently, each one running a separate Operating System (OS) instance [2]. By leveraging VMs, multiple heterogeneous OS environments can coexist on the same physical computer platform with strong isolation from each other. The ability to disperse resources amongst several VMs improves 1
Computing. Vol.91, No.1, 2011, pp.3-21.
utilization, making virtualization a green technology. This is also a major reason for the resurgence of interest in virtualization technologies. Energy saving has become one of the most important challenges in designing computing systems. For a computer that is controlled by a single OS, the OS can directly regulate its activities to attempt to meet energy constraints [22]. However, in a VM based environment consisting of multiple VMs and guest OSes, direct and centralized energy management employed by a single OS is unfeasible for three reasons. First, the guest OSes work on virtual devices (e.g. virtual CPU, virtual disk drive, virtual NIC, etc) without direct access to the physical hardware. Secondly, a single guest OS does not know that the physical hardware is being shared with other guest OSes. The third reason is that the power consumption cannot simply be partitioned amongst multiple VMs such that each one is allocated a specified share. Therefore, we believe that coordinated power management involving multiple OSs is required in such VM based environments. Many research efforts have gone into investigating the energy conservation of VM based environments. Stoess et al. [22] proposed a novel framework for managing energy in VM based environments. The framework provides a unified model to partition and distribute energy, and mechanisms for energy aware resource accounting and allocation. VirtualPower [18] supports the isolated and independent operation assumed by guest VMs running on virtualized platforms, and globally coordinates the effects of the diverse power management policies applied by these VMs to virtualized resources. Waldspurger [23] proposed several methods to support over commitment of memory and space to improve the efficiency of memory management. Stoess and Reinhardt [21] proposed that the energy management for virtual servers should be designed at two layers, within VMs and across VMs. On the one hand, only guest OSes can have fine-grain knowledge of the applications and users. On the other hand, only the hypervisor and its resource management subsystem can control global, machine-wide energy requirements and conditions. Most of the computer components support multiple power states (e.g. active, idle, and standby). Different power states consume different amounts of energy. Bursty behaviour indicates that events happen in short, uneven spurts. Modern computer workloads normally exhibit bursty behavior, which leaves opportunities for hardware components to switch from a full power state to a low power state when it is likely to save a significant amount of energy. Traditional OSes aim to share resources fairly among competing tasks to maximize the throughput and minimize the latency by making the access pattern as smooth as possible. In contrast to the traditional methods, this paper proposes to amplify the bursty behavior of the workloads by correlating multiple usage patterns from different OSes residing in different virtual machines. The approach divides the workloads into buckets which are equal in time, and predict the number of the forthcoming requests in each bucket instead of the length of the idle periods. The method also squeezes the executing time of each request to the end of its respective bucket, thus extending the idle length. By deliberately reshaping the workloads, we can aggregate the peaks and the idle periods of the workloads. Due to the extended idle length caused by this aggregation, energy can be conserved. Furthermore, as a result of aligning the peaks, resource utilization is improved when the system is active. The remainder of this paper is organized as follows. Section 2 introduces the background knowledge including the VM based environments and the power state transition of computer components. The energy conservation method and the corresponding key points are illustrated in Section 3. Section 4 evaluates the proposed idea and compares the effectiveness of our method with several different methods. Section 5 concludes the paper with remarks on its contributions. There is also a brief discussion of the work and indications of future research in Section 6. 2
Computing. Vol.91, No.1, 2011, pp.3-21.
2.
Background
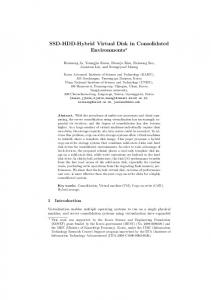
2.1 Virtual machine based environments Fig. 1 shows the overall system architecture of Xen which is a VM based environment consisting of a hypervisor, three VMs and the corresponding guest OSes (each domain is a VM), device driver modules, and other service infrastructure [2, 17]. The hypervisor is a software layer that virtualizes hardware resources and exports virtual hardware interfaces including a virtual CPU, virtual disk drive, virtual NIC, etc to the above guest OSes. The virtual hardware interfaces give the guest OSes an illusion of using a dedicated physical machine that is fully protected and isolated from other OSes. Domain U (indicates unprivileged domains including domain 1 and domain 2 in Fig. 1) is not allowed to execute privileged processor instructions. Domain 0 is created at boot time and is allowed to access the control interface provided by the hypervisor. The control interface provides the ability to create and terminate other domains and to control their associated scheduling parameters, physical memory allocations and the access to the computer's physical disk drives and network interfaces. The control interface also supports the creation and deletion of virtual network interfaces and virtual block devices [2]. The guest OS in domain 0 hosts the application-level management software and performs the tasks of creating, terminating or migrating other domains through the control interface [17].
Domain 2
Domain 0
Domain 1
Device manager
Application
Application
&controller
Software
Software
Guest OS
Guest OS
Back-end Driver Native Driver
Guest OS
Front-end
Front-end
Driver
Driver
Xen Hypervisor Hardware (CPU, Physical memory, Ethernet, Disk)
Fig. 1 A typical virtual machine environment (Xen) The Xen hypervisor allows multiple OSes to execute concurrently. A safe hardware interface is employed to allow unmodified device drivers to be shared across multiple isolated OS instances, while protecting individual OSes from device driver failure [9]. Because the device drivers normally assume they have full control of the corresponding hardware devices, in the VM based environment, the device drivers in different domains cannot run multiple instances for a single hardware device. Therefore, the device drivers are all provided by the OS and user space tools running in the isolated domain 0. Domain 0 hosts a back-end driver to serve access requests from other domains. A front-end driver is adopted by other domains to communicate with the back-end driver through a shared memory. Therefore, the back-end driver plays the role of multiplexer/demultiplexer for the front-end drivers. The current trend is to reduce the hypervisor’s support to a minimal set of hardware and to perform most of the device 3
Computing. Vol.91, No.1, 2011, pp.3-21.
control in an unprivileged driver domain. Therefore, the hypervisor and driver domain each have direct control over a small set of devices [22]. The reader is referred to [2] for a comprehensive understanding of the Xen architecture.
2.2 Power state transition R/W Requests (3)
(1) Active
Idle
Standby
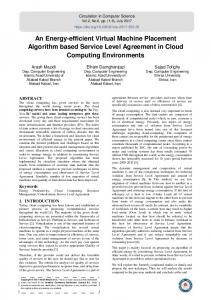
(2) (4) Fig. 2 Power state migration of disk drives Most computer components, including processors, memory chips, disk drives, and network interfaces, support multiple power states. Fig.2 depicts the power state transition of disk drives labelled with a sequence number as defined in the following descriptions. Disk drives perform work while in an active state where the disk spins at full speed. (1) When a data access is completed and there is no succeeding request, the disk drive is transferred to the idle state where the disk platters are still spinning but the electronics may be partially unpowered, and the heads may be parked or unloaded. (2) If the disk drive receives a request when it is in an idle state, the disk drive will be transferred to the active state. (3) To conserve energy, the disk drive can be spun down to the standby state where the disk stops spinning and the head is moved off the disk. (4) To perform requests after entering the standby state, the disk drive must be transferred back from the standby state to the active state by spinning up [7]. Carrera et al. [6] summarized the main energy related characteristics of three different IBM disk drives. It demonstrates that disk drives in the standby state use considerably less energy than that in the active mode, but have to be spun up to full speed before they can serve any requests. When a disk drive is spun up from the low power state (standby) to the high power state (active), it incurs a significant penalty of energy and time, because the disk platters have to be spun up to full speed before they can serve any requests and the heads have to be moved back, which requires servo calibration to accurately track the head as it moves over the drive. To justify this penalty, the energy saved by putting the disk in the standby has to be greater than the energy needed to spin it up again, and the disk has to stay in the low power state for a sufficiently long period of time to compensate the energy overhead [7]. According to the above analysis, the principles of disk energy saving are: (1) accurately predicting the idle time which can be employed to transfer the disk to a low power state, (2) extending the length of disk idle phases and forcing transitions to a standby state when this is likely to save significant amounts of energy. 3.
Energy conservation
3.1 Overview of the method Traditional OSes aim to share resources fairly among competing tasks, to maximize the throughput and minimize the latency by making the access pattern as smooth as possible. Bursts are a common data access pattern which can be identified within all kinds of computer related workloads (e.g. disk I/O, file system access, network 4
Computing. Vol.91, No.1, 2011, pp.3-21.
packages, website access, etc). Bursts indicate that data accesses happen in short, uneven spurts. Due to the bursty pattern, the physical resources are required to provide enough capability to handle the bursts, thus guaranteeing the performance. However, such kind of fat provisioning results in wasting resources when the system is relatively idle. In order to improve the resource utilization, aggregating multiple workloads to achieve the desired effect of smoothing the load depends on whether the workloads are dependent or correlated [14]. The bursty pattern brings challenges to the thin provisioning of physical resources. However, it leaves opportunities for hardware components to tackle the challenge of energy consumption.
50%
50%
25%
25%
0%
0% (a)
Time
(d)
Time
(e)
Time
50% 25%
100%
0% (b)
Time 50%
50% 25% 0%
0% (c)
Time
Fig. 3 Amplified bursty workloads of two domains Fig. 3 shows the bursty workloads in a VM based environment consisting of two domains. The X and Y axis across the five figures denote time and resource utilization, respectively. We assume that Fig. 3 (a) and Fig. 3 (b) represent the workloads generated in the domain 1 and domain 2, respectively. The highest physical resource utilization of each of the two domains is 50%. We assume that one workload cycle consists of one crest and one trough. Therefore, according to Fig. 3 (a) and Fig. 3 (b), the workload in domain 2 is lagging a half cycle behind that in domain 1. Because the workloads in domain 1 and domain 2 will be added together when served by the physical resources, Fig. 3 (c) illustrates the workloads that the physical resources will experience. It presents that the overall resource utilization reaches about 50%, because the crests and troughs in the two domains counteract each other by aggregating the workloads. Fig. 3 (d) describes the reshaped traffic of domain 2. It shows that the requests in domain 2 are held for a half cycle so that the crests and troughs of the workloads issued from two domains can be aligned. By doing this, the bursty behaviors of the workloads experienced by the physical resources are amplified, which is depicted in Fig. 3 (e). Therefore the method can save energy when the resource utilization is 0%, but only if this period is long enough to pay the energy penalty and the corresponding performance penalty as discussed in Section 2.2. It also gives some indication that for certain lengths of time, the resource is fully utilized (close to 100%). VMs encapsulate the entire state of a running system, including user-level applications and the corresponding OSes. The red dashed line in Fig. 1 depicts the data path that an I/O request travels through the VMs based environment to the physical disk drive. As discussed in Section 2.1, a front-end driver is adopted by domain U to 5
Computing. Vol.91, No.1, 2011, pp.3-21.
communicate with the back-end driver in domain 0 through shared memory. In Xen, event channels provide a notification mechanism between domains. Each domain has a set of end-points (or ports) which may be bound to an event source. When a pair of end-points in two domains is bound together, a send operation on one side will cause an event to be received by the destination domain [17]. Therefore, the workloads in domain U can be monitored and analyzed in the front-end drivers. By using the event channel, the filtered information can be sent to the back-end driver in domain 0 which has a full control of the device driver of the disk drive. When the aggregated idle period is long enough and it is likely to save significant energy, the back-end driver can adjust and regulate the disk drive by leveraging the device driver. 3.2 Workload synchronization Hsu and Smith [14] reported that if two workloads are positively correlated, aggregating the workloads results in higher peaks. If the workloads are negatively correlated, the peaks of one workload will occur when the other workload is relatively idle. If the two workloads are independent, the aggregated traffic tends to be smooth. In the VMs based environments, we want to amplify the bursty behaviors of the aggregated workload regardless of whether the multiple workloads issued from multiple domains are positively correlated, negatively correlated, or independent. Therefore, we have to synchronize the crests and troughs of the workloads issued from multiple domains, have full control of the workloads, and know the exact time points which can be employed to do the power state transition. In order to achieve this goal, we divide the workloads issued from different domains into equally sized chunks of time, known as buckets. By controlling the buckets, the method can synchronize the workloads perfectly.
3.2.1 Bucket mechanism We assume that the maximal throughput capability of a disk drive is C requests/second. The time penalty and energy penalty of spinning a disk drive down to standby and then back up to active are
T p seconds delay and E p
joules, respectively. The bucket size is B seconds. The predicted number of the forthcoming requests in the next bucket is R p . The power used by the disk drive while working in active state, idle state, and standby state is Pa , Pi and Ps , respectively. As discussed in Section 2.2, the method has to meet the following two constraints to save energy.
(B −
Pi × ( B − where
Rp C
Rp C
) ≥ Tp
) − Ps × ( B − T p −
(1)
Rp C
) ≥ Ep
(2)
R p / C denotes how long it takes for the disk drive to serve the R p requests. Equation (1) indicates that
the squeezed out idle periods at the beginning of each bucket should be longer than the time penalty taken by the disk drive to spin down and back up. Equation (2) means that the saved energy should be bigger than the energy penalty incurred by spinning up the disk drives. By meeting the two constraints, the disk drive can be switched from a full power state to a low power state. 6
Computing. Vol.91, No.1, 2011, pp.3-21.
VM1 r1 r2 Time S VM2
2
E
One Bucket
5
r4 r5 Time S
2
r1 r2 r3 r4 r5
+
Time S
E
w
E
VM3 r3 Time S
1
E
(a)
(b)
Fig. 4 bucket mechanism employed in virtual machine based environment Fig. 4 shows the bucket method used in virtual machine based environment, where S and E denote the start point and end point of one bucket. Fig. 4 (a) depicts that five requests are distributed across three VMs. If we can predict the exact number of the requests which will arrive in a bucket within a VM in advance, we can calculate the exact point at which the drive needs to be awake (denoted by w in Fig. 4 (b)) and switch on the disk drives from a low power state to a full power state to serve all the requests in the bucket without any delay. For example, Fig.4 shows that the predicted number in the bucket across the three VMs is two, two, and one, respectively. Putting the numbers together, the five requests are served at the end of the bucket by considering the service capability of the disk drives (see Fig.4 (b)). The time period from the wake up point w to the end point of the bucket E is equal to the time required to power the disk drive from a low power state to the active power state plus R p
/C.
According to Fig. 4, it is easy to observe that the bucket method can incur a certain amount of delay for the requests. Recently, it is becoming a recognition that having the maximum compute power be instantly available is not required, as long as the Quality of Service (QoS) delivered satisfies a predetermined standard. Power consumption is now a metric equal to performance [20]. Therefore, it is reasonable for the bucket method to trade some acceptable delay for energy conservation. 3.2.2 Prediction strategy Due to the bursty behaviour of the workloads, the effectiveness in energy reduction greatly depends on the accuracy in predicting future system behaviours. For example, if we can predict how long the next idle period would last and this period is long enough (to outweigh the time and energy penalty discussed in Section 2.2), the disk is explicitly spun down to the low power state. However, such kind of prediction turns out to be very difficult to achieve because of the large amount of random variance observed in the lengths of sequential idle periods. The prediction method proposed in [13] predicts the forthcoming idle periods by using the cumulative average of the previous idle periods. However, when a very long idle period occurs, the predicted value of this long idle period is often much lower than the actual idle period. This underestimation is undesirable for energy saving, especially when 7
Computing. Vol.91, No.1, 2011, pp.3-21.
the predicted value is lower than the time penalty of the disk drives. In this case, the disk drive will stay in the active power state instead of entering the standby power state which results in a large amount of unnecessary energy consumption. Our method divides the requests into buckets which are equal in size. A bucket indicates a specific time slot. Each bucket holds a group of consecutive requests. We can easily calculate how many requests go into each bucket. By doing so, the workloads are transformed to a new time series process which has much less fluctuation than the original time series process, because the spikes in the original process are shaved to a certain degree. Based on this method, we predict how many requests go to a single bucket, instead of predicting how long an idle period is, in terms of an equation (3). This method can improve the prediction accuracy because of the shaved spikes. A simple recursive prediction model [13] adopted in the bucket method is illustrated as follows.
Bnp+1 = α × Bnr + (1 − α ) Bnp where
α ∈ [0,1]
(3)
Bnp is the predicted number of requests which go the n bucket, Bnr denotes the real number of requests
which fall in the bucket n ,
Bnp+1 indicates the predicted number of requests in the n + 1 bucket, and α is a
coefficient which can be adopted to adjust the impact of the past history on the predicted value. For example, indicates that the recent history has no influence on the predicted value.
α =0
α =1 denotes that the prediction does not
consider the influence of the previous prediction. According to equation (3), we can predict how many requests will arrive in the forthcoming bucket. Based on the predicted value, the bucket method takes two measures. The first one is making a decision whether the disk drive should be spun down or not. The second one is determining at which time point within the bucket the disk drive should be spun up to serve the requests. Therefore, the prediction accuracy has an important impact on the decisions taken by the bucket method. For the first measure, an Energy Performance Coefficient (EPC) is proposed as a metric to determine whether the disk drive should be spun down or not. If the predicted energy saving per bucket resulting from transitioning into a standby state is E ps and the predicted performance delay is D p , then the EPC is D p / E ps . We assume that the predicted number of requests in the n + 1 bucket is Bn +1 . According to equation p
Bnp+1 Bnp+1 × Pa + ( B − ) × Pi , (2), for the n + 1 bucket, the consumed energy for the always on method E1 is C C and the bucket method takes energy E 2 =
Bnp+1 Bp × Pa + ( B − T p − n +1 ) × Ps + E p . Then we have the predicted C C
energy saving as follows:
E ps = E1 - E 2
(4)
We assume that the predicted requests arrive in the bucket at evenly spaced intervals, such that the average request arrival time is halfway through the bucket time. The predicted total performance delay is:
8
Computing. Vol.91, No.1, 2011, pp.3-21.
D p =(Bnp+1 × B)/ 2
(5)
For the second measure, the wake up time point w can be calculated in terms of equation (6), where LwE represents the time length from the wake up time point w (illustrated in Fig. 4 (b)) to the end of the bucket E, and t is the time it takes to power up the disk drive.
LwE =
Bnp+1 +t C
(6)
While (there is a new bucket==1) { If (drive is on) {if (( E ps >0)&&(EPC Bn +1 )
if ( N r ==0)
stay off ;
{recalculate the wake up time point w with the
Nr ;
Switch on the disk at the wake up time point w to serve the requests; }} }
Fig. 5 Pseudo code of the algorithm and the decision system In order to dynamically adjust the wake up time point w on the fly, our method regularly checks the queue which holds the requests. If there is no request in the queue, the disk drive will remain in the low power state until a new request is received. This means the predicted wake up time w is postponed. By doing so, our method can easily handle those long idle intervals which cover several bucket size. If the number of requests ( N r ) in the queue is p
bigger than the predicted value ( Bn +1 ) before reaching the predicted wake up time point w, the N r will be used to recalculate the predicted wake up time w. This indicates that the wake up time point w will be brought forward. After the disk drive is powered on, if some requests cannot be served before reaching the end point of the current bucket because of the disk drive’s capability, the requests will be delayed to be executed at the beginning of the next bucket. As soon as the requests are completed, our method will perform the next round of prediction and calculation for the new bucket. According to the above introduction, the bucket size plays a very important role in the proposed idea. It has to meet several constraints as discussed in Section 3.2.1. Based on that, the smaller the bucket size is, the less the prediction error. However, small bucket size may not be able to conserve significant amounts of energy because it leaves a shorter idle length within each bucket. With the growth of the bucket size, more energy can be saved at the expense of QoS. Therefore, an optimal bucket size will endow the proposed method with a lot of potential. Fig. 5 summarizes the above algorithm by using pseudo code. 9
Computing. Vol.91, No.1, 2011, pp.3-21.
4
Evaluation Trace driven simulation is a principal approach to evaluate the effectiveness of our proposed design, because it
is much easier to change parameters and configurations compared with a real system implementation. Therefore, we designed a trace driven simulator to evaluate the proposed idea. In order to evaluate the idea proposed in this paper, an always on method, a timeout approach, and an idle length prediction method are implemented to compare the effectiveness of different methods. For the always on method, the requests are served when the disk drive is in an active state. After a request is served and there is no succeeding request, the disk drive will be changed to the idle state. This method does not involve any performance and energy penalty because it never spins down the disk platters. We employed the always on method as a baseline system. The timeout method is a traditional and simple strategy. Once a disk drive is idle for a specific period which is longer than a specified timeout threshold, the disk is spun down to save energy. Upon the arrival of a new request, the disk is spun up to serve requests [10]. The idle length prediction method is straightforward. We predict the idle intervals and switch the disk drive to a low power state when the predicted idle intervals are long enough to save energy. Two metrics are proposed to evaluate the idea of amplifying bursts and comparing different methods. The first metric is percentage of energy saving, which denotes how much energy can be saved in comparison with the always on method. The second metric is QoS, which indicates how many requests can be satisfied within a predefined delay. For example, if the delay is set as 3 seconds, 90% QoS indicates that 90% of the requests can be served within 3 seconds. In the following measurements, we assume that the throughputs of the disk drives are 20 requests per second. 4.1 Experimental environment Table 1. Characteristics of three traces Trace name
Number of requests
Read percentage
EPA
47746
96%
Average number of
Maximal number of
requests per bucket
requests per bucket
8.3
61
Saskatchewan
7237
99%
1.3
14
Calgary
1218
100%
0.2
20
Saskatchewan
Calgary
EPA
Saskatchewan
EPA
25 Requests per time unit
Requests per time unit
Calgary 6 5 4 3 2 1 0
1
101 201 301 401 501 601 701 801 901 1001
20 15 10 5 0 1
51
101
151
201
251
301
(a) One second (b) Thirty seconds Fig. 6 Number of requests per time unit EPA, Saskatchewan, and Calgary are three HTTP traffic traces [16]. We assume that a server is shared by three 10
Computing. Vol.91, No.1, 2011, pp.3-21.
VMs, each of which holds a web server. Therefore, the three traces can represent the workload traffics issued from the three web servers residing in three different VMs. Each trace in our experiment coves a period of 24 hours. Each line of the traces contains an access date and time, operation type, request size, accessed data location, host making the request, etc. Without any optimization, the three individual workloads will be interleaved in their arrival at the physical disk drives shared by the three VMs. Table 1 illustrates the characteristics of the three traces used in our experiment. It shows that EPA is the busiest one among the three original traces. Thus, it is more bursty than the other two traces. Fig. 6 shows the throughput of a section of the three traces with different time granularity. Fig. 6(a) illustrates the number of requests per second. Fig. 6(b) shows the number of requests per thirty seconds. Both two figures confirm the burstiess of the three traces. As discussed in Section 3.2.2, we predict how many requests are supposed to arrive within one bucket for each of the three traces, and calculate the sum of the three predicted values. By using the sum, the system can determine whether the disk drive should be spun down or not, and what time the disk drive should be spun up after it is spun down. Table 2. Main power related characteristics Parameters
IBM 36Z15
IBM 40GNX
Power (Active)
13.5Watt
3.0 Watt
Power (Idle)
10.2 Watt
0.82 Watt
Power (Standby)
2.5 Watt
0.25 Watt
Energy (Spin Down)
13.0 Joule
0.4 Joule
Energy (Spin Up)
135.0 Joule
8.7 Joule
Time (Spin Down)
1.5 Sec
0.5 Sec
Time (Spin Up)
10.9 Sec
3.5 Sec
Two disk drives including a server disk drive (IBM 36Z15) and a laptop disk drive (IBM 40GNX) are used to evaluate the proposed idea and the corresponding methods. The characteristics of the two disk drives are described in Table 2. Using the laptop disk drives in high-end servers which hold multiple VMs may be counter-intuitive. However, if the servers are not used for the I/O intensive applications, we argue that the laptop disk drives can meet the performance and reliability requirements, while saving significant amounts of energy [6]. For the server disk drive (see Table 2), it takes 1.5 seconds to spin down and 10.9 seconds to spin up. Therefore, according to equation (1), the minimal bucket size is 12.4 seconds in order to pay off the time penalty. In this section, we set the bucket size as 15 seconds, 18 seconds, and 21 seconds to evaluate the idea. For the statistic in Table 1, the bucket size is 15 seconds. 4.2 Prediction evaluation
11
Computing. Vol.91, No.1, 2011, pp.3-21.
Predicted value
Real value 600
400
500
Idle interval
Idle interval
Real value 500 300 200 100
Predicted value
400 300 200 100
0
0
0
2000
4000 6000 8000 10000 12000 Number of idle intervals
0
1000
2000
3000
4000
5000
Number of idle intervals
(a) EPA trace
(b) Saskatchewan trace Real value
Predicted value
Idle interval
8000 6000 4000 2000 0 0
100 200 300
400 500 600 700 800
Number of idle intervals
(c) Calgary trace Fig. 7 Comparison of the real intervals and the predicted intervals
Real value
Predicted value
0
1000
2000
3000
4000
Predicted value
15 Number of requests
Number of requests
Real value 70 60 50 40 30 20 10 0
10 5 0 0
5000
1000
Bucket number
(a) EPA trace
2000 3000 4000 Bucket number
5000
(b) Saskatchewan trace Real value
Predicted value
Number of requests
25 20 15 10 5 0 0
1000
2000
3000
4000
5000
Bucket number
(c) Calgary trace Fig. 8 Comparison of the predicted value per bucket and the real value per bucket Prediction is a very important part of the bucket method, because the more accurate the prediction is, the better 12
Computing. Vol.91, No.1, 2011, pp.3-21.
results the bucket method can achieve. By using equation (3), Fig. 7 shows that the predicted intervals do not match the real intervals, especially for those long intervals. As discussed in Section 3.2.2, the time series prediction cannot catch the idle spikes. The reason is because the predicted value depends on the past behavior. If the previous intervals are short, the predicted interval is supposed to be short. Fig. 8 plots the predicted number of requests per bucket and the real number of requests per bucket for three traces. It shows that across the three traces, the prediction is good and following the real value. It is well known that workload is normally bursty. When the workload is changing from a traffic trough to a traffic peak, the predicted value is normally lower than the real value, and vice versa. Fig. 8 (b) and (c) demonstrate that most of the predicted value are lower than the real value. This indicates that the traffic peaks are separated by relatively long traffic troughs, and the workload is also not very intensive. This is consistent with the characteristics of three traces summarized in Table 1. If we define the prediction accuracy as the distance between the real value and the predicted value, then, the smaller the distance is, the more accurate the prediction is. Based on this, Fig.7 and Fig. 8 confirms that the bucket method can improve the prediction accuracy. 100%
100%
50%
50%
0% 1
1.5
2
2.5
0%
3
Saved energy
6% 7% 8%
8% 9%
QoS
96% 94% 92% 92% 87%
25
30
35
40
45
Saved energy
7%
7%
8%
8%
8%
QoS
92% 92% 87% 87% 86%
EPC
(a) Server disk drive
EPC
(b) Laptop disk drive
Fig. 9 Impact of energy performance coefficient (EPC) Fig. 9 shows the impact of different EPC values on the saved energy and QoS degradation for the bucket method. In the above measurements, the bucket size is 21 seconds, the acceptable delay is 2 seconds, and the always on method is employed as a baseline. Fig. 9 (a) depicts that for the server disk drive, with the growth of the EPC, the saved energy is increased but the QoS is decreased. For example, when the EPC varies from 1 to 3, the saved energy is improved from 6% to 9% and the QoS is degraded from 96% to 87%. This is reasonable because high EPC indicates high delay incurred by the method. Since laptop disk drives have significantly different characteristics in comparison with server disk drives, especially the performance and energy penalty of the disk spinup, Fig. 9 (b) measures the same influence of EPC as that of Fig. 8 (a) for a laptop disk drive. The experimental results are consistent with that illustrated in Fig. 9 (a). Please note that the EPC for the laptop disk drive is much higher than that for the server disk drive. This is because the energy saved per bucket of the laptop disk drive is much smaller than that of the server disk drive in terms of equation (4). The EPC has an opposite impact on the energy saving and QoS. The higher the energy saving is, the lower the QoS can be achieved. The system allows users to set an acceptable delay and the corresponding QoS, and then use the parameters to pick the highest EPC that would
satisfy the requirements. 4.3 System evaluation It is reasonable that user satisfaction will decrease as system response time increases. Hoxmeier and DiCesare 13
Computing. Vol.91, No.1, 2011, pp.3-21.
[12] reported that for the browser based applications, the highest level of satisfaction existed when the system response time was 3 seconds. However, satisfaction stayed high and fairly steady when the response time was varied from 3 seconds to 9 seconds. When the response time reached 12 seconds, there was a noticeable drop in satisfaction. Therefore, in the tests of this section, we will discuss the saved energy and the QoS from 1 second to 6 seconds. For the first round of the test, we used the parameters of a server disk (IBM 36Z15). For this disk, the always on method used 890,304 Joules of energy. Because all requests can be served immediately, we assume that this method does not incur any performance delay. In the following figures, TO, IL, and BU denote timeout method, idle length prediction method, and the bucket method proposed in this paper, respectively. The numbers in the brackets following the abbreviation indicate the delay. For example, BU (21s) indicates that the bucket size is 21 seconds. Fig. 10 (a) depicts the saved energy of different methods in comparison with the always on approach. The figure shows that when the timeout thresholds are set as 2 seconds, 5 seconds, and 10 seconds, the method obtains -1%, 3%, and 3% energy saving, respectively. The highest energy saving (8%) is achieved by using the bucket method with 21 seconds delay (BU (21s)). For the bucket method, the saved energy is increased with the growth of the delay and the bucket size. It is very interesting to observe that for the bucket method, when the bucket size is 15 seconds, it does not save any energy. This is because the bucket size is too small to justify paying the energy and performance penalty, and therefore the disk drive never transitions into the standby state. When the bucket size is
10% 8%
T O(2s) IL BU(21s)
(a) Saved energy
BU(21s)
Different methods
BU(18s)
BU(15s)
IL
TO(10s)
TO(5s)
0% -2%
QoS(%)
6% 4% 2% TO(2s)
Saved energy(%)
changed to 18 seconds and 21 seconds, the method achieves 7% and 8% energy saving.
T O(5s) BU(15s)
T O(10s) BU(18s)
1 0.9 0.8 0.7 0.6 0.5 0.4 1
2
3 4 5 Delay of the requests(s)
6
(b) Cumulative distribution function of QoS
Fig. 10 Evaluation of the IBM 36Z15 disk drive A Cumulative Distribution Function (CDF) describes the probability distribution of a variable. In order to measure the QoS, we employed CDF to describe how many requests can be satisfied within an acceptable delay. Fig. 10 (b) demonstrates the incurred delay of all requests by using different methods. It shows that when the bucket size is 15 seconds, the BU method offers the best QoS, because the disk drive is never spun down in this scenario. The traditional TO (2) method provides the lowest QoS and achieves the lowest energy saving. With the growth of timeout threshold, this method achieves better performance and QoS. The reason is because the method incurs two disadvantages. The first one is that the method does not save energy when the disk is waiting for timeout to expire. The second one is that it is very likely for the disk to receive a new request just after the disk reaches the timeout threshold and is spun down to save energy. Therefore, a significant performance and energy penalty will be incurred. In contrast with the TO approach, the IL method obtains the very good QoS but offers moderate energy conservation. For example, when the acceptable delay is 1 second, the QoS reaches 98%, and the energy conservation is 3%. For the BU approach, when the bucket size is 18 seconds, the method achieves 91% QoS with 14
Computing. Vol.91, No.1, 2011, pp.3-21.
an acceptable delay of 1 second, while providing 7% energy saving. Compared with the BU (18), BU (21) obtains a slight increase with both the QoS and energy saving. T O(2s) IL BU(21s) 1
0%
0.9
BU(21s)
BU(18s)
BU(15s)
IL
TO(10s)
-20%
TO(5s)
-10%
QoS(%)
10%
TO(2s)
Saved energy(%)
20%
T O(5s) BU(15s)
T O(10s) BU(18s)
0.8 0.7 0.6
-30%
1
2
Different methods
(a) Saved energy
3 4 Delay of requests(s)
5
6
(b) Cumulative distribution function of QoS
Fig. 11 Evaluation of the IBM 40GNX disk drive In order to further evaluate the BU method, we applied the different methods to a laptop disk drive (IBM 40GNX), because the disk drive has much lower performance and energy penalties in comparison with the server disk drive. In this round of tests, the always on method consumed 76,941 Joules of energy for the full 24 hour trace. It is very interesting to observe from Fig. 11 (a) that the TO method consumes more energy than the baseline system no matter how long the timeout threshold is. For example, when the threshold is 2 seconds, the consumed energy is 126% of the baseline method. Even if the threshold is increased to 10 seconds, it still takes 1% more energy than the baseline method. The saved energy of the IL and BU methods follow a similar trend as illustrated in Fig. 10 (a). As expected, the saved energy is improved with the increase of the delay and the bucket size. The BU (15) does not obtain any energy saving because the bucket size is not long enough to pay the energy and performance penalty. Therefore, it does not spin down the disk drive. When the bucket size is increased from 18 seconds to 21 seconds, the saved energy grows from 8% to 10%. Fig. 11 (b) describes the delay of all requests for the different methods. The IL method does not perform well, only achieving 1% energy saving. On the contrary, the BU (21) offers a very good QoS. 91.4% of requests can meet the constraint when the acceptable delay is configured as 1 second. If the acceptable delay is increased from 3 seconds to 6 seconds, the QoS is changed from 92% to 93%. BU (18) also performs very well. 92% QoS is guaranteed with 1 second of acceptable delay. 4.4 Impacts of Disk Throughput Table 3. Impacts of disk throughput on the saved energy and QoS Server disk (IBM 36Z15)
Laptop disk (IBM 40GNX)
Disk throughput
Saved energy
QoS
Saved energy
QoS
20
8.42%
92.35%
7.42%
92.47%
40
8.53%
92.32%
8.09%
91.74%
80
8.61%
92.26%
8.38%
91.61%
In the above experiments, we employed a simplified disk model and assumed the disk throughput as 20 requests per second. This section will explore the impacts of different disk throughput on the bucket method. Table 3 summarizes the impacts when the throughput is increased from 20 to 40, and 80. In the above measurements, the 15
Computing. Vol.91, No.1, 2011, pp.3-21.
bucket size is 21 seconds, the acceptable delay is 2 seconds, and the always on method is employed as a baseline. Table 3 shows that the impacts of disk throughput on the bucket method are neglectable when the parameters of a server disk are adopted. When a laptop disk drive is used, the impacts have slight variation. According to Table 3, a basic trend is that the saved energy grows and the QoS degrades with the increase of disk throughput. However, we believe that the insignificant impacts should not affect the effectiveness of the bucket method. The reason behind this can be explained by equation (1). The equation indicates that for the same workload, the length of the squeezed out idle periods depend on the bucket size and the throughput of the disk drive. Theoretically, the length grows with the increase of the disk throughput. However, the length of the squeezed idle intervals is orders of magnitude longer than the disk service time. Therefore, slight variations of the disk service time should not affect the length of the squeezed idle periods, and impact the bucket method. DiskSim [5] is an efficient, accurate, highly configurable, and trace-driven disk system simulator. It can give more accurate results about the disk service time. But, we believe that changing the simplified disk model to the DiskSim should not affect the effectiveness of the bucket method in terms of the above discussions. 5
Discussion and conclusion In this paper, we proposed to tackle the energy consumption in a VM based environment by correlating and
amplifying the bursts of workloads from different OSes residing in different VMs. A bucket method which trades a small amount of delay for energy conservation is designed to achieve the goal. The workloads are divided into buckets of equal size. Requests going to the same bucket are squeezed at the end of the bucket to be executed. Therefore, the extended idle length within buckets can be leveraged to save energy only if the length can pay off the energy and performance penalty as discussed in Section 2.2. The bucket method predicts how many requests go to a single bucket instead of predicting how long an idle period is. This method improves the prediction accuracy because of its ability to shave spikes that are present in the original traces. In contrast to the traditional timeout method and the idle length prediction approach, the proposed bucket method strikes a good balance between energy conservation and QoS. By using a server disk drive and a laptop disk drive, the experimental results validate the effectiveness of our idea. However, the bucket method does not solve all the problems of prediction since prediction is closely related to the workload. The reason why the bucket method can improve the prediction accuracy is because the method reduces the burstiness of workload to a certain degree. Therefore, for the same workload, the prediction accuracy of the bucket method always outperforms that of predicting the idle periods. Computer components can be classified into two categories: mechantronic components and clocked electronic components. Disk drives belong to the first category [8]. The second category includes processors, memory chips, network interfaces, etc. Power consumption of the clocked electronic components is proportional to the cube of the supply voltage [24]. Since the components may not be fully utilized all the time, voltage scaling can be employed to run the components at a lower speed while still finishing the same amount of work as running them faster, thus achieving energy conservation [11]. The clock of an idle component can also be stopped during the period of idleness. For example, a processor can be idled by using clock gating. Such clock gating has a small overhead in terms of additional circuits and often zero performance overhead because the component can transition from an idle to an active state in one (or several) cycles [3, 19]. Current desktop and server processors can consume less than one-third of their peak power at very low workloads. The mobile and embedded processors can do even better [1]. Based on the above analysis, we believe that the method proposed in this paper can also be applied to the clocked 16
Computing. Vol.91, No.1, 2011, pp.3-21.
electronic components in the VM based environments. It could even outperform the disk drives since the components do not have very big performance and energy penalties suffered from transitions from a low power state to a full power state in comparison with disk drives. For example, the StrongARM SA-1100 requires only 160 milliseconds to switch the processor from a sleep state to an active state [3]. The required power for the transition is the same as the processor working in the active state. We will explore the above topics as our future work.
Acknowledgements We would like to thank the anonymous reviewers for helping us refine this paper. Their constructive comments and suggestions were very helpful. The initial work in this paper was conducted when the author worked at EMC Corporation as a senior research scientist. The work was enhanced and the paper was revised after the author joined Jinan University. Therefore, the author wishes to express thanks to Burt Kaliski, Peter Madany, Jun Li, and Jason Zhang, who offered a number of constructive comments.
References [1]. Barroso L, Hölzle U (2007). The case for energy-proportional computing. Computer 40(12): 33-37 [2]. Barham P, Dragovic B, et al.(2003). Xen and the art of virtualization. In: Proceedings. of the 19th SOSP, pp.164-177 [3]. Benini L, Bogliolo A, Micheli G (2000). A survey of design techniques for system-level dynamic power management. IEEE Transactions on VLSI systems 8 (3): 299-316 [4]. Bisson T, Brandt S, Long D (2007). A hybrid disk-aware spin-down algorithm with I/O subsystem support. In: Proceedings of IEEE IPCCC 2007, pp.236-245 [5]. Bucy J S, Ganger G R(2003). The DiskSim simulation environment version 3.0 reference manual. Technical Report CMU-CS-03-102. [6]. Carrera E, Pinheiro E, Bianchini R (2003). Conserving disk energy in network servers. In: Proceedings of the 17th ICS’03, pp.86-97 [7]. Deng Y, Wang F, Helian N (2008). EED: energy efficient disk drive architecture. Information Sciences. 178 (22): 4403-4417 [8]. Deng Y (2009). Exploiting the performance gains of modern disk drives by enhancing data locality. Information Sciences. 179(14): 2494-2511 [9]. Fraser K, Hand S, Neugebauer R, Pratt I, Warfield A, Williamson M (2004). Safe hardware access with the Xen virtual machine monitor. In: Proceedings of the 1st Workshop on OASIS. [10]. Gniady C, Butt A, Hu Y, Lu Y (2006). Program counter-based prediction techniques for dynamic energy management. IEEE Transactions on Computers 55(6): 641-658 [11]. Haldar V, Probst C, Venkatachalam V, Franz M (2003). Virtual-machine driven dynamic voltage scaling. Technical Report CS-03-21, University of California, 2003. [12]. Hoxmeier J, DiCesare C (2000). System response time and user satisfaction: an experimental study of browser-based applications. In: Proceedings of AMCIS. [13]. Hwang C, Wu A (2000). A predictive system shutdown method for energy saving of event-driven computation. ACM TODAES 5(2): 226 - 241 17
Computing. Vol.91, No.1, 2011, pp.3-21.
[14]. Hsu W, Smith A (2003). Characteristics of I/O traffic in personal computer and server workloads. IBM Systems Journal 42 (2): 347-372 [15]. IDC China 2008 Predictions (2008). China2008 Top 10 Information and Communication Technology Predictions. [16]. Internet Traffic Traces (2009). http://ita.ee.lbl.gov/html/traces.html [17]. Liu J, Huang W, Abali B, Panda D (2006). High performance VMM-bypass I/O in virtual machines. In: Proceedings of the annual conference on USENIX '06 Annual Technical Conference [18]. Nathuji R, Schwan K (2007). VirtualPower: coordinated power management in virtualized enterprise systems. In: Proceedings. of 21st SOSP, pp.265-278. [19]. Rotem E, Naveh A, Moffie M, Mendelson A (2004). Analysis of thermal monitor features of the Intel Pentium M processor. In Workshop on Temperature Aware Computer Systems, 2004. [20]. SPEC-Power and Performance.http://www.spec.org/power_ssj2008/ [21]. Stoess J, Lang C, Reinhardt M (2006). Energy-aware processor management for virtual machines. Poster of 1st ACM EuroSys 2006. [22]. Stoess J, Lang C, Bellosa F (2007). Energy management for hypervisor-based virtual machines. In: Proceedings of USENIX’07. [23]. Waldspurger C (2002). Memory resource management in VMware ESX server. In: Proceedings of the 5th OSDI. [24]. Zhang F, Chanson S (2004). Blocking-aware processor voltage scheduling for real-time tasks. ACM TECS 3(2): 307-335
18