Detection, Detection, Detection: Considerations for Enzyme/Substrate ... and
chemiluminescent substrates for each enzyme was monitored for 30 minutes.
Detection, Detection, Detection: Considerations for Enzyme/Substrate Selection in Immunoassay Development Wendy D. Nelson, Ph.D. and Gary Opperman SurModics, Inc., Eden Prairie, MN Introduction
SENSITIVITY, DYNAMIC RANGE, AND DETECTION LIMITS
Detection limit, dynamic range, and reproducibility are cornerstones in the development of a successful immunoassay application. During the optimization process, antibody/antigen systems are carefully chosen to provide the specificity and sensitivity of the desired analyte measurement. However, the choice of enzyme/substrate can also have a substantial effect on achieving the above-mentioned parameters and require equal attention for optimal selection. Often the most “sensitive” substrate is chosen without consideration of necessity or tradeoff with dynamic range and reproducibility. In order to give assay developers some guidance in the selection of detection methods, we have used
1
horseradish peroxidase (HRP) and alkaline phosphatase (AP) conjugates of streptavidin to compare colorimetric (e.g. tetramethylbenzidine (TMB), 2,2′-Azino-bis(3-ethylbenzothiazoline-6-sulfonic acid) (ABTS), para-Nitrophenylphosphate (pNPP)) and chemiluminescent (e.g. luminol Absorbance
and dioxetane) substrates in a simplified capture antibody assay. Using this model system, we have examined both the choice of detection enzyme as well as substrate to measure detection limit, dynamic range, and kinetics. The results indicate that the “fastest” substrate (e.g. “high sensitivity TMB”) did not consistently have the best detection limit and was lacking in dynamic range. Chemiluminescent substrates did not show significantly better detection limits and dynamic range, as is often suggested by current literature. Surprisingly, substrates such as
Analytical Sensitivity
TMBS TMBW TMSK TTMB TMBX PNPS
0.5
ABTS and our new developmental TMB (TMBX) gave both good detection limits as well as large dynamic ranges. Several substrates had linear kinetics over the assay development time, allowing for further optimization to get either better detection limits or dynamic range. Understanding the impact of these detection systems on the immunoassay application is essential and should always be a primary consideration for design.
Figure 6: Theoretical Precision Profiles
Table 1: SurModics BioFX® Substrates
Enzyme
TMB Super Sensitive HRP One Component (TMBS)
HRP
TMB HRP One Component (TMBW)
HRP
TMB Slow Kinetic HRP One Component (TMSK)
HRP
TMB Super Slow Kinetic HRP One Component (TTMB)
HRP
theoretical concentration. LLQ (lower limit of quantitation) and ULQ (upper limit of quantitation) were illustrated at 20% CV for TMBX, PNPS,
New TMB – In Development (TMBX)
HRP
2,2’-Axino-bis[3-ethylbenzothiazoline-6-sulfonic acid] HRP One Component (ABTS)
HRP
and ABTS (ULQ off scale). The combination of analytical sensitivity (Fig. 4) and standard error impact the quantitation limits for each substrate.
AP-Yellow One Component (PNPS)
AP
AP-Blue SpectraFX (APBS)
AP
Chemiluminescent Ultra Sensitive HRP (CHMI)
HRP
Chemiluminescent Sensitive Plus HRP (LERI)
HRP
Chemiluminescent Ultra Sensitive AP – 450 nm (APU4)
AP
Chemiluminescent Ultra Sensitive AP – 540 nm (APU5)
AP
Chemiluminescent Super Sensitive AP – 450 nm (APS4)
AP
Chemiluminescent Super Sensitive AP – 540 nm (APS5)
AP
0
Precision profiles were calculated assuming a perfect fit. The standard deviations in the absorbance measurements at each data point were 0
0.01
0.02 0.03 MsIgG (ng/mL)
0.04
0.05
Table 2: Analytical Sensitivity Substrate
used to back-calculate the resulting variation in concentration. This deviation was then used to calculate a coefficient of variation based on the
r2
Slope (mOD/ng/mL)
Time to reach detection limit (min.)
Dynamic Range (pg/mL)
Substrate
Enzyme
Type
Detection Limit (pg/mL)
TMBS
HRP
Colorimetric
3-6
5
3-320
TMBW
HRP
Colorimetric
3-6
15
3-320
TMSK
HRP
Colorimetric
3-6
30
6-625
TTMB
HRP
Colorimetric
3-6
30
6-625
TMBX
HRP
Colorimetric
3-6
30
6-2500
ABTS
HRP
Colorimetric
6-12
15
6->10,000
Inc.) and incubated for 2 hours at room temperature. The plates were washed (3X PBS/Tween) and either streptavidin-peroxidase or
CHMI
HRP
Chemiluminescence
1-3
5
1-3000
streptavidin-alkaline phosphatase (Jackson ImmunoResearch) were diluted to 1 µg/mL in StabilZyme® AP Stabilizer or StabilZyme® HRP
LERI
HRP
Chemiluminescence
1-3
5
3-3000
PNPS
AP
Colorimetric
1-6
50-100
3-5000
Figure 4: Lower Limit of Detection – Analytical Sensitivity
APBS
AP
Colorimetric
1-3
15
3-625
Linear graph of signal versus concentration (MsIgG) at the lower limits of detection for TMB and PNPS substrates. Analytical sensitivity is
APU4
AP
Chemiluminescence
3-6
20-30
3-10,000
traditionally defined as the signal change per unit of concentration. Here TMBS and TMBW have the steepest slopes and therefore have the highest
APS4
AP
Chemiluminescence
3-6
20-30
3-10,000
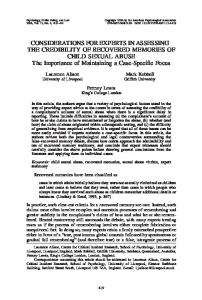
Figure 1: Model Immunoassay System
TMBS (HRP)
17.0
0.9993
TMBW (HRP)
16.5
0.9995
TMSK (HRP)
14.4
0.9965
TTMB (HRP)
10.2
0.9995
Rabbit anti-mouse IgG (Jackson ImmunoResearch) was coated at 0.1µg/well on a 96-well ELISA plate (Nunc) and stabilized with StabilCoat®
TMBX (HRP)
11.6
0.9995
Stabilizer (SurModics, Inc.). Biotinylated mouse IgG (Jackson ImmunoResearch) was titrated in StabilZyme SELECT® Stabilizer (SurModics,
PNPS (AP)
5.7
0.9998
Stabilizer (SurModics, Inc.) respectively and incubated for 20 minutes at room temperature. After a final wash (6X PBS/Tween), the substrate was added and developed according to recommended protocols.
SUBSTRATE KINETICS 2.5
1
Kinetic Profile of Chemiluminescent Substrates at 0.3 ng/mL
1
Kinetic Profile of Colorimetric Substrates at 0.3 ng/mL 2
0.8
analytical sensitivity. Analytical sensitivity does not always mean better detection limits as observed in Table 3 where all these substrates have
Table 3: Experimentally Determine Detection Limits and Ranges for Substrates
similar levels of detection. Some assays that have all samples close to the detection limit may benefit from a substrate choice with better analytical
The detection limit for each substrate was determined from experimental data using both Student’s t-test and Tukey’s multiple comparison. Values
sensitivity.
were determined from at least three separate experiments with n ≥ 4 for each substrate. Upper end of dynamic range was determined either by
0.6
1
0.4
Normalized Signal
1.5
Absorbance
Absorbance
0.8
TMBW
where the reading was saturated or where the precision profile indicated > 20% CV. Optimization of timing allows for selection of the dynamic
0.6
range. The requirements of the assay should be considered when selecting the substrate. For example, if a low detection limit is the only 0.4
PNPS 0.5
0.2
ABTS
APS5 0
0
4
6
8
10
12 14 16 18 Time (minutes)
20
22
24
26
28
PNPS might be an excellent substrate.
4
APU5
0
2
TMB Dynamic Range Comparison
LERI
0.2
APBS 0
requirement, the TMB reagents would provide this in a minimum amount of time. If larger dynamic range with good detection limits is needed,
CHMI
0
30
2
4
6
8
10
12 14 16 18 Time (minutes)
20
22
24
26
28
TMBW
30
TMBX
Figure 2: Kinetic Profile of Substrates 3
colorimetric substrates, PNPS and APBS (Table 1). When choosing a substrate, consideration to assay development timing and linearity should be made to determine the best substrate for your particular assay. Sometimes “faster” substrates are less desirable because linearity of response is lost for the assay’s detection range.
Absorbance
The signal generated by both colorimetric and chemiluminescent substrates for each enzyme was monitored for 30 minutes. The concentration chosen, 0.3 ng/mL (MsIgG) was within the dynamic range for all substrates. The most linear kinetic response was observed for the AP
Considerations When Choosing the Optimal Substrate 1. Kinetics of both the enzyme and substrate – a faster enzyme/substrate does not always give better detection limits
2
2. Detection limit and analytical sensitivity are not always equivalent 1
Timecourse for CHMI Standard Curves 4.50E+07 0 Minutes
4.00E+07 1 Minute
RLU
3.50E+07
5 Minutes
3.00E+07
10 Minutes
2.50E+07
20 Minutes
0 1
30 Minutes
2.00E+07
10
100
1000
10000
3. Dynamic range is an important consideration – choosing a substrate with a large dynamic range does not always mean a significantly lower detection limit, e.g., TMBX, ABTS, and PNPS
Ms IgG (pg/mL)
1.50E+07 1.00E+07 5.00E+06 0.00E+00 1
10
100
1000
10000
100000
1000000
MsIgG (pg/mL)
Figure #3: Kinetics of Chemiluminescent HRP Substrates
Figure 5: Dynamic Range Considerations
Standard curves were calculated at different time points for CHMI (Table 1) substrate. The rapid degradation of signal for the chemiluminescent
An example of a saturation curve for both TMBW and TMBX with their corresponding four parameter fits is shown. Dynamic range is an important
HRP substrates (Fig. 2), especially at high HRP concentrations, caused oversaturation, limiting the measurable dynamic range. If it is possible to
consideration when measurement of a broad range of values is needed. While TMBX is a slower substrate, it provided the ability to quantify into
use these substrates as an immediate flash reading, saturation is less and allows for a larger dynamic range (see 0 time point). However, it is
the upper range of the assay while maintaining similar detection levels. TMBW is faster but “tops out” and the upper detection levels are lost. This
important to consider substrate addition time and plate read time (instrument specific) when optimizing an assay using chemiluminescent HRP
was observed even at time points as short as 5 minutes. Depending on your assay’s requirements, faster is not always better!
substrates, especially if a large number of plates will be analyzed.
4. Chemiluminescent substrates provide only slightly better detection limits and dynamic range than colorimetric substrates; the kinetics, especially of the HRP substrates, can cause difficulty with plate to plate variation and reproducibility.
Contact Information Wendy D. Nelson, Ph.D.
[email protected]