Consistency of biochar properties over time and production scales: A characterisation of standard materials. Ondřej Mašeka*, Wolfram Bussa, Audrey Roy-Poiriera,b, Walter Lowea, Clare Petersa, Peter Brownsorta, Dimitri Mignardb, Colin Pritchardb, and Saran Sohia a
UK Biochar Research Centre, School of GeoSciences, University of Edinburgh, Crew Building, Alexander Crum Brown
Road, Edinburgh, EH9 3FF, UK bInstitute
for Energy Systems, School of Engineering, University of Edinburgh, Mayfield Road, Edinburgh EH9 3DW, UK
*Correspondence: Ondřej Mašek, tel. 0131 6505095, e-mail:
[email protected]
Keywords biochar, standard, slow pyrolysis, quality, scale Paper type: primary research
Abstract Users of biochar in the field require this product to reliably meet its declared specifications. For the first time, this work investigated, whether these specifications could be reproducibly obtained as a sole function of the thermal history of the biomass feedstock during slow pyrolysis, irrespective of the type and scale of the production unit. Using volatile matter content as a proxy for a wider set of biochar quality parameters, biochar from units at scales from grams to hundreds of kilograms, representing three main types of slow pyrolysis units (fixed bed, screw reactor and rotary kiln) were investigated. For the first time we showed that comparable biochar could be produced by these very different pyrolysis units, with good reproducibility within individual as well as among separate production runs.
1 Introduction Over the past ten years, biochar research has been in a phase of a rapid growth, with over 4000 published papers as of September 2017 [1], covering an increasingly wide range of scientific and engineering disciplines. The general term “biochar” encompasses a wide range of materials with a whole spectrum of properties, depending on the feedstock used, as well as production conditions, such as highest treatment temperature (HTT), kiln residence time (RT), heating rate (HR) and biochar interaction with pyrolysis vapours [2–9]. As a result of this diversity of biochar, when applied to different soils, a whole spectrum of effects on crop responses has been reported [10–13]. Although many reported improved crop output [14–17], other studies observed no effect, or even negative effects [18–21]. A general understanding of how biochar affects the soil environment and how it interacts with soil, soil microbes and plants is still missing, although progress has been made in many directions [22]. Using or cross-referencing experimental biochar material with “standard” biochar can increase collective interpretation of data. It gives confidence in the application of standard methods and informs the relevance of measured properties to biochar function. Toward this goal the UK Biochar Research Centre (UKBRC) at the University of Edinburgh created a set of twelve Standard Biochar (https://www.biochar.ac.uk/standard_materials.php). To date (as of mid-2017), samples of these materials have been supplied to over 60 research groups around the world, for use in their research. Studies carried out using these standard biochar have since contributed extensively further data on the properties of the standard biochar and their performance in different applications [23–30]. To define these materials, the pyrolysis process used for the production has been studied in detail. This effort also enabled in-depth study of the variability of biochar properties because of changes in feedstock or process conditions.
It is well known that variations in feedstock composition, material flow rate, or in process conditions, such as HTT, lead to changes in product properties [2,31]. Therefore, biochar quality is strongly dependant on the type of pyrolysis unit, scale and its degree of control [6,32–34]. Consistency in biochar properties should presumably be embedded in the specification of bespoke, designed or engineered biochar [35–43]. Parts of the variability of biochar performance in plant trials might be attributed to variability of biochar properties related to production. To our knowledge, however, there has been no specific study of variability between repeated production runs using a range of feedstocks and at different scales. In describing a set of standard materials already in use, our study sets a benchmark for the achievable level of consistency in biochar made from various granular feedstocks and across a range of research scales and carefully configured equipment. Through characterisation, the wider aim is to increase the cross-interpretation of future experimental works by offering a structured set of standard materials. The objectives were to assess in a comprehensive way variability in properties of biochar across a range of parameters that are relevant to its production in the field: 1) from the same pyrolysis unit but different production batches; 2) from diverse types of units; and 3) at different scales.
2 Materials and Methods 2.1 Biomass feedstocks Five types of feedstock were selected to produce Standard Biochar (details on a sixth feedstock, sewage sludge, and resulting biochar can be found in the Supplementary Information). The feedstocks were selected to represent all major terrestrial biomass types and to cover as wide a range of physico-chemical properties as practically possible. Apart from rice husk which was imported from Sri Lanka, all the biomass was sourced from UK suppliers in spring 2013 (see Table 1). To minimise the differences in physical form, and thus remove this parameter from the already complex picture, pelleted biomass was used as feedstock for Standard Biochar. A positive side effect of this choice was improved handling and processing throughput, due to the uniform shape of pellets and their higher density. The only feedstock used in its raw form was rice husk, due to its already uniform particle size distribution. Characteristics of the five feedstocks are summarised in Table 1 Table 1 – Proximate analysis results of feedstocks for Standard Biochar production. Mean values and standard deviations for five replicate analyses are provided. Moisture
Volatile Matter
Fixed C
Ash
(wt%)
(wt%)
(wt%)
(wt%)
Puffin Pellets
6.71 ± 0.03
77.92 ± 0.44
14.22 ± 0.38
1.07 ± 0.12
Wheat straw (WSP)
Agripellets
7.22 ± 0.22
70.12 ± 0.55
15.29 ± 1.08
6.44 ± 0.28
Miscanthus straw (MSP)
Agripellets
5.79 ± 0.13
72.88 ± 0.86
15.94 ± 0.40
5.10 ± 1.01
Agripellets
7.98 ± 0.14
70.18 ± 0.20
15.53 ± 0.28
6.42 ± 0.15
Sri Lanka
6.97 ± 0.16
59.14 ± 3.27
14.84 ± 0.82
17.25 ± 4.51
Feedstock
Source
Softwood pellets (SWP)
Oilseed rape straw (OSR) Rice husk (RH)
2.2 Biochar All feedstocks were pyrolysed at the HTT of 550°C and 700°C in three pyrolysis units of different scale and design, labelled Stage I, Stage II and Stage III, which are described below in sections 2.3 – 2.5. The conditions in all three units were set to ensure production conditions (thermal history) that were as comparable as possible. In the Stage I and Stage III units, multiple runs with the same feedstocks were performed resulting in different batches of biochar (only SWP and WSP feedstocks were processed in Stage I). All batches/runs analysed in this study are shown in Table 2, and production conditions are shown in Table 3.
Table 2 - Number of runs/batches analysed per biochar type and pyrolysis unit. (TGA - thermogravimetric analysis).
550°C
700°C
TGA Stage III Stage II Stage I TGA Stage III Stage II Stage I MSP
4
4
1
4
2
1
OSR
4
8
1
4
6
1
RH
4
11
1
4
7
1
WSP
4
8
1
4
4
5
1
4
SWP
4
11
1
5
4
9
1
5
2.3 Stage III (Pilot-scale) pyrolysis unit 2.3.1
General operation
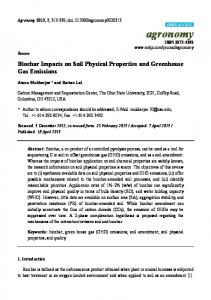
The UKBRC Stage III Pyrolysis Unit (rotary kiln pyrolyser) as shown in Figure 1 was used to produce the UKBRC Standard Biochar set. The unit comprises a variable speed screw-feeder with attached hopper, a sealed rotating drum (inner diameter 0.244 m, heated length 2.8 m) heated by a set of electric heaters arranged in three heater banks of 16.67 kW each, a char
handling screw conveyor, a collection vessel, and an afterburner chamber. The unit can operate at temperatures of up to 850°C, and achieve mean residence times of solids between few minutes to over 40 minutes. A typical operation of the kiln consists of initial purge of the whole equipment with nitrogen, while heating to the operating temperature. This is followed by introduction of biomass into the reactor at a pre-set rate by a horizontal screw feeder. Biomass then moves along the length of the reactor, gradually undergoing drying (moisture release), devolatilisation, and charring. The residence time of material in the heated zone can be controlled by adjusting the speed of the kiln rotation and feeding rate. At the end of the rotary drum, biochar is separated from gases and vapours in an insulated discharge chamber, and transported by a screw conveyor into a sealed metal drum filled with nitrogen. The screw conveyor, with its water jacket through which cooling water was circulated, also acts as a heat exchanger, reducing the biochar temperature to well below 100°C, without directly contacting it with water. As a result, the produced biochar is dry and due to nitrogen blanketing, free of influence from air and air moisture. Gases and vapours separated in the discharge chamber are led through a heated tube into an afterburner chamber where they are combusted. Table 3 provides detailed information on the operating conditions used for all ten Standard Biochar materials. The production process for Standard Biochar was optimised to achieve the highest reproducibility and consistency possible. The operation was started by purging the whole unit with nitrogen for 20-30 minutes, while the electric heaters brought the unit to the pre-set operating temperature. When the reactor temperature was close to the desired temperature, biomass was introduced at a pre-set rate (see Table 3). The reactor was allowed to reach a steady state with biomass flowing through, then a further 30 minutes was allowed for the material to flow through the kiln and screw conveyor. After this time, an empty collection drum (purged with N2) was fitted, and the target biochar started to be collected. The biochar
produced before steady state operation was reached was not included in the Standard Biochar set.
Figure 1- Rotary kiln pilot-scale pyrolysis unit (Stage III) at the UKBRC, University of Edinburgh (source: Ansac Ltd.).
2.3.2
Heating, temperature control and monitoring
The Stage III unit at UKBRC is equipped with an advanced system for monitoring and control of process temperatures. This allows careful adjustments of the reactor temperatures and monitoring of temperatures of the reactor, as well as material within the reactor. Heating is provided by three independent heater banks with length of approx. 0.9 m each, distributed on one side, along the length of the kiln. The control of the heaters is achieved using a PID controller for each bank, with input provided by thermocouples (T1a, T3a, and T5a in Figure 2) situated in the centre of each heating zone (lengthwise) at the top of the kiln, i.e. 90° against the kiln rotation from the position of the heater banks. Besides these control thermocouples, there are a further two thermocouples (T2a and T4a) situated between the heating zones for additional monitoring of the reactor wall temperature.
Figure 2 - Position of thermocouples: external (T1a-5a), kiln centreline (T1b-T5b) and kiln bed depth (T1c-T5c) [44].
To obtain data on temperature of the solids and gases within the reactor, we developed a specially designed system for inserting thermocouples into the rotary kiln. As a thermocouple system accessing the internal volume through the wall of the rotating drum would be very complex, access through the hollow shafts of the screw feeder and the rotary kiln was used. Eight thermocouples were inserted into various parts of the kiln, four from each end, as shown in Figure 2. The thermocouples were supported, and held in place by a stainless-steel cable, stretched through the axis of the kiln. To compensate for thermal expansion and prevent sagging of the wire and thermocouples, a counter weight continuously tensioned the wire. This array of thermocouples was distributed along the length of the kiln in such a way that temperatures of both the solids and gases could be continuously monitored. This proved critical when assessing the operating conditions under which different Standard Biochar were produced. The longitudinal positions of these thermocouples were selected to match those of the external thermocouples measuring the reactor wall temperatures (T1a – T5a), allowing the temperature profile inside the reactor to be established and compared to the reactor wall temperature profile. 2.3.3
Particle residence time distribution
In pyrolysis systems, the residence time of particles in the heated section of the reactor, and at the peak temperature, determines the particle temperature history; this is one of the most
important parameters controlling the product yield and distribution (solid/gas ratio), and in the case of biochar, its properties [4,5,45]. Experimental determination of residence time distribution of biomass particles undergoing pyrolysis in a rotary kiln is not straightforward. Therefore, several approximations were adopted in this work. Firstly, preliminary tests in a model rotary drum at room temperature suggested that there were only slight differences in flow rate through the unit between the raw biomass (pellets) and the charred pellets (which had kept their cylindrical shape). This assumption allowed the use of wood pellets of three colours (natural + two painted in blue and red colours) to study the residence time distribution, while running the rotary kiln at room temperature. To do this, a small amount (approx. 500 g) of each colour of wood pellets was fed in sequence directly into the screw feeder, and the time at which these exited the rotary kiln was observed. Pellets were collected every 30 seconds directly from the exit of the rotary drum, to avoid any mixing in the char outlet screw conveyor. Collected pellets were then spread onto a black tray forming a monolayer, avoiding individual particles covering each other, and photographed (Nikon D7000). Acquired images were analysed using image-processing software (ImageJ, National Institutes of Health), and the areas (numbers of pixels) corresponding to each of the three pellet colours used were determined. This provided information on how many pellets of which colour were collected in each of the 30s intervals. From this information it was possible to reconstruct a typical residence time distribution curve and derive mean residence times. Given the comparable size and density of pellets for all the feedstock used, with the exception of rice husk, the residence time distribution for all four pelleted feedstocks was assumed to be the same, which is considered a sufficient first approximation. 2.3.4
Biochar sampling
Representative sampling is critical in any research and analytical work, and even more so when developing standard materials [46]. To obtain representative samples from a large
number of runs, with each run typically producing a full drum worth of biochar (150-200 L), a sampling protocol was established and followed throughout the project. The objectives of the protocol were to eliminate bias during sampling, to take samples representative of the whole run of biochar for analysis, and to allow run-to-run comparison of biochar composition. The sampling method was designed to collect biochar samples to determine the average value of parameters that characterise the biochar. Sampling from a 205 L drum was carried out using a stainless steel 600 mm long concentric tube slot sampler. This type of sampler is suitable for collecting large volume cross sectional samples from free-flowing granular solids in drums. The sampler used has three sampling slots that are integrated along the length of the inner section. These are exposed after the sampler is inserted into the solid by rotating the inner section. Using this approach, a depth profile composite sample of the biochar is collected from the drum. The sampling process is repeated until five or more composite sample increments have been collected and combined in a 500 mL glass jar. Secondary sub-sampling from the combined sample for analysis is then carried out as required. A schematic illustrating the sampling method is shown in Figure 3.
Figure 3 - Sampling from biochar drums using a concentric tube slot sample (source of image on the left: www.samplingsystems.com).
2.4 Laboratory auger pyrolysis unit The Stage II pyrolysis unit is a continuous-screw pyrolysis unit (auger reactor) which uses an electrically heated split-tube furnace with an inner diameter of 100 mm. After an initial nitrogen purge of the unit (through feed hopper, start of screw reactor and discharge shoot) using a combined flow of 20 L min-1, flowrates are reduced to a carrier purge of 1 L min-1 and a purge supplying nitrogen to the char vessel at 4 L min-1. The feed hopper transports the feedstock (typical feeding rate 500 g h-1) to a rotary valve where it drops onto the furnace screw. The screw transports the material through two heated areas with a combined length of around 0.75 m. The discharge chamber, which separates pyrolysis vapours and solids (biochar), was actively heated up with heating elements set to 500°C and 400°C, respectively. A third heating element (heating tape) set to 400°C heated the pipes that connect the discharge chamber with the afterburner, where the pyrolysis vapours are combusted using a propane burner. At various parts of the pyrolysis unit, pressure and temperature were measured. Figure 4 shows a schematic of the unit and more details on the unit can be found in Buss et al., (2016b) [3]. The ten biochar produced in the auger reactor used the same residence times and HTT as for the Stage III pyrolysis unit described above.
Figure 4 - Auger reactor (Stage II) at the UKBRC, University of Edinburgh [3].
2.5 Laboratory batch pyrolysis unit The Stage I pyrolysis unit is a small-scale, batch pyrolysis reactor with a vertical quartz tube (inner diameter 50 mm) which has a sample bed depth of around 200 mm and is heated up by a 12 kW infra-red gold image furnace (P610C; ULVACRIKO, Yokohama, Japan). A condensation system was assembled to collect different fractions of condensable gases in cold traps, while non-condensable gases were collected in a gas bag for further analysis. More details about the pyrolysis unit set-up and use can be found elsewhere [31] and a schematic is shown in Figure 5. In the Stage I unit, the pyrolysis parameters (HTT, heating rate and RT at HTT) were setup in such a way as to replicate the conditions experienced by WSP and SWP biomass particles in the Stage III unit, see Table 3. These parameters were determined based on in-depth investigations of the temperature profiles and residence times of the feedstock particles in the Stage III rotary kiln unit.
Figure 5 – Stage I pyrolysis reactor (batch) and pyrolysis vapour condensation system [31].
2.6 Micro-pyrolysis via thermogravimetric analysis (TGA) A thermogravimetric analyser (Mettler-Toledo TGA/DSC1) was used to replicate biochar produced in the Stage III unit (as described in section 2.3). For this approx. 15 mg of finely ground feedstock was placed in 70 µl alumina crucibles and subjected to pyrolysis conditions using the pyrolysis parameters (HTT, heating rate and RT at HTT) as shown in Table 3. Pyrolysis was carried out under nitrogen with a purge gas flow rate of 150 mL min-1. The TGA, possessing the highest degree of control of all the pyrolysis units utilised in this study, was used for comparison of biochar yield and volatile matter content (VMC) with the lab/pilot-scale pyrolysis units to establish readily reproducible baseline values.
2.7 Biochar/feedstock analysis Biochar samples collected as described in section 2.3.4 from the drums produced by the Stage III unit and corresponding representative sampling of the smaller containers of biochar
produced in Stage I and II units were sub-sampled and then crushed to a homogenous fine powder using pestle and mortar. Proximate analysis (fixed carbon content, VMC, and ash) was then used to confirm material consistency within runs (one production batch), between runs (multiple batches) and among different pyrolysis units. This measure was selected based on the fact that it has been shown to correlate with important biochar properties [47], such as stability [7,31], phytotoxicity [48,49] or degree of conversion [45]. Proximate analysis of all biochar samples and corresponding feedstock was carried out in a thermogravimetric analyser (Mettler-Toledo TGA/DSC1). For this analysis, samples in 70 µl alumina crucibles (approx. 15 mg) were first heated to 105°C under flow of N2 at 25°C min-1 to determine the moisture content; the temperature was then raised at a rate of 25°C min-1 to 900°C where it was kept for 10 min to eliminate volatile matter. Following this period, the gas supply was switched from nitrogen to air, to determine the ash content by combusting the sample for 20 min at 900°C. Fixed carbon content and VMC are given on a dry, ash-free basis, in wt% of the original mass of the dry sample. A quality control sample was analysed with every batch of biochar (~20-30 biochar at a time).
2.8 Statistics Statistical analysis was performed with R (Version 1.0.143, www.r-project.org) and Sigma plot (Version 13.0, Systat Software Inc.) using a statistical significance level of 0.05. Before performing one-way ANOVAs all data were tested for normality. For comparing the variability within-batch and the between-batch variability of the Stage I biochar, a Levene-test was performed with the batches as individual groups (comparison of variances). Additionally, one-way ANOVAs were performed on all batches of each biochar to determine potential difference in the mean of the VMC, followed by Tukey’s post-hoc
tests in case of WSP 700. For the within-run and between-run variability of the biochar produced with the Stage III unit, a Levene test was performed. To compare the influence of pyrolysis and the influence of the two pyrolysis temperatures on the variability of the VMC, again a Levene-test was performed either with “pyrolysis” as one category, taking both temperature biochar together or taking the two temperatures individually. Finally, One-way ANOVAs were performed to determine differences in VMC between the different pyrolysis units which was followed by a Tukey’s post-hoc test (suitable for unequal sample sizes). For data presented in the SI, equal variance, two-sided t-tests were performed.
3 Results and Discussion As the aim of the standard biochar development work was to obtain materials with narrow ranges of specifications, produced under reproducible conditions, the variability in biochar quality was of paramount interest. The key parameters influencing consistency of biochar quality parameters both within a single production batch and among batches are: thermal history of biomass and biochar particles in a pyrolysis unit, the design/type of pyrolysis unit, and uniformity and consistency of feedstock properties. The effects of these parameters on biochar yield and quality parameters are discussed in this section.
3.1 Reactor temperature profiles and biochar temperature history in the rotary kiln pyrolysis unit The thermal history of biomass/ biochar in the pilot-scale Stage III reactor, where >2 t of UKBRC Standard Biochar were produced, was of key importance, and therefore one of the focus points of this study. This parameter is significantly under-reported in the literature, due to the difficulty in obtaining necessary data. The temperature profiles measured for the reactor wall as well as the solids and gases inside the rotary kiln are presented in Figure 6. These show gradual increase in temperature of the material as it travels through the kiln. It can be seen that the profiles vary for naturally granular rice husk relative to pelleted materials, reflecting the different physical and chemical properties, affecting heat transfer and decomposition dynamics. A low between-run variation associated with these temperature profiles during steady state operation is a critical parameter for minimising variability in the degree of conversion of the char produced over the duration of a production run. Data extracted from the temperature profiles, and associated production parameters for the Standard Biochar are shown in Table 3. From the data, it can be seen that the reactor wall temperature was identical to the set point temperature, confirming a high degree of control of the reactor temperature. The table also shows the extent to which the mean maximum
temperature of the char bed moving in the reactor differed from the reactor wall temperatures. Although the differences between the reactor wall and measured char bed temperatures were relatively small (