(such as doorbell ringing, laughing, or dog barks) can be a daunting task. The generalized audio classification technique thus plays an important role.
Content-Based Audio Classification Using Support Vector Machines and Independent Component Analysis Jia-Ching Wang, Jhing-Fa Wang, Cai-Bei Lin, Kun-Ting Jian, and Wai-He Kuok Department of Electrical Engineering, National Cheng Kung University 1 University Road, Tainan, Taiwan, R.O.C. Tel: 886-6-2757575 ext. 62341 Fax: 886-6-2080478 classifier name nearest feature line (NFL) for audio classification was also presented and produced better results than the NN-based and other conventional methods. This study was improved by the author’s later work [5]. With the same feature set as [3], Guo and Li used support vector machines (SVMs) with a binary tree structure to tackle the audio classification problem. Experimental results showed that the SVM approach with perceptual and cepstral feature sets achieved lower error rate than Music Fish system and NFL approach. This SVM classifier was also adopted by Lin et al. [6] for audio classification. With similar feature set as that of [5], Lin et al. applied wavelet to extract subband power and pitch information. Also, the MFCCs are replaced by frequency cepstral coefficients.
ABSTRACT In this paper, we present a new audio classification system. First, a frame-based multiclass support vector machine (SVM) for audio classification is proposed. The accuracy rate has significant improvements over conventional filebased SVM audio classifier. In feature selection, this study transforms the log powers of the critical-band filters based on independent component analysis (ICA). This new audio feature is combined with melfrequency cepstral coefficients (MFCCs) and five perceptual features to form an audio feature set. The superiority of the proposed system has been demonstrated via a 15-class sound database with a 91.7% accuracy rate. 1. INTRODUCTION The rapid increase in speed and capacity of computers has allowed the inclusion of audio as a type of data in many modern computer applications. Users accustomed to searching, scanning and retrieving text data can be frustrated by the inability to look inside the audio objects. Multimedia databases or file systems, for example, can easily have thousands of audio recordings. Such libraries are often poorly indexed or named to begin with. Searching for a particular audio file or class of audio (such as doorbell ringing, laughing, or dog barks) can be a daunting task. The generalized audio classification technique thus plays an important role in multimedia content retrieval. Comparing with speech recognition, a closely related area, research on audio classification is relatively new. Wold et al. [4] presented an audio retrieval system named Music Fish based on audio classification. This work is a milestone about audio retrieval because of the content based analysis which distinguishes it from previous works. In this system, pitch, harmonicity, loudness, brightness and bandwidth were used as the audio features. The nearest neighbor (NN) rule was adopted to classify the query audio into one the defined audio classes. Foote [1] proposed the use of mel-frequency cepstral coefficients (MFCCs) plus energy as audio features. The classification procedure was also done by the NN rule. Pfeiffer et al. [2] adopted a filter bank consisting of 256 phase-compensated gamma phone filters proposed to extract audio features. More recently, Li [3] concatenated the perceptual and cepstral feature sets for audio classification. A new
Training Input Audio
Framing
Feature Set Extraction
Frame-Based Multiclass SVM
Audio Database
Classification
Mel-Frequency ICA-Based Feature Mel-Frequency Cepstral Coefficients Perceptual Features
Classified Audio Class
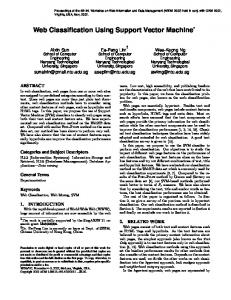
Fig. 1. Block diagram of the proposed audio classification system.
In the works of [4-6], the means and standard deviations of all individual features in an audio file were computed over the nonsilent frames to form a feature vector of an audio file. In this paper, we present a frame-based audio feature set and a framebased multiclass SVM for audio classification. The block diagram of the proposed system is depicted in Fig. 1. In accordance with our experiments, the presented frame-based strategy significantly outperforms the file-based approaches adopted by [5], [6]. In the feature selection, besides total spectrum power, subband powers, brightness, bandwith, pitch and MFCCs, a new audio feature based on independent component analysis (ICA) is also presented. For computing MFCCs, the log powers of the critical-band filters are obtained first. Discrete cosine transform (DCT) is then applied to the log powers to remove some of their correlations. Instead of DCT, ICA transform is applied to the log powers to generate a new audio feature, mel-frequency ICAbased feature. The prominence of the proposed audio feature is the theoretical maximization of the
1 0-7695-2521-0/06/$20.00 (c) 2006 IEEE
statistical independence among all the critical-band log powers.
2.2. Mel-Frequency ICA-Based Feature In section 2.1, the log powers of the criticalband filters are transformed by DCT to remove some of their correlations. This study proposes an audio new feature, mel-frequency ICA-based feature, transforming the log powers of the critical-band filters by ICA to achieve the theoretical maximization of the statistical independence among them. First, all the log powers are centralized to make its mean zero. As there are M log powers, the number of independent components is also chosen as M in this study. The following steps are to find the ICA transformation bases.
2. FEATURE EXTRACTION In this paper, three types of features are computed from each frame: mel-frequency cepstral coefficients, mel-frequency ICA-based feature, and perceptual features. 2.1. Mel-Frequency Cepstral Coefficients Mel-frequency cepstral coefficients are nonparametric representations of audio signal, which models the human auditory perception system. The term “mel” is a unit of measurement of the perceived frequency or pitch of a tone. The mapping between the frequency scale (Hz) and the perceived frequency scale (mels) is approximately linear below 1 kHz and logarithmic at higher frequencies. The suggested formula that approximates this relationship is as follows F · § (1) Fmel 2595 log 10 ¨1 � Hz ¸ , © 700 ¹
(i) Whiten the centralized log powers to give a vector s for each frame. (ii) Set transformation basis counter i as one. (iii) Randomly initialize transformation basis wi. (iv) Let g () tanh() and compute undeflated wi by (4) w i E >sg ( w iT s )@� E[ g ' ( w iT s )]w i . (v) Do the following orthogonalization: i �1
wi
where Fmel is the perceived frequency in mels and
(5)
j 1
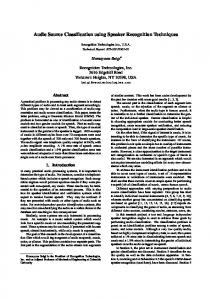
FHz is the frequency in Hz. The critical-band filters in the frequency domain (Hz) are illustrated in Fig. 2. In the mel-frequency domain, the bandwidth and the spacing of these critical-band filters are invariable values, 300 mels and 150 mels, respectively.
(vi) Normalize wi by wi . wi wi
(6)
(vii) If wi has not converged, go back to step (iv). (viii) Increase the counter i by 1. If i < M, go back to step (iii). With the obtained ICA transformation bases wi, i = 1 ,�, M, the M-dimensional mel-frequency ICAbased feature is computed by
ˠ˴˺́˼̇̈˷˸ʳ̆̃˸˶̇̅˴ʳ̂˹ ˶̅˼̇˼˶˴˿ʳ˵˴́˷ʳ˹˼˿̇˸̅̆
˄
M
f ICA
¦ log�S[k ] w
k
.
(7)
k 1
˄
˃
ˆ
˅
ˇ
2.3. Perceptual Feature The perceptual features including total spectrum power, subband powers, brightness, bandwith and pitch are derived as follows. (a) Total spectrum power. Denote f0 as the half sampling frequency. The total spectrum power is computed by
ˇˁˉ
˙˥˘ˤ˨˘ˡ˖ˬʳʻ˾˛̍ʼ
Fig. 2. Critical-band filters in the frequency domain.
The derivation of MFCCs is based on the powers of the theses critical-band filters. Let X(m) denote the power spectrum of an audio stream, S[k] denote the power in k-th critical band and M represent the number of the critical bands in mel scale, ranging usually from 20 to 24. Then F / 2 �1
S[k ]
¦W
k
( j) X ( j) ,
k = 1 ,�, M,
f0
2
P log(³ F ( f ) df ) .
(8)
0
(b) Subband powers. The subband powers are extracted from the following subband intervals: [0,0.125 f 0 ] , [0.125 f 0 ,0.25 f 0 ] , [0.25 f 0 ,0.5 f 0 ] and [0.5 f 0 , f 0 ] . The i-th subband power is computed by
(2)
j 0
where Wk is the critical-band filter. Let L denote the desired order of the MFCC. Then we can find the MFCCs from logarithm and cosine transforms as follows M nS º n = 1 ,� , L. (3) ª C[ n ]
w i � ¦ (w Ti w j )w j .
Pi
log(³
H (i )
Li ( i )
2
F ( f ) df ) ,
(9)
where H(i) and L(i) are the upper and lower bounds of the i-th subband. (c) Brightness. The brightness is the gravity center of the power spectrum. It describes whether the power spectrum is dominated by low or high frequencies.
¦ log�S[k ] cos «¬�k � 0.5 M »¼ , k 1
2 0-7695-2521-0/06/$20.00 (c) 2006 IEEE
Denote pi as the power associated with frequency fi, the brightness is calculated as: FC
³
f0
f i pi df
0
³
f0
0
pi df .
3.2. Proposed Frame-Based Multiclass SVM for Audio Classification Conventional, each training and testing audio files merely generates one feature vector to train or test the SVMs [5], [6]. The means and standard deviations of the feature trajectories over all the nonsilent frames are computed, and these statistics are considered as feature sets to represent an audio file. This study proposes a new audio classifier using frame-based multiclass SVM. For an audio file, the waveform is segmented into separate frames. Passing through the procedure of feature extraction, each frame will be transformed into a feature vector. Assume a NF -frame audio file, x(j), j = 1, …, NF , is to be classified into class Cm, m {1,2,�, M } . The steps for audio classification based on frame-based multiclass SVM follows. (i) For each class Cm, and for all the classes Cn (n z m), we compute
(10)
(d) Bandwidth. The bandwidth is the second moment of the power spectrum. It describes whether the shape of the power spectrum is concentrated in the vicinity of its centroid or spread out over the spectrum. FB
³
f0
0
( f i � FC ) 2 pi df
³
f0
0
pi df .
(11)
(e) Pitch. A simple pitch detection algorithm, based on detecting the peak of the normalized autocorrelation function, is used. The pitch frequency is returned if the peak value is above a threshold, or the frame is labeled as nonpitched otherwise. 3. CLASSIFIER DESIGN 3.1. Support Vector Machine The SVM theory is a new statistical technique and has drawn much attention on this topic in recent years. An SVM is a binary classifier that makes its decisions by constructing an optimal hyperplane that separates the two classes with the largest margin. It is based on the idea of structural risk minimization (SRM) induction principle [7] that aims at minimizing a bound on the generalization error, rather than minimizing the mean square error. For the optimal hyperplane w x � b 0 , w R N and b R , the decision function of classifying a unknown point x is defined as: NS
f ( x)
sign (wx � b)
sign (¦ D i mi x i x) ,
scoreH (Cm,n x ( j ) ) NF
¦ H �wx
( j)
j 1
NF
,
�
� b � ¦ H � (wx
( j)
� b)
(15)
j 1
by the Cm-Cn 2-calss SVM. In (15), H � is Heaviside step function. (ii) The accumulated score for each class Cm is computed by score(Cm x( j ) )
¦ score(C
m, n
x( j ) ) .
(16)
n
(iii) Finally, the most possible class Cm* is chosen by (17) m* arg max score(Cm x ( j ) ) .
(12)
m
i 1
4. EXPERIMENTAL RESULTS
where NS is the support vector number, xi is the support vector, D i is the Lagrange multiplier and mi {�1,�1} describes which class x belongs to. In most cases, searching suitable hyperplane in input space is too restrictive to be of practical use. The solution to this situation is mapping the input space into a higher dimension feature space and searching the optimal hyperplane in this feature space. Let z M (x) denote the corresponding feature space vector with a mapping M from R N to a feature space Z. It is not necessary to know about M . We just provide a function K (,) called kernel which uses the points in input space to compute the dot product in feature space Z, that is (13) z i z j M (x i ) M (x j ) K (x i , x j ) .
An audio database consists of 15 classes is used for our experiments. The names of these audio classes are male speech (50), female speech (50), cough (50), laughing (49), screaming (26), dog barking (50), cat mewing (45), frog wailing (50), piano (40), glass breaking (34), gun shooting (33), knocking (50) motorcycle (50), cough (50) and telephone (50). The number describes how many files in each class. There are totally 677 sound files in this database. The sampling rate is 16 kHz and each sample is 16 bits. For each audio class, half of the audio files are utilized for training and the others are used for testing. The frame size is 512 samples (32 ms), with 50% overlap in each of the two adjacent frames. It is marked as a silent frame if the frame energy smaller than an empirical threshold. Then audio features are extracted from each nonsilent frame. For assessing the audio classification results, the accuracy rate, which is defined as the ratio between correct-classified file number and the total testing file number is used. The radial basis kernel
Finally, the decision function becomes NS
f ( x)
sign (¦ D i mi Ȁ (x i , x) � b) .
(14)
i 1
Functions that satisfy Mercer's theorem can be used as kernels. Typical kernel functions include linear kernel, polynomial, radial basis kernel, etc.
3 0-7695-2521-0/06/$20.00 (c) 2006 IEEE
machines,” IEEE Transactions on Neural Networks, vol. 14, no. 1, pp. 209-215, Jan. 2003. [6] C. C. Lin, S. H. Chen, T. K. Truong, and Y. Chang, “Audio classification and categorization based on wavelets and support vector machine,” IEEE Transactions on Speech and Audio Processing, vol. 13, no. 5, pp. 644-651, Sept. 2005. [7] V. Vapnik, Statistical Learning Theory, New York: Wiley, 1998.
2
exp( �J x � y ) with J 1 is adopted for all the experiments. The parameter C that determines the trade-off between margin maximization and training error minimization is set as one. Our experimental results are listed in Table I, II, and III. These experiments addresses both on audio classifier comparison and audio feature set comparison. For the audio feature comparison, classification results of Guo’s [5] feature set and Lin’s [6] feature sets are presented in Tables I and II, respectively. The classification results of the proposed feature set are given in Table III. For each feature set, both the conventional file-based SVM classifier and the proposed frame-based SVM classifier were used. The performance of the proposed frame-based multiclass SVM is quite good. The accuracy rate improvements for the three feature sets are 11.6%, 17.2% and 13.1%, respectively. As for the proposed feature set, its performance apparently outperforms Lin’s feature set. Comparing with Guo’s feature set, although their accuracy rates in file-based SVM classifier are almost the same, the proposed feature set has 1.2% accuracy rate improvement in the frame-based multiclass SVM. K ( x, y )
Table I. Classification Result with Guo’s Feature Set Feature and classifier hit/miss cat cough dog doorbell female frog glass gun knock laugh male motorcycle piano scream telephone Accuracy rate
Guo’s feature set and classifier [5] hit miss 20 3 16 9 20 5 15 1 22 3 23 2 14 3 6 11 22 3 11 14 21 4 21 0 20 5 8 5 24 1 78.9%
Guo’s feature set with our classifier hit Miss 19 4 15 10 24 1 16 0 25 0 22 3 16 1 15 2 23 2 25 0 25 0 20 1 17 3 13 0 21 4 90.5%
Table II. Classification Result with Lin’s Feature Set
5. CONCLUSIONS
Feature and classifier hit/miss cat cough dog doorbell female frog glass gun knock laugh male motorcycle piano scream telephone Accuracy rate
This study has presented an audio classification system based on frame-based multiclass SVM. Compared with conventional file-based SVM classifier, the proposed audio classifier has considerable improvement averagely 13.9%. This study also presents a new feature set including melfrequency ICA-based feature, MFCCs and perceptual features. With the proposed audio classifier and feature set, the accuracy rate can achieve 91.7%. Future works include the expansion of audio classes and the study of audio segmentation which is a preprocess for audio classification in many related applications.
Lin’s feature set and classifier [6] hit miss 8 15 25 0 17 8 10 6 19 6 10 15 1 16 2 15 17 8 19 6 18 7 8 13 5 15 0 13 5 20 50.1%
Lin’s feature set with our classifier hit miss 18 5 13 12 22 3 12 4 25 0 11 14 10 7 6 11 21 4 25 0 25 0 18 3 8 12 0 13 6 19 67.3%
Table III. Classification Result with Proposed Feature Set
REFERENCES
Feature and classifier hit/miss cat cough dog doorbell female frog glass gun knock laugh male motorcycle piano scream telephone Accuracy rate
[1] T. Foote, “Content-based retrieval of music and audio,” Multimedia Storage and Archiving Systems II, Proc. of SPIE, vol. 3229, pp. 138–147, 1997. [2] S. Pfeiffer, S. Fischer, and W. E. Elsberg, “Automatic Audio Content Analysis,” Tech. Rep. 96-008, Univ. Mannheim, Mannheim, Germany, Apr. 1996. [3] S. Z. Li, “Content-based audio classification and retrieval using the nearest feature line method”, IEEE Transactions on Speech and Audio Processing, vol. 8, no. 5, pp. 619-625 Sept. 2000. [4] E. Wold, T. Blum, D. Keislar, and J. Wheaton, “Content-based classification search and retrieval of audio,” IEEE Multimedia Magazine, vol. 3, pp. 27–36, July 1996. [5] G. Guo and S. Z. Li, “Content-based audio classification and retrieval by support vector
Proposed feature set with Guo’s and Lin’s classifier hit miss 20 3 11 11 20 5 15 1 21 4 23 2 15 2 8 9 22 3 9 16 22 3 21 0 15 5 8 5 24 1 78.6%
4 0-7695-2521-0/06/$20.00 (c) 2006 IEEE
Proposed feature set with our classifier hit miss 19 4 18 7 24 1 16 0 25 0 23 2 16 1 16 1 23 2 25 0 25 0 21 0 17 3 12 1 20 5 91.7%