International Journal of Fuzzy Systems, Vol. 6, No. 3, September 2004
160
Content-Based Retrieval of Surface Defect Images with PicSOM Jukka Iivarinen, Rami Rautkorpi, Jussi Pakkanen, and Juhani Rauhamaa Abstract In this paper a content-based image retrieval (CBIR) system called PicSOM is applied to a defect image database containing 2004 images from a real web inspection system. The main features of PicSOM are efficient indexing based on self-organizing maps and adaptive querying using relevance feedback. Six feature descriptors from the MPEG-7 standard and an additional shape descriptor developed for surface defect images are used in the experiments. The classification performance of the descriptors is evaluated using K-Nearest Neighbor (KNN) leaveone-out cross-validation and PicSOM’s built-in CBIR analysis system. The KNN results show good performance from three MPEG-7 descriptors and our shape descriptor. The CBIR results using these descriptors show that PicSOM’s SOM-based indexing engine together with its relevance feedback mechanism yields efficient and accurate retrieval of similar defect images from our database. Keywords: content-based image retrieval, self-organizing maps, surface defects, PicSOM, MPEG-7
1. Introduction The development of technology required to produce high quality digital images and the increasing capacity of digital data storage devices have made possible the creation of large digital image databases. This in turn has necessitated the development of a system to efficiently manage and search such databases. Traditional text-based search methods can be also applied to image databases if the images in a database have been annotated by a human with keywords describing the content and nature of the images. However, this approach becomes unpractical as the size of the database increases. Also the annotations are subjective judgments by the annotator, which means that if several people are involved in annotating a single database, the annotations, and thus any search results, may be inconsistent, and thus the annotations may not Corresponding author: J. Iivarinen is with the Helsinki University of Technology, Laboratory of Computer and Information Science P.O. Box 5400, FIN-02015 HUT, Finland E-mail:
[email protected] Manuscript received 22 Jun. 2003; revised 15 Feb. 2004; Accepted 31 Jul. 2004
reflect the needs of a particular end user of the database. A more efficient approach is content-based image retrieval (CBIR), where low level visual features are automatically extracted from images, stored and indexed in order to speed up searching [14, 1, 12]. One of the first and maybe still the best-known CBIR systems is QBIC (Query by Image Content) [2] but lots of different CBIR systems have been introduced during the last decade [12]. The problem is to develop descriptors that capture the essential features of an image, and a system that makes it possible to match these features with the semantic concepts of content and significance that a human user sees in images. One way to implement such capabilities in a system is the use of relevance feedback provided by the user, enabling the system to refine the search criteria according to the user’s preferences. Web surface inspection systems produce large quantities of defect image data, and the classification of such defect images is a significant challenge for CBIR systems. Manual checking of all these defect images is too time-consuming, so some automatic tool is required. In this paper we propose to use PicSOM [8, 9], a SOMbased CBIR system, to handle this task. In our previous work we have been dealing with defect images from a paper web inspection system [3, 13] but in this paper we deal with a new kind of defect images, namely metal defect images. So, experiments are conducted with a defect image database containing 2004 images from a metal web inspection system. Six feature descriptors from the MPEG-7 standard [11] and the additional shape descriptor developed for surface defect images [5] are first evaluated with a simple K-Nearest Neighbor (KNN) classifier. The best features are then implemented in PicSOM, and finally the retrieval performance of PicSOM is evaluated with these defect images.
2. Metal Surface Inspection Producers of metal sheet materials utilize various methods to control the quality of their products. Traditionally, the surface quality has been watched by human inspectors. Although these professionals have superior skills to find and classify deviations of surface quality, increasing speed of processing lines would have made their work difficult or impossible without development of new tools, i.e. machine vision based inspection systems. Metal sheet surface imperfections
© 2004 TFSA
J. Iivarinen et al.: Content-Based Retrieval of Surface Defect Images with PicSOM
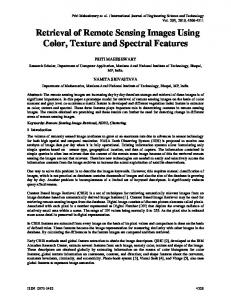
are very varying from faint and small pimples to large area discoloration. Detection and classification of many of these defects was not possible until camera-based systems became available. These systems take images of defects with hundreds of shades of gray, which makes it possible to classify very similar looking defects into correct classes. The speed, consistency, and certain analysis capabilities of machine vision compensate for its weaknesses when compared to the capabilities of human eye and brain. The combination of these two provides advantages which are making automatic inspection systems a common place in metal strip manufacturing plants. Figure 1 represents a surface inspection system installed on a strip handling line. In the figure, two camera beams and a light source beam can be seen. The camera beams contain several electronic cameras which continuously monitor the whole width of a metal strip. The cameras are either solid-state line-scan cameras or matrix cameras. A linescan camera is the natural choice for this kind of application because the second dimension of the image (machine direction) is achieved with the help of the movement of the web. Line-scan cameras utilizing CCD technology have several advantages over matrix cameras when high quality of imaging is important. One obvious benefit is the capability to take sharp images over a curved surface of a roll. A line-scan camera has typically 1024–4096 pixels. The actual cross direction resolution depends on the imaging angle and the distance from the strip. The machine direction resolution is determined by line scan frequency and the strip speed. Typical values are fractions of a millimeter in both directions. The grayscale resolution depends on the properties and quality of the analog/digital conversion stage. A common target value is 256 levels (8 bit ADC) or more, but it can be reached only if all the preprocessing steps e.g. compensations for dark level and imaging unlinearities are done correctly.
Figure 1. A surface inspection system monitoring metal strip quality
161
Cameras can be either intelligent or standard. Intelligent cameras not only take images but also make various image processing and even classification tasks. Standard cameras just forward the image signal to a frame grabber located outside the camera, for example in a PC or special computing device. Regardless of the location where the defect detection is done, the results are normally handled in a PC which combines the information coming from different cameras to form various user displays and reports on the screen of an operator station. Flexibility for reaching various user needs is gained if the defect images and defect data are saved in a database. There are tens of different defect types recognized in defect classification. Common defect classes are shells, slag inclusions, scratches, roll imprints, pimples, indentations, flecks, holes, etc. Many of the defects originate in the rolling process where a high pressure is applied to the metal sheet to reduce its thickness and to achieve a desired surface quality. Various imprints and pimples are caused by either foreign matter or depressions on a work roll respectively. Inclusions and shells are typically caused by nonmetallic materials. Scratches can occur almost anywhere in the processing line. Indentations are caused by incorrect handling of rolls during transportation or storage. Holes are results of material tearing during rolling because of local weaknesses in the strip. Flecks are not necessarily actual defects but residuals of washing with water. However, defect classification on the basis of appearance is not always obvious. The classes can be more or less fuzzy and overlapping, especially if the correct classification according to the actual causes of defects is the goal. Interpretation of defect images can be a demanding task, even for an expert. Using an automatic inspection system makes it possible to verify the quality of production with 100% coverage consistently. With modern high-speed lines these targets are impossible to reach by human inspectors although their capability with specific recognizing tasks is superior. There are various alternatives to be used as a defect classifier. Due to large variability of different defects, a neural network-based classifier is often viable solution. Regardless of the classifier type used, finding a working structure and parameter values for it requires developing suitable methods and tools for managing defect data collected in the database. Depending on the processing line and quality requirements, the inspection system can easily collect data of thousands of defects each day. However, the number of seldom occurring but important defects can be low. Checking manually all the defects to locate these special cases would be a very tedious task, if not practically impossible. Automatic classification will not help much if the precise information about a new defect class is not known. Some automatic clustering
International Journal of Fuzzy Systems, Vol. 6, No. 3, September 2004
162
tool, for example a self-organizing map (SOM), is required. If the features describing the defects are selected appropriately, the occurrence of rare defect types can be indicated and used as a starting point for discovering the causes of these defects. A different case is the situation when a metal strip manufacturer wants to know whether particular defect types are present in a database. A solution for these problems is described in the following chapters.
3. Content-Based Image Retrieval In content-based image retrieval, similar images are searched from a database based on the similarity of their visual features. These features may be simple, such as color histograms and distributions, or very complex, such as hierarchical descriptions of the items in the image. The similarity search can then be done using these feature vectors. The calculated features form a feature space. To proceed, we also need a way to measure distances between these feature vectors, in other words we need a metric for the data space. Usually the features consist of n real numbers and the distances are measured with the Euclidean distance. When manipulating huge databases, a good index is a necessity. Processing every single item in a database when doing queries is extremely inefficient and slow. Raw image data is non-indexable as such, so the feature vectors must be used as the basis of the index. The problem is that indexing data points in a multidimensional vector space is a non-trivial task. We propose to solve this problem by using the self-organizing map (SOM) [6] as an index to the images’ feature space data. The SOM is trained to match the shape of the data in the feature space. After training, the closest node in the SOM is calculated for every image in the database. This information about the closest nodes is stored. When a query is done, the first thing to be done is to calculate the closest SOM node, also know as the best matching unit (BMU), to the query image’s feature vector. When this is done, we know which images in the database are the closest to the query image: the ones that map to the same node as the query image. This cuts down processing time significantly. An added bonus is the hierarchypreserving structure of the SOM. If we want to find more similar images, we can just examine the neighboring nodes of the BMU. 3.1. PicSOM Retrieval System PicSOM is a content-based image retrieval system for large, unannotated databases, developed at the Laboratory of Computer and Information Science at Helsinki University of Technology [8, 9]. It uses the self-organizing map (SOM) [6] as a means of indexing feature data from images. The SOM provides not only an
efficient indexing engine, but it also provides an automatic clustering of defect images that is very important in our case. This clustering can be used to reveal the main defect types and also to help to detect more rare defects. The retrieval process is implemented using relevance feedback. When training PicSOM, the first step is to calculate a number of features from the images in a database. These feature vectors are then used to train tree-structured SOMs (TS-SOM) [7]. The TS-SOM is a hierarchical structure that has a SOM at each level, with the map sizes increasing towards the bottom. The tree-structure speeds up the training and searching of the SOMs. After the training is complete, the distribution of the map units in the feature space reflects the distribution of the feature data. The feature vectors can then be associated with the nearest map unit in the feature space, i.e. the best matching unit (BMU). The maps in the TS-SOMs now serve as twodimensional indexes to the feature data. The feature vectors that have the same BMU are very similar, and the map units surrounding the BMU represent less similar feature vectors. The division of the map units into clusters in the feature space can be interpreted as a reflection of natural class divisions in the original image data. Searching in a database is iterative, beginning with the system presenting an initial set of images to the user, who can then select the images that best match the type of image that is being searched for. The system then assigns a positive relevance score to each map unit according to the number of selected images that have the unit as their BMU. A negative score is assigned to map units for all the images that were not selected by the user. The relevance values are then spread into the surrounding map units with low-pass filtering. Previously unseen images from the highest scoring map units are selected as candidates for the next phase. The scores of these images from each TS-SOM are summed, and the highest scoring images are shown on the next iteration. The selection process is repeated on each iteration, allowing the system to learn the search criteria based on the user’s feedback. Since each TS-SOM is trained with a different feature, the relevance patterns on the maps are different. If the images selected by the user form a cluster in a certain map, the scores for the images in the associated units cumulate, resulting in the map unit, and thus the associated images, having a higher score than any unit in a map where the selections are spread out. This way the relative importance of each feature in the search is automatically weighted. The PicSOM user interface is depicted in Figure 2. On the top are the bottom levels of the four TS-SOMs (one for each feature set) and then the images selected by the user. Below these are the 20 best-matches returned by PicSOM.
J. Iivarinen et al.: Content-Based Retrieval of Surface Defect Images with PicSOM
163
YCbCr color system. Discrete Cosine Transform is applied to the dominant colors in each channel and the DCT coefficients are used as a descriptor. y Color Structure (CS) slides a structuring element over the image. The numbers of positions where the element contains each particular color are stored and used as a descriptor. y Scalable Color (SC) is a 256-color histogram in HSV color space, which is encoded by a Haar transform. y Edge Histogram (EH) calculates the amount of vertical, horizontal, 45 degree, 135 degree and nondirectional edges in 16 sub-images of the picture, resulting in a total of 80 histogram bins. y Homogeneous Texture (HT) filters the image with a bank of orientation and scale tuned filters that are modeled using Gabor functions. The first and second moments of the energy in the frequency domain in the corresponding sub-bands are then used as the components of the texture descriptor. y Region-based Shape (RS) utilizes a set of 35 Angular Radial Transform (ART) coefficients that are calculated within a disk centered at the center of the image’s Y channel. The descriptors were calculated using the MPEG-7 eXperimentation Model (XM) software version 5.6.
Figure 2. The PicSOM user interface
4. Feature Descriptors Two types of features are of interest when considering defect images: shape features and internal structure features. Shape features are used to capture the essential shape information of defects in order to distinguish between differently shaped defects. Internal structure features are used to characterize the gray level and textural structure of defects. 4.1. MPEG-7 Standard Descriptors The MPEG-7 standard, ISO/IEC 15938, formally named “Multimedia Content Description Interface” [10, 11], provides standardized descriptions of streamed or stored images or video, to be used in searching, identifying, filtering and browsing images or video in various applications. The standard defines several still image descriptors. The descriptors used in this paper are: y Color Layout (CL) specifies a spatial distribution of colors. The image is divided into 8 × 8 blocks and the dominant colors are solved for each block in the
4.2. Simple Shape Descriptor The Simple Shape Descriptor (SSD) was developed for surface defect description in our earlier project [5]. It consists of several simple descriptors calculated from an object’s contour. The descriptors are convexity, principal axis ratio, compactness, circular variance, elliptic variance, and angle. The descriptors are not very efficient individually, but the combination of them has been shown in to produce good results with low computational costs [4].
5. Experiments 5.1. Image Database The image database contained 2004 defect images from an online metal web inspection system. The database was preclassified into 14 different classes, with each class containing from 101 up to 165 images. Example images from each class are shown in Figure 3. All images were gray-scale with 256 gray levels, dimensions ranging from less than 100 pixels up to over 1000 pixels. Each image was supplied with a segmentation mask, indicating the defect areas to be distinguished from the surface background. These masks were computed automatically. The images and the segmentation masks were provided by our industrial partner ABB Oy. Some example images and their segmentation masks are shown in Figure 4.
International Journal of Fuzzy Systems, Vol. 6, No. 3, September 2004
164
The effects of using several descriptors in the classification were evaluated by determining the classes of the 5 nearest neighbors for each descriptor and choosing the classification according to the class with the largest total number of occurrences. Using all seven descriptors in the classification increased the performance considerably, with the overall success rate being 76%, which is 13% more than with the best individual descriptor, Color Structure. Using only the four best descriptors achieved the same overall classification rate, so the remaining descriptors were excluded from further experiments. 1
2
5
3
6
8
9
12
4
7
10
13
11
14
Figure 3. Example images from the metal database classes
5.2. KNN Leave-one-out Cross-validation The performance of the descriptors was first evaluated with the K-Nearest Neighbor (K=5) leave-one-out crossvalidation. All calculations used Euclidean distances. The results in Table 1 show that the best descriptor is Color Structure, at an overall success rate of 63%, taken as an average weighted with the number of images in each class. The next best descriptors are Edge Histogram (49%), Homogeneous Texture (57%), and the Simple Shape Descriptor (42%). The remaining features performed considerably worse, with success rates less than 32%.
5.3. CBIR Performance The image retrieval performance of PicSOM was evaluated using a built-in testing system, which emulates a human user making queries and giving feedback on the retrieved images in order to find images belonging to a specific class. The results are recall and precision values for each retrieval iteration. Recall is the percentage of images belonging to the desired class that have been retrieved so far. A 100% recall means that all desired images have been found. Precision is the percentage of desired images from all the images retrieved so far. Precision should be higher than the a priori probability of the desired class, otherwise the system’s retrieval performance is worse than random selection. Figure 5(a) shows precision/recall graphs for the metal defect database, illustrating the retrieval performance as the query progresses. The average graph shown is a result of calculating for each iteration the weighted average of the precision and recall values over all classes. All three graphs show an increase in precision at the beginning of the query, which reflects the system’s ability to refine the search based on relevance feedback from the user. After this, the precision stays relatively stable, until a significant portion of the desired images has been retrieved. The easy class exhibits this behavior very clearly. Precision stays above 80% until almost 100% of the desired images have been retrieved, and then slopes down very abruptly. Typically the phases of the process are not so clearly defined, as is seen in the smoothly curving graphs for the difficult class and the average over all classes. Figure 5(b) shows recall/iteration graphs for the metal defect database. The graphs show how the system is able to retrieve the most relevant results very efficiently in the first few iterations. The last few remaining images in the desired class are typically very hard to retrieve. Since 20 images are retrieved on each iteration, and nearly all classes have between 140 and 160 images, an ideal system would achieve 100% recall after 8 iterations. Thus examining the system’s recall values at 8 iterations gives a good idea of the system’s retrieval performance.
J. Iivarinen et al.: Content-Based Retrieval of Surface Defect Images with PicSOM
2
165
4
6
9 14 Figure 4. Example images and their segmentation masks from the database. The numbers are corresponding class labels.
CS HT EH SSD SC CL RS All 3 best 4 best
Table 1. KNN classification results Classification success rates (%) of classes 1 2 3 4 5 6 7 8 9 10 29 57 72 45 71 71 80 30 82 59 33 53 38 44 64 73 57 31 64 59 37 45 27 30 62 63 54 26 55 61 29 45 8 33 42 59 55 40 25 46 22 25 40 10 44 22 43 20 51 28 22 18 16 29 36 17 18 5 35 28 16 13 14 8 29 38 24 9 17 13 47 77 71 61 87 84 89 54 92 76 43 74 75 55 83 89 86 46 85 78 51 75 71 56 84 88 89 55 87 80
Using more iterations would improve the results, but not in proportion to the number of additional iterations. Figure 6(a) shows the recall values at 8 and 16 iterations for each class and as a weighted average over all classes. On the average 62% recall is achieved after 8 iterations. The differences in performance among the classes are consistent with the results of the KNN cross-validation tests. Using the additional 8 iterations increases recall approximately by 25%. We ran the same tests also without the SSD feature set to examine its performance. The recall values after 8 and 16 iterations using only the three best features (excluding the SSD) are shown in Figure 6(b). It can be seen that the average recall rates are approximately 4% better with the SSD features than without them. This is much more than in the KNN classification where the performance gain was only 1%. Thus it can be said that the PicSOM makes really good use of this additional shape feature set. This is due to PicSOM’s ability to automatically weigh different feature sets according to their importance in each query. Some example query results can be seen in Figure 7. The leftmost image in each row was used as an initial query image. The four rightmost images are the best matches after 2–3 query iterations. At each query PicSOM returned 5 images of which the best ones were selected. This way we were trying to imitate the actual use of the
11 72 79 61 44 27 23 16 91 92 90
12 67 39 21 16 21 27 7 62 65 62
13 56 57 33 43 23 8 11 72 67 72
14 87 95 91 96 67 80 65 98 98 97
avg 63 57 49 42 32 27 20 76 75 76
PicSOM system where the user gives one image and tries to find within few queries similar images from the database.
6. Conclusions A content-based image retrieval system called PicSOM was applied to a database consisting of defect images obtained from a real metal web inspection system. The MPEG-7 descriptors Color Structure, Edge Histogram, and Homogeneous Texture, and our own Simple Shape Descriptors were used as features. Their performance was determined with the KNN classifications. These four feature sets were then implemented in PicSOM. The CBIR experiments showed that the SOM-based indexing engine of PicSOM was able to retrieve similar defect images accurately and efficiently from our database. The obtained recall and precision values show good performance that is also comparable to the ones obtained with a simple KNN classifier.
Acknowledgments The authors wish to thank the PicSOM group (J. Laaksonen, M. Koskela, E. Oja) at Helsinki University of Technology. The financial supports of ABB Oy and the Technology Development Centre of Finland (TEKES’s grant 40120/03) are gratefully acknowledged.
International Journal of Fuzzy Systems, Vol. 6, No. 3, September 2004
Recall
Precision
166
Recall
Iterations
(a)
(b)
Figure 5. (a) Precision/recall graphs and (b) recall/iteration graphs using the four best features Three best features
Recall
Recall
Four best features
Classes
Classes
(a)
(b)
Figure 6. Recalls at 8 and 16 iterations using (a) the four best features and (b) the three best features
Figure 7. Some example query results
J. Iivarinen et al.: Content-Based Retrieval of Surface Defect Images with PicSOM
167
Jukka Iivarinen received his M.Sc., Lic.Sc.(Tech.) and D.Sc.(Tech.) degrees in computer science from Helsinki University [1] A. Del Bimbo. Visual Information Retrieval. of Technology in 1994, in 1997, and in Morgan Kaufmann Publishers, Inc., 1999. 1998, respectively. He is currently a [2] M. Flickner, H. Sawhney, W. Niblack, J. Ashley, Q. researcher in the Lab. of Computer and Huang, B. Dom, M. Gorkani, J. Hafner, D. Lee, D. Information Science, HUT. He is the vice Petkovic, D. Steele, and P. Yanker. Query by image chairman of the Pattern Recognition and video content: The QBIC system. IEEE Society of Finland. He has acted as a referee in several conferences and journals, and is the coauthor Computer, 28(9):23–32, Sept. 1995. [3] J. Iivarinen, J. Pakkanen, and J. Rauhamaa. Content- of several conference papers and journal articles on image based image retrieval in surface inspection. In Proc. analysis, pattern recognition, and neural computing. His current of 7th Int. Conf. on Control, Automation, Robotics research interests include neural networks and computer vision, especially applications of the self- organizing map in image and Vision, pp. 24–28, Singapore, Dec. 3–6 2002. segmentation, classification and retrieval.
References
[4] J. Iivarinen, M. Peura, J. Särelä, and A. Visa. Comparison of combined shape descriptors for irregular objects. In Proc. of the 8th British Machine Vision Conference, vol. 2, pp. 430–439, University of Essex, UK, Sept. 8–11 1997. [5] J. Iivarinen and A. Visa. An adaptive texture and shape based defect classification. In Proc. of the 14th Int. Conf. on Pattern Recognition, vol. I, pp. 117– 122, Brisbane, Australia, Aug. 16–20 1998. [6] T. Kohonen. Self-Organizing Maps. Springer, Berlin, 3. extended edition, 2001. [7] P. Koikkalainen and E. Oja. Self-organizing hierarchical feature maps. In Proc. of 1990 Int. Joint Conf. on Neural Networks, vol. II, pp. 279–284, San Diego, CA, 1990. [8] J. Laaksonen, M. Koskela, S. Laakso, and E. Oja. PicSOM – content-based image retrieval with self-organizing maps. Pattern Recognition Letters, 21(13-14):1199–1207, 2000. [9] J. Laaksonen, M. Koskela, S. Laakso, and E. Oja. Self-organising maps as a relevance feedback technique in content-based image retrieval. Pattern Analysis and Applications, 4(2+3):140–152, 2001. [10] B. S. Manjunath, J.-R. Ohm, V. V. Vasudevan, and A. Yamada. Color and texture descriptors. IEEE Trans. on Circuits and Systems for Video Technology, 11(6):703–715, June 2001. [11] B. S. Manjunath, P. Salembier, and T. Sikora, editors. Introduction to MPEG-7: Multimedia Content Description Interface. John Wiley & Sons Ltd., 2002. [12] O. Marques and B. Furht. Content-Based Image and Video Retrieval. Kluwer, 2002. [13] J. Pakkanen, A. Ilvesmäki, and J. Iivarinen. Defect image classification and retrieval with MPEG-7 descriptors. In Proc. of the 13th Scandinavian Conf. on Image Analysis, LNCS 2749, pp. 349–355, Göteborg, Sweden, June 29–July 2 2003. [14] Y. Rui, T. S. Huang, and S.-F. Chang. Image retrieval: Current techniques, promising directions, and open issues. Journal of Visual Communication and Image Representation, 10(1):39–62, 1999
Rami Rautkorpi is a student in the Department of Electrical and Communications Engineering at Helsinki University of Technology. He is currently writing his thesis for the M.Sc. in Technology degree and is a research assistant in the Lab. of Computer and Information Science, HUT. His current interests include content-based image retrieval (CBIR) and image classification.
Jussi Pakkanen received his M.Sc. degree in engineering physics from Helsinki University of Technology in 2002. He is currently working as a researcher in the Lab. of Computer and Information Science, HUT. His goal is to obtain his Ph.D. sometime prior to the heat death of the universe. He is the coauthor of several conference papers and journal articles, whose topics include image analysis, content-based retrieval, indexing large databases and non-supervised learning. His current research interests revolve around creating new data analysis methods that can be efficiently applied to huge data sets. Juhani Rauhamaa was born in Iisalmi, Finland, on October 4, 1945. He received M.Sc. degree in electrical engineering in 1971 and Lic. Tech. degree in information technology in 1995, both from Helsinki University of Technology. He has been with ABB Oy since 1971 working in various product development and engineering management assignments especially for automation and process control systems in paper industries. Currently he is product manager at Web Inspection Systems department.