Context-based Natural Language Processing for GIS-based Vague Region Visualization 1,2Wei
1
Chen Department of Computer Science and Engineering, 2Department of Geography The Ohio State University, Columbus OH, USA 43210
[email protected]
(Montello, Goodchild, Gottsegen, & Fohl, 2003). Their approach collected hand-drawn point-based locations and plotted them on the map of the city. Such data collection process may be very costly compared to computer-based automated approach. By comparison, natural language processing (NLP) techniques such as part of speech tagging and parse tree generation provide powerful linguistic analysis tools that can help quickly retrieve data from a large number of corpus data (Jurafsky, Martin, Kehler, Vander Linden, & Ward, 2000). However, these NLP techniques have yet been widely used to extract geographic entities for visualizing vague regions like central Ohio. On the other hand, linguistic contexts of named entities are important for deciding its relevancy to the underlying vague regions. For instance, for a place to be part of central Ohio, it must be in the context of Ohio as a precondition. Propositional logic of context (PLC) is a logic model in the field of artificial intelligence for formalizing contexts into propositional calculus (BuvaE & Mason, 1993). Based on PLC, an arbitrary predicate calculus can be evaluated according to selected contexts. In this paper, central Ohio is chosen as the experimental area to experiment the context-based natural language approach for visualizing vague regions. News articles are used and analyzed on three contextual levels: document, paragraph and sentence. Results are visualized in GIS.
Abstract Vernacular regions such as central Ohio are popularly used in everyday language; but their vague and indeterministic boundaries affect the clarity of communicating them over the geographic space. This paper introduced a context-based natural language processing approach to retrieve geographic entities. Geographic entities extracted from news articles were used as location-based behavioral samples to map out the vague region of central Ohio. Particularly, part of speech tagging and parse tree generation were employed to filter out candidate entities from English sentences. Propositional logic of context (PLC) was introduced and adapted to build the contextual model for deciding the membership of named entities. Results were automatically generated and visualized in GIS using both symbol and density mapping. Final maps were consistent with our intuition and common sense knowledge of the vague region.
1
Introduction
Central Ohio is commonly used vernacular term to refer to an approximate area around the city of Columbus in Ohio. Although it may be effortless for humans to tell the relative location of this region, it remains challenging for computers to automatically locate this region by harvesting and analyzing online data such as news articles. Computers that are capable of automatically delineating such vague regions may be of potential use to social science researchers for understanding other concepts that may not be as obvious such as cultural regions, the Muslim world. In the study of vague regions, previous studies introduced a behavioral method to map out downtown Santa Barbara based on human survey data
1.1
News data
News articles are extracted from LexisNexis, a comprehensive database of both national and local news (Smith, Ellenberg, Bell, & Rubin, 2008). All articles are retrieved based on caseless keyword match for relevancy. The only keyword used is central Ohio and only news articles that contain this exact phrase are retrieved. As a result, 3281 different articles are collected which cover central Ohio news from the year 1990 to the year 2013.
8 Proceedings of the ACL 2014 Workshop on Language Technologies and Computational Social Science, pages 8–12, c Baltimore, Maryland, USA, June 26, 2014. 2014 Association for Computational Linguistics
1.2
slash in uppercase letters. For a complete list, one may refer to Penn Treebank tag sets.
Geonames database
Geonames database contains names and locations of geographic entities. We create our geonames database two sources: the United States Geological Survey's Geographic Names Information Server (USGS, 2013) and Census gazetteers (Census, 2013). Only place and feature names in Ohio used for analysis. Table 1 summarizes compositions of entities in our Ohio geonames database. Category Administrative places (1054 records)
Geographic features (67804 records)
Her/PRP$ friends/NNS at/IN the/DT Central/NNP Ohio/NNP Nazarene/NNP Church/NNP Camp/NNP she/PRP attended/VBD every/DT summer/NN in/IN Columbus/NNP convinced/VBD her/PRP to/TO attend/VB Mount/NNP Vernon/NNP Nazarene/NNP College/NNP in/IN Knox/JJ county/NN ,/, OH/NNP ./.
Box 1. Tagged sentence 2.2
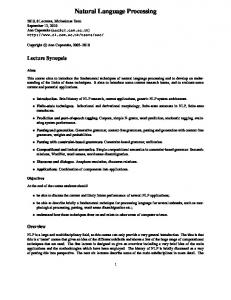
Stanford parsers are used to produce the parse tree from which noun phrases, named entity candidates, can be extracted (De Marneffe, MacCartney, & Manning, 2006) . Fig.1 shows the result of parsing the tagged sentence in Box 1. It is observed that only noun phrases (NP) at the lowest level of the tree are useful for extracting named entities. Noun phrases at other levels contain auxiliary structures such as prepositions often do not suggest named entities. In Fig.1, NPs in dashed rectangles are candidate entities that do not match any records in our Ohio database. When looking up the database for a match, determinants like the are skipped as well as entity type terms like city and county. To find the location of a matched entity, a SQL query is used to return the latitude and longitude pair.
Percentages 23.0% cities 66.3% villages 10.6% CDPs (census designated place) 14.9% church 13.7% school 12.6% populated place among 53 categories
Table 1. Geographic named entities in Ohio
2
Natural Language Processing
Part of speech tagging and parse tree generation are used to automatically extract geographic named entities from news articles in this paper. Part of speech (POS) tagging is the process of deciding the functions of words such as nouns or verbs. Parse tree generation is based on POS tagging results. It aims to generate hierarchical representations of sentences for semantic understanding (Jurafsky et al., 2000). Noun phrases in the parse tree are often useful indicators to named entities in geolinguistic analysis (Chen et al., 2013). 2.1
Parsing
Part of speech tagging
Part-of-speech (POS) tagging assigns a POS tag to each token in a sentence. A token can be either a word or a punctuation. The single best POS tag assigned to a token depends on the function of the word, the tag set, and POS tagging algorithm (Jurafsky et al., 2000). Contemporary POS taggers can reach an average accuracy of above 97% on tokens (Manning, 2011). The part of speech tagger we use is Stanford NLP tagger with english-caseless-left3wordsdistsim tagger model. This tagger model is trained with WSJ sections 0-18 and extra parser training data using the left3words architecture. It includes word shape and distributional similarity features for training the tagger (Gimpel et al., 2010). The results are represented using Penn Treebank tags and the average parsing accuracy is above 97% on sentences in news. Box 1 is the tagged sentence from one article with POS tags appended after the
Figure 1. Parse tree of tagged sentence in Box 1
3 3.1
Geographic Information Retrieval Propositional logic of context (PLC)
As previously discussed, candidate named entities are primarily noun phrases extracted at the root level of a parse tree. However, not all such entities should be considered as part of central Ohio. To determine the membership, we may define following logic heuristics: if (1) the name of an entity is in the same text segment as the phrase central Ohio and (2) the entity is an Ohio place, then the entity is of greater likelihood of being a central Ohio place than otherwise. Here, Ohio and central
9
Ohio are linguistic contexts for discriminating central Ohio entities. To formalize the contexts of analysis, we introduce propositional logic of context (PLC) (BuvaE & Mason, 1993). Here, we only adapt its basic form as it already suffice the needs of our analysis. For detailed information of PLC, one may read the original paper from BuvaE (BuvaE & Mason, 1993). The minimum PLC definition is below: x: subject p: preposition about the subject c: context c1c2: logic AND, intersection of two contexts c1c2: logic OR, union of two contexts ist(c, p): the proposition p is true in context c. 3.2
and normalization rules. We define three variables to count entity occurrences in different contexts: C𝑝𝑜𝑠 : positive count of the entity E. C𝑛𝑒𝑔 : negative count of the entity E. C𝑛𝑒𝑢 : neutral count of the entity E. IF ist(c1c2, p), C𝑝𝑜𝑠 ++. IF ist(c1c3, p), C𝑛𝑒𝑔 ++. IF ist(c1c2c3, p), C𝑛𝑒𝑢 ++. Based on observations, big cities like Columbus are mentioned more frequently than other smaller places in term of both C𝑝𝑜𝑠 and C𝑛𝑒𝑔 . As it is the difference between C𝑝𝑜𝑠 and C𝑛𝑒𝑔 that determines the sign of the membership, we decide to use C𝑛𝑒𝑢 as the normalization denominator for calculating the membership. Membership r of a place is calculated using Equation 1. It is a real value between -1 and 1. All places are classified by the sign of the membership as either central Ohio or not-central Ohio place with the magnitude of the value being the strength of the membership. 1 means definitely a central Ohio place and -1 means definitely not a central Ohio place.
PLC-based matching and counting
Based on the PLC definition, we count the mentions of named entities in all news articles. Here, we define the following PLC notations for our analysis: p: the preposition that x is a central Ohio city c1: the context of Ohio c2: the context of central Ohio c3: the context of not-central Ohio Ohio context is defined according to records in geonames database. If an entity name is in the database, it is said to be in the Ohio context. Central Ohio context is defined as the text segment containing both the entity name and the phrase central Ohio. Not-central Ohio context is defined as the text segment with the following terms in it: north(ern) Ohio, northeast(ern) Ohio, east(ern) Ohio, southeast(ern) Ohio, south(ern) Ohio, southwest(ern) Ohio, west(ern) Ohio, and northwest(ern) Ohio. Based on our observation, these eight azimuth phrases are found to be good indicators of places that are obviously not in central Ohio. Accordingly, three types of entity counts are also developed. (1) Positive count (E): the total number of occurrences of the name of an entity E in the context c1c2. (2) Neutral count (E): the total number of occurrences of the name of an entity E in the context c1c2c3. (3) Negative count (E): the total number of occurrences of the name of an entity E in the context c1c3. 3.3
𝑟={
(C𝑝𝑜𝑠 − C𝑛𝑒𝑔 )⁄C𝑛𝑒𝑢 , if C𝑛𝑒𝑢 > 0 𝐸𝑞𝑢𝑎𝑡𝑖𝑜𝑛 1 0 , 𝑜𝑡ℎ𝑒𝑟𝑤𝑖𝑠𝑒
As C𝑛𝑒𝑢 is in the denominator, it must not be zero. Given observations, entities with C𝑛𝑒𝑢 being zero are primarily entities with less than 3 total mentions. These entities take up 3.9% of all extracted entities. Therefore, we decide to exclude them from analysis as they are of a small percentage and are not expected to affect the overall results.
4
Results and discussions
Geographic entities are extracted from all 3281 news articles and their membership values are mapped using the geographic information system (GIS) software ArcGIS which are popular in social science geographic research. 4.1
Graduated symbol maps
Graduated symbol map is a type of map that uses symbols of different sizes to represent geographic entities (Thrall, 1999). The symbol we choose is circle. The radius of the circle is decided by the attribute value associated with each entity. The map is configured as follows: (1) The size of each point is proportioned to the membership of the underlying named entity with size 4 and 24 representing the minimum and maximum membership respectively. (2) Symbols are classified into 10 classes based on equal interval classification method.
Count and normalization
We calculate the membership of an entity to the concept central Ohio using following counting
10
There is one exception of using the membership for making the graduated symbol map. On the article level, all entity counts are added to C𝑝𝑜𝑠 , and therefore there are no negative or neutral counts. To make a map on the article level, we only use the positive count as the surrogate to the membership value. Graduated symbol maps on three analytical levels are shown in Fig. 2. Results on the sentence level and paragraph levels conforms better to our intuition and common sense knowledge than on the article level. This is because results on the article level do not consider the contexts of c1 and c2 discussed in section 4.2. Results from the sentence and paragraph levels are very similar with the membership on the paragraph level being slightly more visually significant.
trend over the space of Ohio. Fig. 3 is a kernel density result based on the paragraph level. It shows that the concept of central Ohio generated through automated approach conforms to our common sense knowledge of the assumptive location of the vague region.
Figure 3. Kernel density map of central Ohio
5
Vague geographic regions are important part of the entire geographic space; however they are difficult to be located and delineated on a map. Geographic questions like Where is central Ohio? remains a challenge to computers because computers are not automatically given the knowledge of either central or Ohio as humans do. This paper introduced a context-based approach to extract geographic entities from news articles. Propositional logic of context was adapted to contextualize the reasoning process. Three types of context have been defined: Ohio, central Ohio, not-central Ohio, which corresponded to Ohio places, central Ohio places and not-central Ohio places, respectively. Analysis was conducted on three contextual levels: article, paragraph and sentence. Visualization results showed that context was of significant importance to deciding the membership of a place to central Ohio. Without defining the context (e.g. results on the article level in Fig. 2), visualization results were largely incorrect compared with common sense knowledge. Natural language processing (NLP) techniques such as part of speech tagging and parse tree generation were shown to be effective for extracting geographic information. Noun phrases could serve as good candidates to place names. For future research, we suggest studies on experimenting with different regional concepts using proposed approach. It may also be useful to experiment with methods that can quickly generate samples other than the tree parsing method used in this paper. Despite the possibility of generating more coarse results, noisier method may be more scalable for building practical applications with scaled live data.
Figure 2. Graduated symbol map of central Ohio 4.2
Conclusions
Kernel density map
Results produced by graduated symbol maps are not continuous. Kernel density mapping is a GIS mapping technique that generates a continuous surface based on the locations of the entities and their attribute values (Elgammal, Duraiswami, Harwood, & Davis, 2002). To create kernel density maps, a search radius need be defined. All data points within this radius will be used to interpolate a density area using a quadratic kernel function described in Silverman (p. 76, equation 4.5) (Silverman, 1986). The kernel density tool in ArcGIS is used to create the density map. In ArcGIS, the search radius is defined as a percentage of the area’s minimum extent width. We experiment on choosing 1/10, 1/5, 1/20 of the area’s minimum extent width as the radius to generate the surface and find 1/10 of the width most appropriate to generate a balanced looking map. A kernel density map of central Ohio visualizes its estimated central location and extending 11
controversy and its relationship to MMR immunization rates in the United States. Pediatrics, 121(4), e836-e843. Thrall, Susan Elshaw. (1999). Geographic information system (GIS) hardware and software. Journal of Public Health Management and Practice, 5(2), 82&hyhen. USGS. (2013). Geographic Names Information Server. from http://geonames.usgs.gov/index.html
Acknowledgements The author would like to thank Dr. Xiang Chen, Dr. Zhe Xu, Dr. Lili Wang, Dr. Xueying Zhang, Dr. Bo Zhao, Dr. Ningchuan Xiao and two other anonymous reviewers for their valuable comments and suggestions for improving the paper. Presentation of the work was supported by the research data and computing center of the research institute at the Nationwide Children’s Hospital.
Reference BuvaE, Saga, & Mason, Ian A. (1993). Propositional logic of context. Paper presented at the Proceedings of the eleventh national conference on artificial intelligence. Census. (2013). U.S. Gazetteer Files. from http://www.census.gov/geo/www/gazetteer/files/Ga z_places_national.txt Chen, Wei, Fosler-Lussier, Eric, Xiao, Ningchuan, Raje, Satyajeet, Ramnath, Rajiv, & Sui, Daniel. (2013). A Synergistic Framework for Geographic Question Answering. Paper presented at the Semantic Computing (ICSC), 2013 IEEE Seventh International Conference on. De Marneffe, Marie-Catherine, MacCartney, Bill, & Manning, Christopher D. (2006). Generating typed dependency parses from phrase structure parses. Paper presented at the Proceedings of LREC. Elgammal, Ahmed, Duraiswami, Ramani, Harwood, David, & Davis, Larry S. (2002). Background and foreground modeling using nonparametric kernel density estimation for visual surveillance. Proceedings of the IEEE, 90(7), 1151-1163. Gimpel, Kevin, Schneider, Nathan, O'Connor, Brendan, Das, Dipanjan, Mills, Daniel, Eisenstein, Jacob, . . . Smith, Noah A. (2010). Part-of-speech tagging for twitter: Annotation, features, and experiments: DTIC Document. Jurafsky, Dan, Martin, James H, Kehler, Andrew, Vander Linden, Keith, & Ward, Nigel. (2000). Speech and language processing: An introduction to natural language processing, computational linguistics, and speech recognition (Vol. 2): MIT Press. Manning, Christopher D. (2011). Part-of-speech tagging from 97% to 100%: is it time for some linguistics? Computational Linguistics and Intelligent Text Processing (pp. 171-189): Springer. Montello, Daniel R, Goodchild, Michael F, Gottsegen, Jonathon, & Fohl, Peter. (2003). Where's downtown?: Behavioral methods for determining referents of vague spatial queries. Spatial Cognition & Computation, 3(2-3), 185-204. Silverman, Bernard W. (1986). Density estimation for statistics and data analysis (Vol. 26): CRC press. Smith, Michael J, Ellenberg, Susan S, Bell, Louis M, & Rubin, David M. (2008). Media coverage of the measles-mumps-rubella vaccine and autism
12