Continuous measurement of soil respiration at a larch forest in Eastern Siberia Takashi Hirano1,*, Larry Lopez2, Yoshikazu Kobayashi3, Takashi Machimura4, Go Iwahana2, Satoshi Tamura1, Yuji Kodama2, Alexander N. Fedorov5, and Masami Fukuda2 1
2
Graduate School of Agriculture, Hokkaido University, Sapporo, Japan Institute of Low Temperature Science, Hokkaido University, Sapporo, Japan 3 National Institute of Agro-Environmental Sciences, Tsukuba, Japan 4 Graduate School of Engineering, Osaka University, Suita, Japan 5 Permafrost Institute, Yakutsk, Republic of Sakha, Russian Federation *
Corresponding author:
[email protected]
1. INTRODUCTION Forests dominated by larch (Larix gmelinii) are extensively distributed on permafrost in northern East Asia (Gower and Richards, 1990). It is suggested that the boreal forest is a large CO2 sink (Denning et al., 1995; Otto-Bliesner and Upchurch, 1997). The extensive larch forests probably play an important role in the global carbon cycle. However, field measurement of CO2 exchange between the atmosphere and larch ecosystems is very limited in Siberia (Dolman et al., 2004; Machimura et al. 2005). We measured soil respiration, which is a major CO2 source in the terrestrial ecosystem (Schimel, 1995), continuously during the growing seasons in three years, 2003 to 2005, at a larch forest in eastern Siberia.
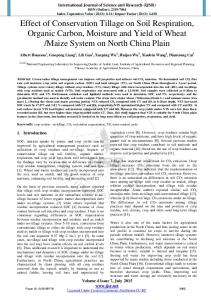
2. MATERIALS AND METHODS 2.1 Study site The study site was a mature larch forest located 25 km northeast of Yakutsk, Republic of Sakha, Russian Federation (62.3°N, 129.5°E). The forest was developing on permafrost. The dominant tree species was larch (Larix gmelinii) with density of 2100 stems ha-1 (Yajima et al., 1998). The forest floor was covered mainly with shrub and moss. Soil texture was loamy and soil organic content in the top 1-m layer was 13.2 kgC m-2 (Sawamoto et al., 2003). 2.2 Chamber method Soil respiration (Rs) was measured continuously with an automated closed/open chamber system during three growing seasons in 2003, 2004 and 2005 on the forest floor. The automated system consisted of five chambers made from opaque PVC with a covering ground area of 0.0186 m2, a data logger (CR10X, CSI), an infrared CO2 analyzer (LI820, Licor), an air pump, and some electric parts to
Fig. 1. Chamber configuration in 2004 and 2005.
Symptom of Environmental Change in Siberian Permafrost Region, Eds. Hatano R and Guggenberger G, p 151-157, Hokkaido University Press, Sapporo, 2006
152
Hirano et al.
switch the airflow between the analyzer and chambers. Each chamber was closed for 6 min one after another. Rs was calculated from an increasing rate of CO2 concentration in chamber headspace for the last 4 min. Chambers were installed on collars, which were inserted 2 cm deep into the ground. In 2003, the chamber system was shared with another site in shifts of one week each. Also, one chamber broke down throughout the season. Thus, Rs was measured at 4 points at intervals of one week from June 5 to September 18 (47 days). Contrastively, Rs was measured continuously from May 12 to September 29 (141 days) for 2004 and from May 7 to September 27 (144 days) for 2005. In 2004 and 2005, one chamber was fixed on one point and other 4 chambers were moved between 2 points at intervals of 7–10 days (Fig. 1). 2.3 Data analysis We analyzed temperature responses of daily mean Rs (gC m-2 d-1) calculated from half-hourly measurements using the following well-known exponential equation: Rs = a exp(bT ) , (1) where a and b are fitted constants, and T is soil temperature (°C). In addition, Rs was normalized using equation (2) to eliminate its temperature response: Rs ,b = Rs exp(b(Tb − T )) , (2) where Rs,b is normalized Rs at Tb, and Tb is base temperature (°C). For the analysis and discussion, we used meteorological data including soil temperature and soil moisture, which were measured at the same site.
3. RESULTS AND DISCUSSION 3.1. Temperature response Rs increased with soil temperature on a daily basis (Fig. 2). In all years, r2 was highest with T at depth of 10 cm (T10) among depth of 5, 10, 15 and 25 cm. Seasonal variations in Rs can be explained by T10 by 75, 89 and 88–94% in 2003, 2004 and 2005, respectively. In 2004, Rs deviated below from its exponential relationship from July 4 to July 26 (DOY186–208) (Fig. 2b). On the other hand, Rs was divided into two groups before and after mid-July in 2005. Rs jumped up from the first group into the second one between July 15 (DOY196) and July 16 with precipitation of 17 mm (Fig. 2c). Although data of 2004 and 2005 almost overlapped, data of 2003 were smaller than other data (Fig. 2d). 5
6
3
RS (gC m-2 d-1)
RS (gC m-2 d-1)
a) 2003 4 r2 = 0.75
2 1
DOY 186-208 DOY 133-185, 209-273
4 3
r2 = 0.89
2 1
0
0 2
4 6 8 10 12 14 Soil temperature (°C, 10cm)
-2
8
4 r2 = 0.88
2
RS (gC m-2 d-1)
d) 2003-2005
DOY 127-196 DOY 197-271
6
0 2 4 6 8 Soil temperature (°C, 10cm)
8
c) 2005 RS (gC m-2 d-1)
b) 2004
5
2003 2004 2005
6 4
r2 = 0.67
2
r2 = 0.94
0
0 0
2 4 6 8 10 12 Soil temperature (°C, 10cm)
-2
0 2 4 6 8 10 12 14 Soil temperature (°C, 10cm)
Fig. 2. Relationship between daily Rs and soil temperature at depth of 10 cm for a) 2003, b) 2004, c) 2005 and d) all years. Exponential curves are fitted.
Continuous measurement of soil respiration at a larch forest
153
Daily Rs (gC m-2 d-1)
3.2. Seasonal variation There were spatial variations in Rs, and the variations increased in July and August (Fig. 3). To investigate temporal variation in Rs during the growing season from May through September, data gaps occurring at one-week intervals were filled from T10 using equation (1) at each point on a daily basis. 6 5
a) 2003
3 2 1
Daily Rs (gC m-2 d-1)
0 120
Daily Rs (gC m-2 d-1)
Fig. 3. Seasonal variations in daily Rs measured in a) 2003, b) 2004 and c) 2005. Different symbols denote different points.
4
140
7 6 b) 2004 5 4 3 2 1 0 120 140 12 10 c) 2005
160
180
200
220
240
260
280
160
180
200
220
240
260
280
160
180
200 DOY
220
240
260
280
8 6 4 2 0 120
140
Fig. 4 shows seasonal variations in spatially averaged Rs along with T10, soil moisture and precipitation. In 2003, Rs changed almost in parallel with soil temperature; it peaked at 4.5 gC m-2 d-1 on July 26 with daily mean T10 of 12.7°C. Contrastively, Rs peaked on August 22 at 4.8 gC m-2 d-1 in 2004, which was about one month later than in 2003. This late peak was caused by low temperature and less precipitation in July. In 2005, Rs suddenly doubled at mid-July from 3.4 to 6.5 gC m-2 d-1. Precipitation over 10 mm after a dry period of 45 days caused the doubling of Rs. Rs kept a high level until late August. Rs was normalized at 6°C using equation (2) for 2004 and 2005 to eliminate the temperature effect from seasonal variation (Fig. 5); a temperature coefficient of b was obtained from all data in both years (Fig. 2d). We excluded Rs in 2003, because its temperature response differed (Fig. 2d). Seasonal variations in normalized Rs (Rs,6) were generally similar to each other. In 2004, Rs,6 kept low at 2.0–2.5 gC m-2 d-1 until late May and increased in June with fluctuation between 2.5 and 3.5 gC m-2 d-1. Rs,6 decreased again to about 2.0 gC m-2 d-1 in July and suddenly increased at the end of July. Rs,6 gradually increased until late August and decreased with fluctuation in September. In 2005, Rs,6 decreased gradually until mid-July at a low level below 2.5 gC m-2 d-1 and jumped up above 3.5 gC m-2 d-1. After mid-July, Rs,6 kept high until early September and gradually decreased toward the end of September. These seasonal variations were related to the development of the active layer of permafrost, precipitation patterns and larch phenology. Low Rs,6 measured until late May in 2004 was probably caused by shallow active layer. On the other hand, low Rs,6 until around mid-June in 2005 was probably related to high soil moisture, which was caused by a larger amount of snow
154
Hirano et al.
Soil temperature (°C)
Daily Rs (gC m-2 d-1)
accumulation during the previous winter than normal winter. Gradual decrease in September was probably related to the phenological change of larch functions, including needle senescence. A sudden drop in September 2004 would be related to soil desiccation, because a positive linear relationship of Rs,6 was found with soil moisture (r2 = 0.55) in late August and September. 7 6 a) Rs 5 2003 2004 4 2005 3 2 1 0 120 140
15
Soil moisture (m3 m-3)
180
200
220
240
260
280
200
220
240
260
280
b) Soil temperature (10 cm)
10 5
2003 2004 2005
0 -5 120
Precipitation (mm d-1) Precipitation (mm d-1) Precipitation (mm d-1)
160
Fig. 4. Seasonal variations in a) daily Rs spatially averaged after gap-filling, b) daily mean soil temperature at depth of 10 cm, c) soil moisture at depth of 5 cm, d) daily precipitation in 2003, e) 2004 and f) 2005, from May 1 to September 30.
140
160
180
0.8
c) Soil moisture (5 cm)
0.6
2003 2004 2005
0.4 0.2 0.0 120 140 160 180 35 30 d) Precipitaion (2003) 25 20 15 10 5 0 120 140 160 180 35 30 e) Precipitaion (2004) 25 20 15 10 5 0 120 140 160 180 35 30 f) Precipitaion (2005) 25 20 15 10 5 0 120 140 160 180
200
220
240
260
280
200
220
240
260
280
200
220
240
260
280
200 DOY
220
240
260
280
We focused on the summer period between mid-July and early August, DOY170–220, when Rs,6 increased considerably (Fig. 6). Increase in Rs,6 was triggered by precipitation of about 10 mm at late-July in 2004 and mid-July in 2005. Precipitation increases soil moisture and directly affects soil respiration. However, it is difficult to explain the pattern of Rs,6 by only soil
Continuous measurement of soil respiration at a larch forest
155
VPD (hPa)
Normalized Rs (gC m-2 d-1)
moisture, because Rs,6 was independent of decrease in soil moisture between DOY170 and 195 in 2005. In addition, Rs,6 slowly increased during DOY199–205 in spite of decreasing soil moisture in 2004. For 50 days of midsummer, Rs,6 showed a decreasing relationship with atmospheric water vapor deficit (VPD) (Fig. 7); the relationship can be fitted to a rectangular hyperbola (r2 = 0.45). It was reported that stomatal conductance of larch trees in eastern Siberia sharply decreased as VPD increased, and it regulated CO2 uptake of larch forest (Dolman et al., 2004). Also, recent studies showed the coupling of canopy gas exchange with soil respiration (Irvine et al., 2005; Tang et al., 2005). Therefore, high VPD probably decreased larch photosynthesis through stomatal closure, and consequently decreased Rs,6 indirectly. 5
a) Normalized Rs at 6°C
2004 2005
4 3 2 1 120 140 160 180 30 b) VPD above canopy 25
200
220
240
260
Fig. 5. Seasonal variations in a) normalized daily Rs at 6°C and b) daily mean VPD above canopy, from May 1 to September 30.
280
2004 2005
20 15 10 5 0 120
140
160
180
200 DOY
220
240
260
280
3.2. Interannual variation The cumulative change of Rs was shown in Fig. 8 for 153 days from May 1 to September 30. Cumulative Rs was largest in 2005 and smallest in 2003 throughout the period, whereas cumulative Rs was very similar between 2004 and 2005 until the end of June in spite of large difference in soil temperature (Fig. 4). The sum of Rs for the growing season of 153 days was 272 ± 48 (mean ± standard deviation), 338 ± 46 and 479 ± 94 gC m-2 for 2003, 2004 and 2005, respectively; these values are mean and standard deviation of 4 or 9 points (Fig. 9). The growing season Rs was significantly larger in 2005 than other two years by Tukey-Kramer test (p < 0.01), whereas it was not significantly different between 2003 and 2004. The seasonal sum of precipitation was 226, 118 and 191 mm for 2003, 2004 and 2005, respectively. In addition, the seasonal mean of T10 was 5.1, 3.4 and 6.3°C for 2003, 2004 and 2005, respectively (Fig. 4). As a result, the climate of the growing season in 2005 was warm and moist compared with that in 2004. This temperature difference mainly caused large difference in Rs between 2004 and 2005, because the relationship between Rs and T10 was almost identical (Fig. 2d). Also, relatively moist climate would partly increased Rs in 2005, which was typically shown in September (Fig. 5). As for the year of 2003, Rs was smallest among 3 years in spite of the largest precipitation and second highest soil temperature. Thus, Rs in 2003 may be questionable because of insufficient replication and frequency of measurement. Although winter soil respiration has large variation within vegetation types, it accounts for roughly 20% of annual soil respiration for tundra and boreal forests (Hobbie et al., 2000). Using this information, annual Rs can be estimated at 423 and 599 gC m-2 y-1 for 2004 and 2005, respectively. These estimated values are slightly larger than annual soil respiration reviewed by Raich and Schlesinger (1992).
156
Hirano et al.
Normalized Rs (gC m-2 d-1)
4.5 4.0 a) Normalized Rs at 6°C 3.5 3.0 2.5 2.0 1.5 170 180 190 30 b) VPD above canopy 25 20 15 10 5 0 170 180 190 0.30 c) Soil moisture (5 cm)
2004 2005
200
210
VPD (hPa)
2004 2005
200
210
220 2004 2005
0.25 0.20 0.15 170 180 190 14 12 d) Precipitation (2004) 10 8 6 4 2 0 170 180 190 25 20 e) Precipitation (2005)
200
210
220
200
210
220
200
210
220
Precipitation (mm d-1)
Precipitation (mm d-1)
Soil moisture (m3 m-3)
220
Fig. 6. Variations in a) normalized daily Rs at 6°C, b) daily mean VPD above canopy, c) soil moisture at depth of 5 cm, d) daily precipitation in 2004 and e) in 2005, during midsummer from DOY170 to 220.
15 10 5 0 170
180
190
Normalized Rs (gC m-2 d-1)
DOY
5 2004 2005
4
r2 = 0.45
3 2 1 0
Cummulative Rs (gC m-2)
Fig. 7. Relationship between normalized daily Rs at 6°C and daily mean VPD above canopy from DOY 170 to 220. A rectangular hyperbola is fitted to all data (r2 = 0.45).
5
10 15 20 VPD (hPa)
25
30
500
Fig. 8. Cumulative change of Rs during the growing season from May 1 to September 30.
2003 2004 2005
400 300 200 100 0 0
20
40 60 80 100 120 140 Days after May 1 until September 30
160
Seasonal sum of Rs (gC m-2)
Continuous measurement of soil respiration at a larch forest
157
600 500
Fig. 9. Comparison of Rs summed for the growing season among 3 years. A vertical bar denotes standard deviation.
400 300 200 100 0 2003
2004 Year
2005
Acknowledgements. This study was conducted as a part of the CREST program by Japan Science and Technology and the RR2002 program by the Ministry of Education, Culture, Sports, Science, and Technology of Japan (MEXT). This study was also supported by Grant-in-Aid for Scientific Research (14102008) from MEXT.
REFERENCES Denning AS, Fung IY, Randall D (1995) Latitudinal gradient of atmospheric CO2 due to seasonal exchange with land and biota. Nature 376, 240-243. Dolman AJ, Maximov TC, Moors EJ, Maximov AP, Elbers JA, Kononov AV, Waterloo MJ, van der Molen MK (2004) Net ecosystem exchange of carbon dioxide and water of far eastern Siberian larch (Larix cajanderii) on permafrost. Biogeosciences 1, 133-146. Gower ST, Richards JH (1990) Larches: deciduous conifers in an evergreen world. BioScience 40, 818-826. Hobbie SE, Schimel JP, Trumbore SE (2000) Controls over carbon storage and turnover in high-latitude soils. Global Change Biol. 6 (Suppl. 1), 196-210. Irvine J, Law BE, Kurpius MR (2005) Coupling of canopy gas exchange with root and rhizosphere respiration in a semi-arid forest. Biogeochemistry 73, 271-282. Machimura T, Kobayashi Y, Iwahana G, Hirano T, Lopez L, Fukuda M, Fedorov AN (2005) Change of carbon dioxide budget during three years after deforestation in eastern Siberian larch forest. Journal of Agric. Meteorol. 60, 653-656. Otto-Bliesner BL, Upchurch GR Jr. (1997) Vegetation-induced warming of high latitude regions during the late cretaceous period. Nature 385, 804-807. Raich JW, Schlesinger WH (1992) The global carbon dioxide flux in soil respiration and its relationship to vegetation and climate. Tellus 44B, 81-99. Sawamoto T, Hatano R, Shibuya M, Takahashi K, Isaev AP, Desyatkin RV, Maximov TC (2003) Changes in net ecosystem production associated with forest fire in Taiga ecosystems, near Yakutk, Russia. Soil Sci. Plant Nutr. 49, 493-501. Schimel DS (1995) Terrestrial ecosystems and the carbon cycle. Global Change Biol. 1, 77-91. Tang J, Baldocchi DD, Xu, L (2005) Tree photosynthesis modulates soil respiration on a diurnal time scale. Global Change Biol. 11, 1298-1304. Yajima T, Takahashi K, Sasaoka E, Hatano R, Sawamoto T, Ivanov BI, Isaev AP, Maximov TC (1998) Stand structure and biomass of Larix cajanderi forest in the Siberian taiga. In: Proceedings of the Sixth Symposium on the Joint Siberian Permafrost Studies between Japan and Russian in 1997, pp 72-80.